
Abstract
Increasing electrode thickness is one route to improve the energy density of lithium-ion battery cells. However, restricted Li+ transport in the electrolyte phase through the porous microstructure of thick electrodes limits the ability to achieve high current densities and rates of charge/discharge with these high energy cells. In this work, processing routes to mitigate transport restrictions were pursued. The electrodes used were comprised of only active material sintered together into a porous pellet. For one of the electrodes, comparisons were done between using ice-templating to provide directional porosity and using sacrificial particles during processing to match the geometric density without pore alignment. The ice-templated electrodes retained much greater discharge capacity at higher rates of cycling, which was attributed to improved transport properties provided by the processing. The electrodes were further characterized using an electrochemical model of the cells evaluated and neutron imaging of a cell containing the ice-templated pellet. The results indicate that significant improvements can be made to electrochemical cell properties via templating the electrode microstructure for situations where the rate limiting step includes ion transport limitations in the cell.
Export citation and abstract BibTeX RIS
Lithium-ion (Li-ion) batteries have achieved significant commercial success and found widespread use in numerous applications, particularly for powering small devices including consumer electronics. However, to meet the ever-increasing power and energy demands for these devices, further improvements in Li-ion batteries are needed, which is of significant fundamental interest. 1,2 To develop more powerful Li-ion batteries, one of the most important areas of research focus is to discover and characterize new electrode and electrolyte materials. 3,4 However, another route to improve energy and power density is through electrode or cell engineering. There are several options to modify the electrode or cell design and structure; however, the two most relevant components to the study herein are to increase the relative fraction of active material in the cell and modify the electrode microstructure for improvement of transport properties. 5–7
For conventional composite Li-ion battery electrodes, carbon additives and polymer binders are blended with active material powders to provide the desired mechanical properties and electronic conductivity for the electrode. During electrode fabrication, a slurry containing active material and inert additives is coated onto a metal current collector to form a thin electrode. 6 The thickness of the electrode and relative fraction of the active material are two factors which determine the overall energy density within the final battery cell. 5,6,8 Thus, developing thicker electrodes as well as reducing inert additives would both increase the energy density of the cell. However, increasing the volume fraction of active electrode material and electrode thickness must be balanced with other competing factors such as limitations in ion transport for thicker electrodes and electrode mechanical properties. 8,9 Recently, methods have been reported to fabricate very thick electrodes containing only active materials by sintering pure active materials into porous thin films via hydraulic compression and thermal treatment. 6,10,11 These "sintered electrodes" do not contain any conductive or binder additives and are generally much thicker than composite electrodes.
Compared to composite electrodes, reports have shown that thick sintered electrodes can have much higher energy density and areal capacity at the cell level, but sintered electrodes also exhibit lower mass-based capacity utilization at higher charge/discharge rate. 6,11,12 This is due to the increased polarization for the sintered electrodes due to electron and ion transport through the electrode matrix and microstructure, respectively. Matrix electronic conductivity of the composite electrodes is primarily facilitated by the conductive additives (e.g., carbon black), which is several orders of magnitude higher than pure active material particles that must conduct electrons throughout the sintered electrodes. 13,14 It is noted, however, that for some electrode materials such as LiCoO2 (LCO) and Li4Ti5O12 (LTO), that slight changes in the extent of lithiation due to electrochemical charge/discharge result in dramatic increase in the electronic conductivity relative to the initial pristine material. 13,15 The improvement in electronic conductivity with a change in the extent of lithiation is expected to help compensate for the overall lower electronic conductivity in sintered electrodes. Another cause for increased polarization and limited rate capability in sintered electrodes is the increased resistance to ion transport through the thick electrode microstructure. This limitation is generally attributed to the relatively large thickness of the electrodes, though the lack of inactive composite components in the interstitial regions between the particles likely improves ion transport relative to a composite electrode with equivalent active material volume fraction and total electrode thickness. Previous reports have suggested the ion transport limitations were the greatest contributor to rate capability limitations for thick sintered electrodes. 16,17 Thus, to mitigate this ion transport challenge and improve the rate capability of thick sintered electrodes, improvements will be needed in the microstructure of the electrodes, the electrolyte transport properties, or both. This paper will focus on an effort to control and improve the ion transport properties of the sintered electrodes through modification of the electrode microstructure. One route to improve transport through the electrode microstructure is to provide alignment of the pores in the direction of the net ion flux during charge/discharge, and recently different techniques have been applied to fabricate thick electrodes with aligned pores to achieve this goal. 7,18–20 Among these techniques, ice-templating (also known as freeze casting) is a promising method that is particularly well-suited to fabricate sintered electrodes with aligned pores, i.e., directional porosity. Ice templating involves preferentially growing ice crystals within a particulate suspension in the direction of an applied unidirectional temperature gradient, sublimation of the water phase, and then thermal treatment to sinter the templated structure that retains aligned pore architecture and provides strength to the porous electrode. 7,21,22 Compared to electrodes fabricated without ice-templating, ice-templated electrodes have lower pore tortuosity, which improves the effective ionic conductivity within the liquid phase-laden pore microstructure, and the enhanced ionic conductivity improves the rate capability of the electrodes. 7,23–26 However, a detailed comparison of the electrochemical properties between the ice-templated sintered electrodes and pressed sintered electrodes with nominally equivalent geometric density would provide further support to the benefits of employing the ice-templating technique toward developing sintered electrodes for Li-ion batteries.
In this work, we prepared sintered LTO anodes via both the ice-templating technique and regular hydraulic pressing technique—where the hydraulic pressed sample had a geometric density and thickness targeted to match the ice-templated sample. After being paired with pressed sintered LCO electrodes, the electrochemical properties of the LTO-LCO full cells were evaluated. The impact of electrode tortuosity on Li+ transport will be discussed in the context of the electrochemical outcomes and calculations based on an electrochemical model, though it is noted that other effects such as electrolyte accessibility would also lead to alleviating the transport restrictions in the electrode microstructure. To further support the electrochemical and modelling outcomes, in operando neutron imaging was conducted to support the redistribution of the Li+ during discharge. 17,27–29 The combination of the experimental and computational efforts provides insights into the net impacts of aligning the pore microstructure within sintered electrode Li-ion batteries.
Materials and Methods
Particle material preparation
Active material particles
LiCoO2 (LCO) was used as the cathode material. LCO was prepared from a CoC2O4·2H2O precursor synthesized via coprecipitation. 30 First, 1800 ml of 62.8 mM Co(NO3)2·6H2O (Fisher Reagent Grade a ) solution and 1800 ml of 87.9 mM (NH4)2C2O4·H2O (Fisher Certified ACS) solution were prepared separately in deionized water. Both solutions were heated to 50 °C, and the Co(NO3)2·6H2O solution was then poured into the (NH4)2C2O4·H2O solution all at once. A polytetrafluoroethylene (PTFE) stir bar was used to maintain solution mixing at a stir rate of 800 rpm. After coprecipitation at 50 °C for 30 min, the solid precipitate was collected using vacuum filtration and rinsed with 4 l deionized water. The powder was then dried in an oven which was set at 80 °C in air atmosphere for 24 h.
Then, to prepare the LCO active material, the oxalate precursor powder was mixed with Li2CO3 (Fisher Chemical) powder using mortar and pestle. The molar ratio of the two powders was targeted to be 1.02:1 for Li:Co. The powder mixture was placed in a Carbolite CWF 1300 box furnace and heated to 800 °C at a ramp rate of 1 °C min−1 under an air atmosphere. After reaching 800 °C, the heat was turned off and the product was cooled to room temperature in the furnace without controlling the cooling rate. Then the product LCO material was ground with mortar and pestle by hand and was further milled in a Fritsch Pulverisette 7 planetary ball mill using 5 mm diameter zirconia beads at 300 rpm for 5 h.
Li4Ti5O12 (LTO) was used as anode material and was purchased from a commercial supplier (NANOMYTE BE-10 from NEI Corporation). No additional treatment was applied before processing this material powder into a sintered electrode. The characterization and electrochemical performance of both LCO and LTO material used in this study can be found in previous publications. 30,31
Polystyrene particles
Colloidal polystyrene particles (diameters 300 nm to 500 nm) were synthesized using procedures adapted from literature. 32 Styrene (Sigma-Aldrich, ReagentPlus, with 4-tert-butylcatechol as stabilizer, ≥99.0%) was pretreated using a prepacked column (Sigma-Aldrich, Inhibitor, prepacked column for removing tert-butylcatechol) to remove the polymerization inhibitor. In a typical synthesis, a three-neck 500 ml round bottom flask was filled with 290 ml DI water and 8.86 g styrene and heated to 70 °C in an oil bath and allowed to thermally equilibrate for 30 min. Next, 0.204 g potassium persulfate (Sigma-Aldrich) was added to catalyze the styrene polymerization reaction. The head space was purged with nitrogen and flowed at 1 ml s−1 for the duration of the experiment. The two-phase system was stirred for 8.5 h with a magnetic stir bar, resulting in a final milky white suspension. To obtain the polystyrene powder, ∼5 ml of the suspension was placed in a glass container and was dried in the air until all water was evaporated. Then the polystyrene powder was collected.
Electrode preparation and characterization
Sintered LCO pellet preparation
Sintered LCO electrodes were used as cathodes in this study. To prepare the sintered LCO pellet, the LCO active material powder was first mixed with 1 wt.% polyvinyl butyral (Pfaltz & Bauer) solution dissolved in ethanol (Acros). 1 g LCO powder was blended with 2 ml polymer binder solution with a mortar and pestle by hand to mix the materials. The mixture was collected after all the solvent was evaporated in air. Then, 0.2 g of the powder was loaded into a 13 mm diameter Carver pellet die and pressed with 12,000 lbf for 2 min in a Carver hydraulic press. Next, the pellets were heated in a Carbolite CWF 1300 box furnace in an air atmosphere with a ramping rate of 1 °C min−1 from 25 °C to 600 °C and the pellets were cooled to 25 °C at 1 °C min−1 after holding at 600 °C for 1 h.
Ice-templated LTO pellet preparation
Ice-templated LTO materials were fabricated from aqueous suspensions containing 30% by volume LTO particles. To prepare an aqueous suspension, as received LTO powder was mixed with deionized (DI) water and yttria stabilized zirconia (ZrO2) spheres (5 mm diameter, Inframat Advanced Materials LLC) in a Nalgene bottle, with ceramic powder to milling media mass ratio of 1:4. Then, cetyl trimethyl ammonium bromide (CTAB) cationic dispersant, at a concentration of with 0.02 g cm−3 of distilled water, was added to the aqueous LTO suspension. The addition of CTAB caused slight foaming in the suspension. To avoid foaming, an antifoaming agent Surfynol 104PG50 (0.003 g g−1 of LTO powder) was added to LTO suspension. Then, the LTO suspension was milled for 24 h at 30 RPM. Next, a binder solution was prepared by dissolving poly(2-ethyl-2-oxazoline) in distilled water, and the binder solution was added to the LTO suspension such that the binder amount was 4% of the LTO powder mass. LTO suspension was further ball milled for another hour at 10 RPM to ensure proper mixing of binder solution and LTO suspension and then the ZrO2 spheres were separated from suspension.
In this work a custom-made ice-templating device was employed to fabricate LTO electrodes with aligned pores, 33 and the resulting LTO pellets were referred to as LTOICE in the following discussion. This setup contains an assembly of a PTFE tube (mold) placed on a thin copper plate (referred to here as "cold-finger"), which is filled with an aqueous ceramic suspension. Next, to freeze the suspension under the influence of unidirectional temperature gradient, the mold assembly containing ceramic suspension is inserted inside a liquid nitrogen Dewar, where the cold-finger is placed above the liquid nitrogen. The distance between cold-finger and liquid N2 determines the unidirectional temperature gradient, and hence the growth velocity of the freezing front. In this work, a 1 mm gap between the cold-finger and liquid nitrogen was used to achieve a relatively high freezing front velocity (FFV) of about 28 μm s−1. As the temperature of the cold-finger reaches below 0 °C, ice crystals nucleate at the bottom of the suspension in contact with the cold-finger and grow upward under the influence of the applied thermal gradient.
Unidirectionally solidified samples were freeze dried in a freeze-dryer (2.5 l, Labconco, Kansas City, MI) for 96 h at a pressure of 0.014 mbar and temperature of −50 °C. Freeze dried LTO pellets were sintered using a tube furnace (NBD, T-1700–60IT). Samples were first heated to 450 °C at a rate of 5 °C min−1 and held for 4 h for binder burnout. Next, samples were heated to 950 °C at a rate of 2 °C min−1 and sintered for 2 h. Finally, samples were cooled down to room temperature using a cooling rate of 5 °C min−1. Dimensions of sintered LTO samples were approximately 13 mm in diameter and 10 mm in height. From each sintered LTO sample, a LTOICE electrode disk of 1 mm thickness was extracted from a 2 mm height above the bottom of the sample.
Microstructure of LTOICE materials was characterized using a desktop scanning electron microscope (SEM, Phenom Pure), and SEM images were obtained from cross-sectional planes perpendicular to the growth direction of ice crystals. Microstructure of the sintered materials were also characterized using X-ray computed tomography (XCT). A sintered LTO sample was first infiltrated with epoxy to achieve better contrast during XCT imaging. Next from the infiltrated sample, a small specimen of dimensions 1.5 mm × 1.5 mm × 3 mm was extracted and used for XCT. The extracted specimen was scanned using a 3D X-ray microscope (XRM, Zeiss Xradia 510 Versa available at Analytical Instrumentation Facility, North Carolina State University, Raleigh, NC) with 110 kV X-ray source, 90 μA target current, and 15 s exposure time. The obtained 983 X-ray 2D radiographs were used to reconstruct a 3D image using XMR Reconstructor software with image resolution of 1008 × 976 pixels with a pixel size of 0.8 μm. The obtained reconstructed data sets were imported to Dragonfly 2020.1 (Object Research Systems, Montreal) for 3D volume rendering.
Porosity-controlled LTO pellet preparation
The porosity-controlled LTO electrodes were prepared using a similar method for sintered LCO electrodes. The sintered LCO electrodes have a porosity of 36%, and if processed identical to the LCO an LTO sintered electrode generally has a porosity of 40%. The LTOICE electrodes, however, had a porosity of 57%. Porosity was determined by determining the volume of a processed electrode using dimensions measured with a digital micrometer and combining with the weight to determine the pellet density, where porosity accounted for the difference between the electrode density and the true density of the active material. Active material densities can be found in the Supporting Information, Table SI and for LTO were also provided on the specification sheet from the supplier. To have a more direct comparison of the impact of the pore alignment on the electrochemical and ion transport properties of the sintered electrodes, it was desired to fabricate hydraulically pressed electrodes with random pore microstructure which had geometric porosity that matched the LTOICE electrodes. To increase the porosity of the hydraulically pressed LTO electrodes, sacrificial spherical particles were added to the LTO powder before the hydraulic pressing step with the goal of providing added porosity to the electrode after their subsequent removal. To achieve this higher porosity, first, the LTO powder was mixed with polystyrene powder in a mortar and pestle with a mass ratio of 5:1 for LTO:polystyrene. Then, the powder mixture was blended with 1 wt.% polyvinyl butyral solution. 2 ml solution was used for 1 g LTO powder in the mixture. After the solvent was evaporated, 0.24 g of the mixture powder was loaded in the 13 mm diameter pellet die and pressed with 12,000 lbf for 2 min. The polystyrene was removed via decomposition at a lower temperature condition by firing the LTO/polystyrene pellets in a Lindberg/Blue M tube furnace from room temperature to 400 °C at a ramp rate of 1 °C min−1 under N2 atmosphere. After holding at 400 °C for 1 h, the furnace was cooled to room temperature at a rate of 1 °C min−1. This thermal treatment decomposed the polystyrene particles leaving increased porosity in the volume regions where the particles previously were. 34 No changes were observed in the LTO pellet diameter or thickness after the polystyrene removal step. Next, the pellets were transferred to a Carbolite CWF 1300 box furnace in air atmosphere and sintered at 600 °C for 1 h with both the heating and cooling rate of 1 °C min−1. The resulting LTO pellets with the increased porosity due to the sacrificial polystyrene particles are referred to as LTOPOR, and their final porosity was 57%. The surface morphology of the LTOPOR pellets was imaged using a SEM (FEI Quanta 650). The extra heat treatment at 600 °C in air was expected to oxidize and remove any residual polystyrene on the LTO surfaces in the pellet. 35 The LTO pellet after processing appeared white, suggesting there were no carbon deposits. The pellet was also weighed, and the mass was consistent with the initial amount of LTO in the sample suggesting the polymer materials were no longer present.
Thermogravimetric analysis
Thermogravimetric analysis (TGA, TA Instruments Q50) was conducted using pieces of both LTOICE and LTOPOR electrodes, and the results can be found in Supporting Information, Fig. S1 (available online at stacks.iop.org/JES/168/060550/mmedia). Both pellets showed very small weight loss (∼0.2 wt.%) at 200 C ∼ 300 °C and no further weight out to at least 800 ºC. These results were consistent with the lack of a carbon coating or deposits on the electrodes being retained after processing. The TGA was conducted by heating to 100 °C and holding at 100 °C for 1 h to remove any adsorbed water. Then, the temperature was increased to 1000 °C at a rate of at 10 °C min−1. TGA samples were each ∼35 mg, and the sample atmosphere was air.
X-Ray diffraction
The X-ray diffraction (XRD, Empyrean) patterns were collected for the as-received LTO powder, the LTO powder after firing at 950 °C for 1 h, and for both LTOPOR and LTOICE pellets. The patterns can be found in Supporting Information, Fig. S2. The XRD patterns were all consistent with spinel phase LTO, with no impurity peaks observed.
Electrode surface area
N2 adsorption-desorption experiments were used to measure the surface area for both LTOICE and LTOPOR pellets. The experiments were carried out with a NOVA 2200e analyzer. Both sample pellets were degassed for 90 min at 150 °C before adsorption-desorption and multipoint Brunauer-Emmett-Teller (BET) method was used to calculate the surface area. The LTOPOR materials had a BET surface area of 5.4 m2 g−1, which for the approximate 340 nm length scale of the primary particles suggests there was not much porosity beyond the surfaces of the particles themselves. The BET surface area of the LTOICE was measured to be <1 m2 g−1, however, the total adsorbed volume was below the threshold that is recommended for the instrument and thus the value was not reliable (it is noted that even the LTOPOR sample was right at the lower limit), and the total amount of ice templated samples available to dedicate for BET analysis was limited.
Electrode electronic conductivity
Direct current conductivity was used to measure the electronic conductivity of LTOICE and LTOPOR electrodes using stainless steel current collectors. The values were measured to be 0.9 × 10⁻⁹ s cm−1 and 1.0 × 10⁻⁹ s cm−1, respectively, for the as prepared electrodes. These values are within the range of previous reports for pristine LTO electronic conductivity. 15
Electrochemical cell fabrication
CR2032 coin cells were used for electrochemical evaluation of full cells containing sintered LTO anodes paired with sintered LCO cathodes. To fabricate the cell, the LCO pellets were pasted onto the bottom plate and LTO pellets (either an LTOICE or LTOPOR pellet) were pasted on a stainless steel spacer used in the cell. The paste for attaching the sintered electrode to the metal bottom plate/spacer was composed of 1:1 weight ratio Super P carbon black (Alfa Aesar) to polyvinylidene difluoride (PVDF, Alfa Aesar) binder dissolved in N-methyl pyrrolidone (NMP, Sigma-Aldrich). After the pellets were dried in air at 80 °C for 12 h, they were transferred into an Ar atmosphere glove box with both O2 and H2O content <1 ppm. Then, LTO and LCO electrodes were assembled into a coin cell with two layers of Celgard 2325 polymer separator (25 μm thick for each layer) between the anode and cathode. In a coin cell, 16 total drops of electrolyte (1.2 M LiPF6 in 3:7 ethylene carbonate:ethyl methyl carbonate, BASF) were added. Other parts of the CR2032 coin cell used in this study include a stainless steel wave spring, a stainless steel top cap, and a polypropylene or PTFE gasket (where PTFE was used only for cells assembled for neutron imaging experiments). 28
The rate capability of LTO/LCO sintered electrode coin cells was determined by galvanostatically cycling at different C rates using a MACCOR battery cycler. For the neutron imaging experiment, the cell was cycled using a Bio-Logic SP-50 potentiostat. The C rate was based on an assumed capacity of 150 mAh g−1 for LCO mass in the coin cell, where 1C was assumed to correspond to 150 mA g−1 LCO. The voltage range used for all LTO/LCO cells was 1.0 V to 2.7 V (cell voltage, relative to LTO anode).
Model analysis
An electrochemical numerical model developed by Newman et al. 36–38 was used to calculate the discharge voltage profiles. In addition, the simulation provides outputs of the Li+ concentration in both the solid and electrolyte phases at different time points during discharge and as a function of the depth dimension within the cells for the region between the current collectors (e.g. for the depth region comprised of the anode, separator, and cathode). More details about the model can be found in previous publications, and a summary of the model equations can be found in the Supporting Information. 36–38 A specific recent addition to the model which was applied in this work as well was the incorporation of a matrix conductivity which was a function of the extent of lithiation of the active material at each depth within the cell, and also the gradient in Li+ resulting from the charging process was accounted for when determining the discharge profile. Details of the updated model used in this work can be found in a previous publication. 39
Neutron imaging
Neutron imaging was carried out at the thermal neutron imaging beamline at the National Institute for Standards and Technology (NIST) Center for Neutron Research. 40 Details of the neutron imaging experiment set up and data analysis can be found in Supporting Information (including Fig. S3) and previous publications. 17,28 The results of neutron imaging were a series of radiographs collected at different times in operando during the discharge process. The changes in neutron intensity at different depths within the cell extracted from the neutron radiographs were most sensitive to the changes in Li+ concentration at those locations. 17,28,39 Thus, changes in pixel intensity correlated with changes in Li+ concentration (mostly in the solid phase of the active material) at the different cell locations and were analyzed as a function of time during discharge. The neutron imaging provided information on the relative redistribution of Li+ in the electrodes during discharge as a function of time and cell depth.
Results and Discussion
Morphology characterization for LTOICE and LTOPOR pellets
Top view SEM images with different magnification of sintered ice templated LTOICE and porosity controlled LTOPOR pellets are displayed in Fig. 1. In the LTOICE pellet, lamellar pore morphology was developed and retained after sintering (Fig. 1a), consistent with previous results. 9 XCT results (Fig. S4) confirmed that LTOICE contained aligned pores which extended significant distances through the thickness (e.g., along the growth direction of ice crystals, which was also the direction of net ion flux when electrochemically cycled within coin cells) of the pellet. From the higher magnification SEM image (Fig. 1b), it was observed that the lamella wall region was composed of densely packed LTO particles with average wall thickness of ∼10 μm. For LTOPOR pellet, the surface was much flatter with small pores present (Fig. 1c). None of these pores in LTOPOR formed deep channels through the pellet as the bottom of these pores was often noticeable just below the surface. In Fig. 1d, at higher magnification, it can be seen that the surface of the LTOPOR pellet was composed of loosely packed LTO particles. Compared with the lamella wall region of LTOICE pellet, the density of the LTOPOR pellet appeared slightly lower. This may have been due to the lower sintering temperature used during fabrication for LTOPOR pellet (600 °C) compared to that for LTOICE pellet (950 °C). However, both LTO pellets had similar total geometric density, with combined pore/void volume of ∼57%. From the morphology characterization of sintered LTO pellets, it was confirmed that the ice-templating technique resulted in much larger and directionally oriented pores, which would be expected to result in lower tortuosity and thus improved ion transport in the direction of the freezing front propagation.
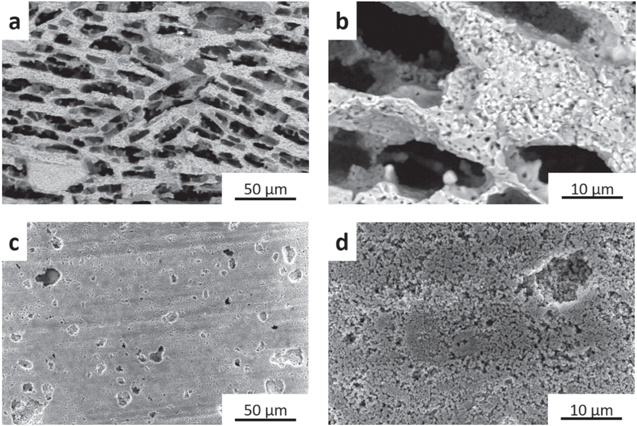
Figure 1. SEM images of the surfaces of (a), (b) LTOICE and (c), (d) LTOPOR pellets at low (a), (c) and high (b), (d) magnification.
Download figure:
Standard image High-resolution imageElectrochemical evaluation of LTOICE/LCO and LTOPOR/LCO cells
To study the electrochemical properties of sintered electrode full cells fabricated using LTO pellets with different pore microstructures, the LTOICE and LTOPOR pellets were paired with nominally identically sintered LCO pellets and were fabricated into LTO/LCO CR2032 coin cells. The discharge capacity for LTOICE/LCO and LTOPOR/LCO cells at different C rates is displayed in Fig. 2. The data points provided are the average discharge capacity per mass of LCO from rate capability tests of 3 nominally identical cells of each for both LTOICE/LCO and LTOPOR/LCO. In all cases the charge cycle was at a current of C/20, with C rate determined by the mass of LCO in the cell. Note that the range in LCO mass, and thus the range in currents and current densities during charge and discharge, varied by 0.002 g, which was ∼1% of the mean LCO mass for all cathode pellets used. The full rate capability test of representative LTOICE/LCO and LTOPOR/LCO cells can be found in Supporting Information, Fig. S5. As can be seen in Figs. 2 and S5, the discharge capacities for both cells were similar at relatively low rates (e.g., C/50 and C/20). At C/20, the discharge capacity of the LTOICE/LCO cells was (94.6 ± 3.4) mAh g−1 LCO and LTOPOR/LCO was (90.6 ± 8.1) mAh g−1 LCO (uncertainty is the standard deviation computed from several discharge capacities measured for 3 different cells). The higher capacity for the cell containing LTOICE may have resulted from higher charging capacity due to improved transport during that process, 39 however, the difference was still relatively small at the lowest rates. When the discharge rate was increased, LTOPOR/LCO cells lost more capacity compared with LTOICE/LCO cells, both on an absolute and percentage basis. At C/5 discharge rate, the LTOPOR/LCO cells only obtained (36.1 ± 10.9) mAh g−1 LCO, which was 39.8% of the discharge capacity at C/20. In contrast, LTOICE/LCO cells had (74.0 ± 3.4) mAh g−1 LCO capacity at C/5 discharge, which was 78.2% of the discharge capacity at C/20. In Fig. 2, the "C/20*" reflects the discharge capacity achieved in the cells at a C rate of C/20 after completion of the full rate capability cycling. The discharge capacity after the rate capability was completed was comparable to the capacity obtained at C/20 during the initial cycles. This outcome indicated the difference in capacity was due to rate capability limitations, and not due to capacity fade. It was concluded that LTOICE/LCO cells had improved rate capability relative to LTOPOR/LCO cells. The most substantial difference between the two cell types was the pore microstructure for the LTO pellets used. All LTOICE and LTOPOR had similar thickness and total porosity and used the same electrolyte and equivalent cathode material and processing. These results provided support to the conclusion that the introduction of the ice-templated pore microstructure for thick sintered electrodes improves active material utilization at high rates of charge and discharge. One explanation for this observation would be improved Li+ transport in the electrolyte phase through the porous microstructure of the LTOICE pellet facilitated by the directional porosity, although other effects in addition to alignment such as pore size, pore interconnectivity, and electrolyte accessibility could also improve the Li+ transport through the microstructure.
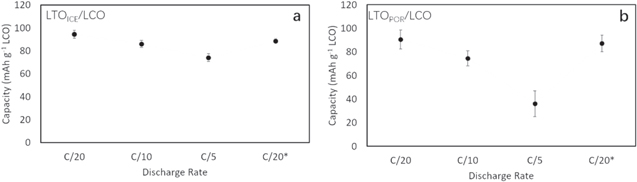
Figure 2. Discharge capacity of (a) LTOICE/LCO and (b) LTOPOR/LCO cells. All charge cycles were conducted at a rate of C/20, while discharge was at the rate indicated on the x-axis. The "C/20*" represents the C/20 discharge cycles conducted after conclusion of the rate capability test at increasing rates. Note that the average total capacity at C/20 for a) was 94.6 mAh and for b) was 90.6 mAh. The currents used were based on the mass of LCO in each cell used which was similar for all cases and on average was 1.4 mA (1.1 mA cm−2) at C/20, 2.8 mA (2.1 mA cm−2) at C/10, and 5.7 mA (4.3 mA cm−2) at C/5.
Download figure:
Standard image High-resolution imageNumerical calculations of discharge process for LTOICE/LCO and LTOPOR/LCO cells
Numerical calculations of the discharge process were applied to further understand the impact of material processing and pore microstructure on electrochemical properties and the Li+ distribution during discharge for the sintered electrode cells. Details of the model can be found in previous publications.
36–39
The discharge simulations included the voltage profile as a function of time during constant current discharge, and representative experimental discharge curves were selected for comparison from different discharge rates (C/20, C/10 and C/5). The experimental discharge profiles, including their previous C/20 charge profiles, for LTOICE/LCO and LTOPOR/LCO cells can be found in Supporting Information, Fig. S6. For the calculations, a subset of key parameters is listed in Table I, and a more detailed list of all parameters used in the calculations can be found in Supporting Information, Table SI. These parameters were either from experimental measurements, supplier/manufacturer data sheets, or published reports.
4,13,15,30,31,41–50
In the calculations, the Bruggeman exponent α was used to account for differences in electrode tortuosity and can be modified to incorporate pore alignment effects.
36,37
The relation between tortuosity τ and α are defined by the following equation: τ =  1−α
, where is the porosity of the electrode.
51
For perfectly aligned pores, the α value is 1.0 and for randomly packed spheres the α value is 1.5.
52
It is noted here that while alignment is one interpretation of changing tortuosity and α values, tortuosity is really an adjustment for the effective conductivity/diffusivity in the electrolyte through the microstructure. Thus, while one context discussed here is the pore alignment impact introduced from the ice templating, other effects such as pore interconnectivity and pore size can also be the phenomena that results in changes in tortuosity. Electrolyte accessibility might also contribute to tortuosity, although if there were inaccessible pores these would additionally result in a decreased porosity in the model—and inaccessible pores were not in the model because these values were not experimentally assessed. The output of the calculations included not only discharge profiles but also the concentration of Li+ in both liquid and solid phases as a function of time and electrode depth. Figures S7 and S8 in the Supporting Information show the comparison of the experimental and calculated discharge profile for LTOICE/LCO and LTOPOR/LCO cells, respectively, at C rates of C/20, C/10, and C/5. Overall, the calculated discharge profiles have a good fit to the experimental data at low rates of discharge. At increasing discharge rates, the initial polarization in the cell matched well between the calculations and experiments, however, the final discharge capacity was predicted to be higher in the calculations compared to the experimental outcomes. An exception was the C/5 discharge process for LTOPOR/LCO cell, in which case the calculated capacity was much higher than the experiment results. The detailed origins of the relatively large discrepancy for this particular case are still being investigated and will be discussed later in this manuscript.
1−α
, where is the porosity of the electrode.
51
For perfectly aligned pores, the α value is 1.0 and for randomly packed spheres the α value is 1.5.
52
It is noted here that while alignment is one interpretation of changing tortuosity and α values, tortuosity is really an adjustment for the effective conductivity/diffusivity in the electrolyte through the microstructure. Thus, while one context discussed here is the pore alignment impact introduced from the ice templating, other effects such as pore interconnectivity and pore size can also be the phenomena that results in changes in tortuosity. Electrolyte accessibility might also contribute to tortuosity, although if there were inaccessible pores these would additionally result in a decreased porosity in the model—and inaccessible pores were not in the model because these values were not experimentally assessed. The output of the calculations included not only discharge profiles but also the concentration of Li+ in both liquid and solid phases as a function of time and electrode depth. Figures S7 and S8 in the Supporting Information show the comparison of the experimental and calculated discharge profile for LTOICE/LCO and LTOPOR/LCO cells, respectively, at C rates of C/20, C/10, and C/5. Overall, the calculated discharge profiles have a good fit to the experimental data at low rates of discharge. At increasing discharge rates, the initial polarization in the cell matched well between the calculations and experiments, however, the final discharge capacity was predicted to be higher in the calculations compared to the experimental outcomes. An exception was the C/5 discharge process for LTOPOR/LCO cell, in which case the calculated capacity was much higher than the experiment results. The detailed origins of the relatively large discrepancy for this particular case are still being investigated and will be discussed later in this manuscript.
Table I. Parameters of cells used for calculation.
| Parameters | LTOICE/LCO | LTOPOR/LCO | Source |
|---|---|---|---|
| Thickness of negative electrode/LTO (m) | 9.10 × 10⁻⁴ | 8.95 × 10⁻⁴ | Measured |
| Thickness of positive electrode/LCO (m) | 4.57 × 10⁻⁴ | 4.64 × 10⁻⁴ | Measured |
| Volume fraction of electrolyte in negative electrode | 0.57 | 0.56 | Based on measured porosity. |
| Volume fraction of electrolyte in positive electrode | 0.36 | 0.36 | Based on measured porosity. |
| Bruggeman exponent α for cathode | 1.5 | 1.5 | Value for randomly packed spheres |
| Bruggeman exponent α for anode | 1.0 | 1.5 | Value for perfectly aligned pores (1.0) and randomly packed spheres (1.5) |
To provide insight into the impact of pore tortuosity during the discharge process, the net change in Li+ in the cell within the electrode and separator regions relative to the initiation of discharge was extracted from the discharge simulations. Figures 3 and 4 display the total change in Li+ concentration at different percentages of the discharge capacity delivered for LTOICE/LCO and LTOPOR/LCO cells at different discharge rates. Note that the Li+ concentration in Figs. 3 and 4 is the total concentration including both the solid and electrolyte phase weighted by their volume fractions, with the change in the solid phase generally providing the majority of the change in Li+. 17,28 In the profiles, the x-axis represents the depth across the electrode region, where 0 mm is the location of cathode (LCO) current collector and the maximum x-axis value corresponds to the location of anode (LTO) current collector. The location of separator is also noted in the figures. The concentration profiles have been normalized by subtracting the concentration profiles at the initiation of the discharge process in that cycle, and thus at 0% discharge capacity the profile is a horizontal line at a concentration change of zero. The detailed absolute concentration profiles in the electrolyte phase for each relevant condition in Figs. 3 and 4 can be found in Supporting Information Figs. S9 and S10 for LTOICE/LCO and LTOPOR/LCO cells, respectively. Relative concentration profiles in solid phase can be also be found in Supporting Information, Figs. S11 and S12 for LTOICE/LCO and LTOPOR/LCO cells, respectively.
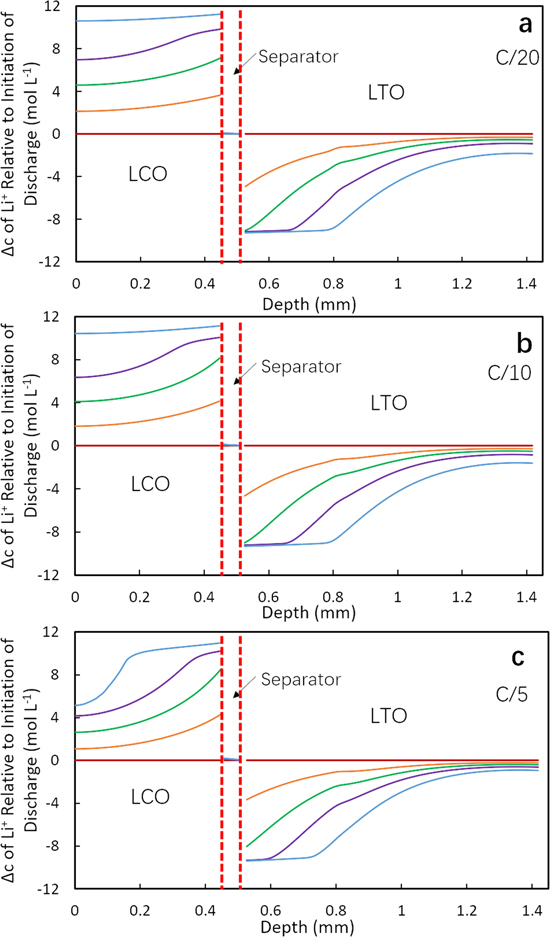
Figure 3. Calculated change in total Li+ concentration profiles for LTOICE/LCO cell at (a) C/20, (b) C/10 and (c) C/5 discharge process. The different curves correspond to the different extents of discharge capacity delivered, with the concentrations being shown for 0% (magenta), 25% (orange), 50% (green), 75% (purple), and 100% (blue).
Download figure:
Standard image High-resolution image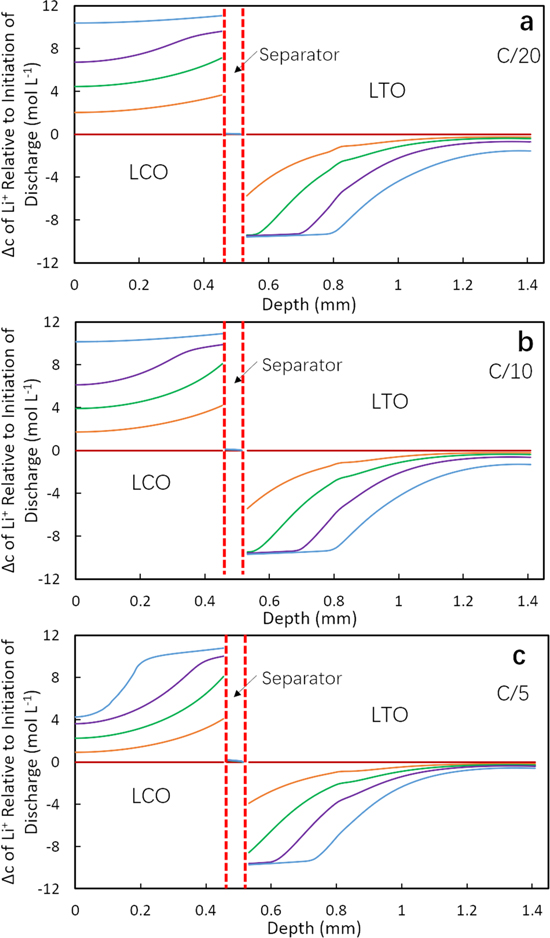
Figure 4. Calculated change in total Li+ concentration profiles for LTOPOR/LCO cell at (a) C/20, (b) C/10 and (c) C/5 discharge process. The different curves correspond to the different extents of discharge capacity delivered, with the concentrations being shown for 0% (magenta), 25% (orange), 50% (green), 75% (purple), and 100% (blue).
Download figure:
Standard image High-resolution imageIn reviewing the calculated profiles for change in Li+, a few outcomes are highlighted. First, at relatively low rates such as C/20 and C/10, for both LTOICE/LCO and LTOPOR/LCO cells, the Li+ concentration change in the LCO or cathode regions were similar, with a relatively uniform lithiation during discharge (Figs. 3a, 3b, 4a and 4b). A small gradient was noted and more pronounced at certain extents of discharge (e.g., 50% and 75% delivered capacity). However, the profiles corresponding to the delithiation process in LTO or anode differed between the two LTO cell types. For LTOICE anode (Figs. 3a and 3b), the delithiation initially (e.g. at 25% delivered capacity) primarily occurred near the separator region, with a gradual decrease in the change in Li+ concentration towards the LTO current collector side. As the discharge continued for the LTOICE anode, the region closest to the separator reached its maximum delithiation by 50% discharge capacity, and a gradient in Li+ concentration propagated towards the current collector as the discharge capacity reached greater extents. The Li+ concentration in the region closest to the current collector slowly decreased as the discharge proceeded. For LTOPOR pellet (Figs. 4a and 4b), the delithiation also first occurred at the separator side, but unlike LTOICE/LCO cell, the delithiation front which propagated toward the current collector had a sharper concentration gradient (Figs. 4a and 4b). A direct comparison between the profiles shown in Figs. 3 and 4 that highlights the gradient change between these two cells can be found in Supporting Information Fig. S13. These observations were consistent with the higher tortuosity of the LTOPOR electrode resulting in greater transport restrictions for the Li+ though the electrolyte phase in the electrode microstructure. These observations for the LTOPOR electrode were consistent with previous reports using hydraulically pressed LTO sintered electrodes with more restricted transport of Li+ in liquid phase relative to having lower tortuosity. 17
At the higher discharge rate of C/5, the LCO pellets for both cells formed a gradient in Li+ concentration. The gradient formed during discharge and none of the LCO was fully lithiated at the end of discharge (Figs. 3c and 4c). This was because at the high discharge rate, the concentration gradient in electrolyte phase increased. At the end of discharge, the Li+ concentration in electrolyte phase was approximately 0 within regions corresponding to the first 0.1 mm from the current collector into the LCO electrode (Figs. S9c and S10c). At the end of discharge, the region with minimal lithiation in the LCO pellet for the LTOPOR/LCO cell was larger than the region for LTOICE/LCO cell. This was consistent with the observed higher discharge capacity for the LTOICE/LCO cell (Fig. 2). The lower discharge capacity for the cell with a LTOPOR anodes had a greater "trapped" region of inaccessible capacity/Li+ due to the more restricted mass transport resulting from the higher tortuosity in LTOPOR pellets. At C/5, the delithiation process in the LTO region for LTOICE/LCO cell was similar to the trends observed at lower discharge rates (Fig. 3), although less Li+ moved from LTO to LCO electrode and thus the delithiation gradient did not propagate as far towards the current collector and there was less total discharge capacity delivered relative to lower rates. For LTOPOR/LCO cell, the delithiation in LTOPOR pellet also showed a sharper gradient. However, the delithiation propagation was limited to closer to the separator region, and there was very little delithiation near the current collector relative to the lower discharge rates. Comparing the concentration profiles in cells with LTOICE and LTOPOR electrodes, the delithiation in LTOICE was more uniform with a less steep gradient than LTOPOR pellet at all discharge rates, which was consistent with reduced tortuosity in the sintered anode will facilitating the Li+ transport and resulting in higher discharge capacity, particularly at higher rates. The simulated increased discharge capacity at higher rates was consistent with the experimental observations of improved rate capability for cells with LTOICE electrodes relative to those with LTOPOR electrodes (Fig. 2).
As stated above, the calculated capacity matched well with the experimental capacity for LTOICE/LCO cell and for slow rates (C/20 and C/10) for LTOPOR/LCO cell. But for the highest rate (C/5), the calculated capacity for the LTOPOR/LCO cell was much higher than the experimental data. Some potential causes of this discrepancy are briefly discussed here. In our previous report, the sintered LTO and LCO pellet were directly pressed and fired after being mixed with polyvinyl butyral binder. 17,28 In this work, in order to control the porosity of LTO pellet, sacrificial polystyrene particles were added. After firing, the voids/pores resulting from decomposed polystyrene may be different from those that result from the interstitial particle void regions. This nonuniform and multimodal porosity could result in increased tortuosity in LTOPOR pellets. 53,54 To confirm the potential effect of increased LTOPOR tortuosity relative to the assumed α = 1.5 Bruggeman exponent on LTOPOR/LCO electrochemical cell properties, calculations were conducted using higher Bruggeman α exponents for the anode with the intention to match the discharge capacity at C/5. The results are displayed in Fig. S14 and showed that when α was set to be 4.0, which was much higher than the value for randomly packed spheres (α = 1.5), the calculated capacity was close to the experimental capacity. However, the calculated discharge profile did not match the experimental profile as well, even at slow rates and at the first stages of delivered capacity. Concentration profiles were also calculated for α(LTOPOR) = 4.0 and can be found in Supporting Information Fig. S15. Compared to Fig. 4 where α(LTOPOR) = 1.5, the delithiation within LTOPOR pellet was more confined to the region near the separator and there was almost no delithiation of the LTO near the current collector, which was caused by higher transport resistance for the increased tortuosity.
While increased tortuosity for the multimodal pore size LTO electrode may account for some of the differences between the experimental and calculated polarization curves and profiles, other factors not accounted for in the simulations likely also contributed to the mismatch. For example, while multimodal pore size may have specifically had an impact on the LTOPOR electrode, LTOPOR and LTOICE had very different pore size distributions and connectivity, consistent with the reductions in BET surface area measured with LTOICE relative to LTOPOR. While the sacrificial polystyrene particles were used to match the overall geometric pellet density, matching the detailed pore size distribution and connectivity with and without alignment would be very challenging. Compensating for these other factors would provide further evidence of the impact of pore alignment on transport properties in the electrodes. It is noted that in some ways the electrochemical model accounts for these other factors by accounting for all net transport impacts through modifying effective diffusion/conductivity, however, the relative role of the pore size distribution, pore connectivity, and pore directionality individually were not separated. Also, electrolyte accessibility, which could impact both tortuosity and the total pore volume, was not experimentally assessed. Another possible factor for the deviation between calculation and experiment was the separator deformation due to internal pressure applied by the wave spring in the cell. When increasing the total electrode thickness within the coin cell, the pressure provided by the wave spring on the polymer separator will be higher and the impacts to ion transport resulting from compression of the separator may no longer be negligible. Separator deformation due to compressive loading can result in decreased thickness, lower porosity and higher tortuosity, and the latter two will contribute to increased ion transport restrictions. 55,56 Further research to quantify the pellet tortuosity and to study the behavior of compressed separator are beyond the topic of this work and will be directions for future work. Note that the separator compression is expected to be particularly complex to account for because the ice-templated electrodes are noticeably rougher than the porosity-controlled electrodes, and hydraulically pressed electrodes without porosity control are between these two, which would be expected to result in heterogeneous pinch points on the separator. Despite these limitations, both experiments and calculations supported that applying ice-templating techniques to process sintered electrodes improved the ion transport through the electrode microstructure which significantly improved the rate capability of electrochemical cells using these electrodes.
Neutron imaging radiographs before and after discharge at different rates for LTOICE2/LCO cell
To provide further comparison between the simulations of sintered electrode cell discharge behavior and experimental cells, neutron imaging was applied to provide experimental support to changes in Li+ concentration as a function of cell depth in operando during discharge. Neutron imaging is a non-destructive technique which passes a low energy neutron beam through a sample and then detects the relative transmitted intensity with a scintillation detector. As 6Li is a highly attenuating isotope for neutrons, neutron imaging is an ideal technique to track changes in the concentration of Li+ during charge/discharge processes in Li-ion cells. 29,57 Details about the set up and data analysis of the neutron imaging experiments in this work can be found in Supporting Information and previous publications. 17,28 As the LTO electrode used for neutron imaging experiment was slightly different in thickness from the representative cell discussed in previous sessions (Table SI), it was denoted as LTOICE2/LCO cell (LTOICE thickness: 0.91 mm vs LTOICE2 thickness: 0.86 mm). Before delivery to NIST, the cell was cycled 8 times to ensure it was functioning properly and then was charged at C/20 to a cell voltage of 2.7 V. At the beginning of the neutron imaging test, the cell was charged again at C/20 to compensate for any capacity lost due to self-discharge between the end of the charge cycle and initiating the neutron experiment (total time that elapsed between the final charge and setting up at NIST was ∼24 h). Then, following this C/20 charge, the cell was discharged at C/10, charged again at C/20 and then discharged at C/5. Unfortunately, a cell containing an LTOPOR anode did not have suitable imaging quality for analysis, however, we have previously reported neutron imaging for sintered LTO/LCO cells where the LTO did not have aligned pores. 17,28
Figure 5a displays the two experimental discharge profiles collected in operando during the neutron imaging experiment. The capacities obtained for C/10 and C/5 discharge were 90.5 mAh g−1 LCO and 79.0 mAh g−1 LCO, respectively, which was consistent with the rate capability achieved with equivalently processed cells described earlier (Fig. 2a). Four points at the start and the end of each discharge process are noted in Fig. 5a. The neutron images of these points are displayed in Fig. 5b. The images were normalized by the ones taken before the short C/20 charge process after the cell was set up. Therefore, the change in the electrode region was highlighted. Since 6Li is a highly attenuating isotope and was expected to be moving during the discharge process, the change in transmission can be related to the change of Li concentration in the electrode. During discharge, the Li+ will move from LTO electrode to LCO electrode, which will result in a lower Li+ concentration in LTO electrode than the initial state and vice versa for LCO electrode. Lower Li+ concentration relative to the initial state will increase the neutron transmission and was represented using red color in the color scale radiograph, while higher Li+ concentration will decrease the neutron transmission relative to the initial state and was represented by the blue color.
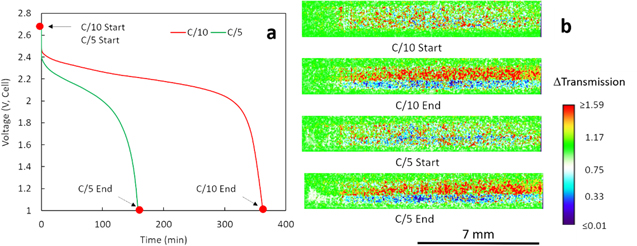
Figure 5. (a) Discharge profiles at C/10 (red) and C/5 (green). (b) Neutron imaging radiographs corresponding to the points noted in (a). A color scale was used to show the relative change in neutron transmission (ΔT). The brightest red regions have ΔT ≥ 1.59 and deepest blue regions have ΔT ≤ 0.01 and do not reflect the absolute maximum or minimum ΔT values.
Download figure:
Standard image High-resolution imageAt the beginning of discharge, the changes in neutron transmission were relatively small (C/10 Start in Fig. 5b), although it is noted that these were changes relative to initially setting up the cell and the only net change in Li+ concentration would be from the 5.1 mAh g−1 LCO from the short charge cycle initiated to compensate for any cell self-discharge. After the C/10 discharge, it can be observed that the LTO region became red and LCO region became blue (C/10 End in Fig. 5b), indicating the movement of Li+ from LTO to LCO electrode. Then, after another C/20 charge, the Li+ moved back and the image of C/5 Start was very similar to C/10 Start. As the charge capacity of the second C/20 charge was 88.6 mAh g−1 LCO, almost the same as the previous C/10 discharge capacity (90.5 mAh g−1 LCO), it was assumed that the two discharge processes started at similar lithiation/delithiation conditions. Finally, after the C/5 discharge, the net redistribution of Li+ from the anode to the cathode was again observed. However, while comparing the image of C/5 End to the image of C/10 End, both the red region and the blue region were smaller, which was attributed to the reduction in discharge capacity obtained, i.e., less Li+ was transferred from anode to cathode.
Comparison of calculated and experimental results for LTOICE2/LCO cell
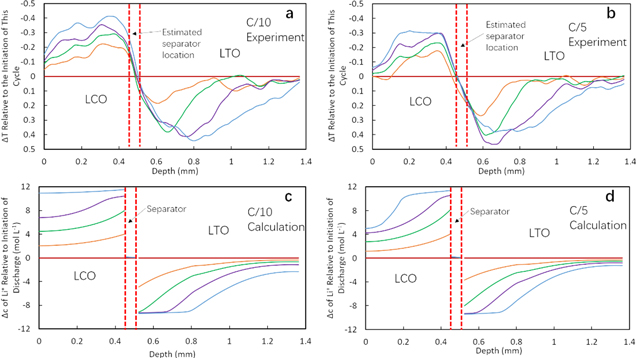
To study the Li+ transport process during discharge in greater detail, three additional extents of discharge (25%, 50%, and 75%) were included in analysis of the neutron imaging profiles. The relevant neutron imaging radiographs of the electrode regions in the cell can be found in Figs. S16 and S17 in Supporting Information for C/10 and C/5 discharge processes, respectively. For quantitative analysis, a 1000-pixel line scan was applied across the electrode region for all selected radiographs, and the average of these 1000 pixels was used to calculate the transmission or change in transmission at each depth location within the cell. To be consistent with the analysis done for calculated concentration profiles and highlight the change of transmission (ΔT) during discharging, all line scan profiles were normalized by the initial transmission profile of the cycle, which resulted in all 0% discharge capacity profiles becoming horizontal lines. Figures 6a and 6b display line scan profiles for the different extents of discharge. In the profiles, the y-axis was reversed for easier comparison to calculated profiles for the total change in Li+ because negative ΔT indicates higher Li+ concentration in LCO region and vice versa for LTO region.
Figure 6. Normalized transmission profiles for LTOICE2/LCO cell at discharge rates of (a) C/10 and (b) C/5, and comparative calculated profiles of the changes in relative Li+ concentration for LTOICE2/LCO cell at (c) C/10 and (d) C/5. The different curves correspond to the different extents of discharge capacity delivered, with the concentrations being shown for 0% (magenta), 25% (orange), 50% (green), 75% (purple), and 100% (blue).
Download figure:
Standard image High-resolution image
The discharge process of LTOICE2/LCO cell was calculated for comparison with experimental neutron imaging results. The parameters used for calculation and the comparison of discharge profiles can be found in Table SI and Fig. S18 in Supporting Information. The calculation results were very similar to the representative LTOICE/LCO cell discussed in previous sessions because the only difference between these two cells was a slight change in the LTO electrode thickness (Table SI). The calculated concentration profiles are displayed in Figs. 6c and 6d. Compared with the experimental transmission profiles, the calculated results show good agreement. In the LCO region, at both C/10 and C/5, the lithiation was relatively uniform with a gradient slowly formed during discharge. For both experimental and calculated results, the lithiation near the current collector of the LCO at C/5 did not reach completion, which was caused by the Li+ transport limitations at the increased rate. For the LTO region, results at both rates showed a consistent gradient forming during discharge which propagated towards the current collector. Therefore, the neutron imaging results confirmed that the calculation reflected the Li+ transport and redistribution processes occurring during discharge for the C rates investigated.
Conclusions
In this work, the electrochemical and transport properties of sintered electrodes were compared between ice-templated electrodes with aligned pore structures and hydraulically pressed electrodes which had random interconnected pores but had the geometric pellet density matched to the ice-templated electrodes using sacrificial additive particles. Electrochemical charge/discharge at increasing rates confirmed that coin cells containing electrodes processed using the ice-templating technique had significantly better retention of capacity at higher discharge rates. This outcome was explained in the context of the improved ion transport through the electrode microstructure due to reduced tortuosity, with one possibility being that the tortuosity reduction was the result of aligned pore microstructures. The impact of the improved ion transport was further supported by numerical simulations of the discharge process, which for many cases matched the experimental outcomes well. In addition, neutron imaging on a cell containing an ice-templated electrode provided evidence for the concentration profile associated with Li+ redistribution during discharge, which also was matched with Li+ concentration changes calculated from simulations. Overall, this study provides support for the significant improvements in mitigating ion transport limitations in thick electrodes that can be made by ice-templated microstructures.
Acknowledgments
This research was supported by the National Science Foundation, via grants CBET-1652488 and CMMI-1825216. NIST authors acknowledge supported from the U.S. Department of Commerce, the NIST Radiation Physics Division, the Director's office of NIST, and the NIST Center for Neutron Research, and thank Mr Eli Baltic for assistance with experimental setup. The authors thank Patrick McCormack for running the TGA measurements and Prof. Geoff Geise for use of their TGA instrument.
Footnotes
- a
Certain trade names and company products are mentioned in the text or identified in an illustration in order to adequately specify the experimental procedure and equipment used. In no case does such identification imply recommendation or endorsement by the National Institute of Standards and Technology, nor does it imply that the products are necessarily the best available for the purpose.