
Abstract
The ability to track electrode degradation, both spatially and temporally, is fundamental to understand performance loss during operation of lithium batteries. X-ray computed tomography can be used to follow structural and morphological changes in electrodes; however, the direct detection of electrochemical processes related to metallic lithium is difficult due to the low sensitivity to the element. In this work, 4-dimensional neutron computed tomography, which shows high contrast for lithium, is used to directly quantify the lithium diffusion process in spirally wound Li/SOCl2 primary cells. The neutron dataset enables the quantification of the lithium transport from the anode and the accumulation inside the SOCl2 cathode to be locally resolved. Complementarity between the collected neutron and X-ray computed tomographies is shown and by applying both methods in concert we have observed lithium diffusion blocking by the LiCl protection layer and identified all cell components which are difficult to distinguish using one of the methods alone.
Export citation and abstract BibTeX RIS

This is an open access article distributed under the terms of the Creative Commons Attribution 4.0 License (CC BY, http://creativecommons.org/licenses/by/4.0/), which permits unrestricted reuse of the work in any medium, provided the original work is properly cited.
Lithium batteries provide energy for a large number of applications and devices from medical implants, communicational devices, power backups up to power sources for hybrid- or electrical vehicles.1 The most widely deployed type of lithium battery is the Li-ion cell, known for their high nominal cell voltages of around 3.6 V in normal operation, a specific cathode capacity of up to more than 250 mAh g−1 and a large number of dis-/charge cycles (>1000).2 However, the highest cell capacities are reached by using pure Li-metal as an electrode material, where substantially elevated theoretical capacities of 3862 mAh g−1 are achievable.3 The requirements for lightweight and high-performance transportable power systems such as medical, military or space applications include a long shelf-life, miniaturisation and operation under extreme conditions, and have led to the development of a number of cell chemistries based on a lithium metal anode. The majority of these chemistries are primary cells developed between the 1950's and 1970's and include solid, liquid or gaseous cathodes such as sulphur dioxide (SO2),4,5 manganese dioxide (MnO2),6,7 iron disulphide (FeS2),8,9 iodine10 or thionyl chloride (SOCl2).11–14 Among these battery types. the Li/SOCl2 cells show several outstanding properties such as a high cell voltage (>3.6 V) in normal operation, a very low self-discharge, a high specific energy and energy density of about 590 Wh kg−1 and 1100 Wh L−1 at low-rate discharges15 and a wide temperature working range from <−20 °C up to 200 °C.16,17
While the Li/SOCl2 cell chemistry offers significant theoretical advantages, common issues have been shown to arise in practice during cell operation. In the initial phase of the discharge process a lithium chloride (LiCl) protection layer on the lithium surface, which is formed during cell storage,18 results in a voltage drop. The voltage subsequently recovers due to the mechanical disruption of the layer during dissolution of Li-ions from the anode.19 The reaction products generated during the reaction, initially LiCl and solid sulphur which forms at the end of the discharge, are insoluble in the liquid cathode and precipitate within the electrode limiting the cells capacity.20 Finally, at the end of the discharging process, the amount of SOCl2 in cells is not sufficient to dissolve all of the SO2 gas which forms during the reaction, resulting in a pressure build up which requires hermetic sealing of the cell to avoid a release of the toxic gas.21
Taking these issues into consideration when designing and optimising the cell geometry can go some way to improving cell performance and lifetime. To achieve this optimisation a number of diagnostic tools can be employed; among these, X-ray imaging has increasingly become a standard investigation tool for tracking structural and morphological changes of batteries during cell operation. X-rays interact with the electron cloud of an atom or crystal where the incident photons are absorbed or scattered by the electrons which results in the imaging contrast. X-ray studies have provided insight into the relationship between the observed performance and underlying microstructure,22–24 battery materials,25,26 cell architecture and safety.27,28 The high photon flux of state of the art synchrotron radiation sources enable imaging on a micro-second scale for 2-dimensional (2D)29,30 and a few seconds or less for 3D images.31,32 However, the low sensitivity of X-rays toward light elements such as lithium and hydrogen, found in the electrolyte, prevent the direct detection of Li diffusion in a battery using these methods.
In contrast to X-rays where the attenuation coefficient increases with the atomic number of the elements, neutrons interact with the nucleus of an atom and even exhibit different attenuation coefficients for isotopes of an element. The high sensitivity of neutrons for light elements allows the tracking of the electrochemistry such as the Li diffusion,33,34 electrolyte consumption or gas evolution35–37 in Li batteries. To date, 4-dimensional (4D), resolved in 3D spatially and 1D temporally, neutron studies have been largely infeasible due to the low neutron fluxes of available neutron sources and consequent long exposure times, which have typically required several hours per single computed tomography (CT) at the resolution of interest for battery applications.38,39 However, new optimised camera systems show the potential of rapid 4D neutron imaging as demonstrated by Tötzke et al.40 and Tudisco et al.41 The combination with newly developed high flux neutron imaging instruments such as the NeXT-Grenoble (Neutron and X-ray Tomograph in Grenoble)42 at the Institut Laue Langevin (ILL) have further pushed the potential for high speed 4D imaging43 and highly spatially resolved CTs42 providing an opportunity to examine dynamic processes as they occur in cells.
The combination of X-ray and neutron CT provides complementary imaging contrast, and facilitates the identification of mechanical degradation, tracking of the Li diffusion and the evaluation of the rate of electrolyte consumption as previously reported by the authors.44 Extending our previous study, here for the first time, operando neutron CT is utilised to study the electrochemical changes inside two spirally wound ER14505M Li/SOCl2 battery cells under two different discharge conditions. Additionally ex situ X-ray CT, before and after discharging, help to identify cell components and mechanisms of lithium diffusion, such as the blocking of reaction sites by solid LiCl, gas evolution or misaligned cell parts from the manufacturing process which are shown to affect the cell performance and the deliverable capacity. By providing an improved understanding of these mechanisms, it will be possible to design improved cell architectures, enabling Li/SOCl2 cells to operate at higher rates and over longer durations.
Experimental
In this work, two 2.0 Ah ER14505M Li/SOCl2 cells (EVE Energy, Shenzen, China) were examined at two galvanostatic discharge currents, 100 and 300 mA, while operandoneutron tomography was performed. The cells, which are designed for mid-rate discharge currents, were AA sized (51 × 14 mm) and featured a spirally wound internal architecture. The manufacturer's recommended maximum discharge rate for the cells was 400 mA, which, in combination with the high operating voltage of 3.6 V provided a comparatively high power output over extended durations. The wide operating window of the cells, ranging from −55 – +85 °C enables the use of these cells for applications in relatively extreme conditions.
A schematic drawing of a spirally wound Li/SOCl2 electrode system is shown in Fig. 1a. The electrodes and the separator membrane are arranged in a layered sequence corresponding to "...SOCl2∣separator∣Li∣separator∣Li/SOCl2∣separator∣Li..." in which the liquid SOCl2 electrode is constrained by a nickel current collector mesh which supports the overall electrode. The lithium metal anode can be seen to function as its own current collector, with both electrodes separated by a microporous polypropylene Li-ion permeable separator wetted with a SOCl2:LiAlCl4 electrolyte. During the storage of the battery, a two-layered protection film protects the lithium metal anode and the cell against self-discharging. The initial layer, spanning a few Angstroms, is composed of an insulating LiCl film with a subsequent microscale porous surface layer which develops during cell storage.18 During the discharging process, the Li-metal electrode (shown in grey in Fig. 1) is oxidised with the thionyl chloride cathode (green in Fig. 1) being reduced. Simultaneously, the protection layer on the anode surface is degraded and Li ions dissolve into the electrolyte (blue in Fig. 1), diffusing through the separator (yellow in figure) into the SOCl2 electrode where they react with the solid Li to form liquid LiCl, solid sulphur and SO2 gas.
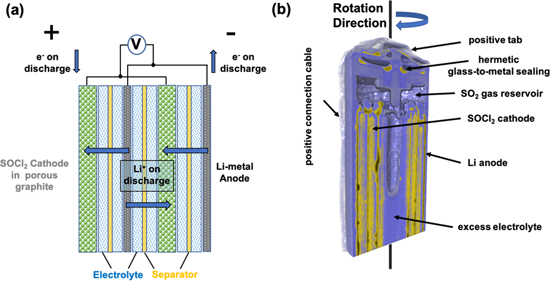
Figure 1. (a) Schematic illustration of the electrode separator assembly of a spirally wound lithium thionyl chloride cell showing the SOCl2 (green) positive electrode and the Li-metal (grey) negative electrode. The diffusion pathways through the separator (yellow) for Li-ions are shown in blue and (b) a 3D view of a neutron imaged EVE ER14250 battery cell with the main component parts highlighted.
Download figure:
Standard image High-resolution imageTime-resolved operando neutron tomography scans were performed on the NeXT-Grenoble neutron imaging instrument placed on the D50 beam guide at the high-flux research reactor at the ILL in Grenoble/France. The beamline has an outstanding high (polychromatic) neutron flux as the reactor is one of the world's most powerful continuous sources of neutrons. A cold source, consisting of liquid hydrogen at 25 K, optimises the neutron energy for imaging and enhances the neutron flux at a wavelength peaking around 2.7 Å. The NeXT-Grenoble (Neutron and X-ray Tomograph) instrument is designed for combined neutron and X-ray tomography with an X-ray imaging system installed perpendicular to the neutron beam on the beamline.
The high neutron flux provided by the NeXT instrument allows for 4D, time-resolved neutron tomography studies with a good true spatial resolution (<30 μm), as detailed below. To facilitate imaging, the cells were pressed into a neutron transparent cylindrical PTFE sample holder, which was mounted on an aluminium rod to enable the adjustment of the sample height. The rod was connected to a goniometer (model 409, Huber Diffraktionstechnik GmbH, Germany) located on the instrument table. An electrical slip ring (P4 + Compact Slip Ring, Moog, UK) was combined with the rotation stage, which allowed simultaneous rotation of the battery cell and electrical discharging. Two electrical wires from the fixed slip ring endings were connected to a Gamry 1000E potentiostat (Gamry Instruments, USA) with wires connected to the positive and negative tabs of the cell at the second rotating end. To prevent unwanted neutron scattering by the hydrogen containing plastic insulation of the connection wires, the insulation was removed and replaced by a thin neutron transparent PTFE band, which was wound around the cables. To provide the highest spatial resolution possible in both discharge experiments, the sample stage was moved as close as possible to the indirect neutron camera system. The camera box was equipped with a 10 μm thick GADOX (gadoliniumoxisulfite, Proxivision, Germany) scintillator, which converts neutrons to visible light with photons of an energy around 545 nm, in combination with a Nikon photo lens (Nikkor 50 mm, Nikon, Japan) with a focal length of 50 mm and a 16 MP CMOS ASI1600MM Pro cooled camera (ZWO, China). To ensure a highly collimated neutron beam, a 15 mm diameter circular pinhole was placed at the end of the curved neutron guide 10 m upstream from the sample. This provided an L/D of 667 and a maximal spatial resolution corresponding to 22 μm, given a sample/detector distance of 15 mm and an about 58 μm blurring for the here used flying scan strategy for projection recording. The resulting virtual pixel size after focusing the camera system was 8.9 μm with a field of view (FoV) of ca. 21 × 31 mm2. The cells were positioned in the front of the scintillator in such a way that the upper cell parts were visible in the FoV, enabling visualisation of approximately 55% of the cell and 50% of the active cell part.
The two cells were rotated at a rate of 2 rotations per hour with an exposure time per 2D projection of 2.2 s. The cell was continuously rotated during the whole discharge of the cell. Before the discharging process was started, the cell was scanned for 1800 s to obtain images of the initial, pristine, condition. Following this initial tomography, the first cell was discharged at a rate of 300 mA and the second at 100 mA. Figure 1b shows a reconstructed neutron image of a partially discharged ER14505M battery cell, as 3D rendered volume cut in the middle of the cell. Highly neutron attenuating battery elements and materials are shown in yellow such as the lithium, which flows from the lithium metal into the SOCl2 electrode, as well as the hermetic glass-to-metal boron containing seal which shields the environment from the toxic SO2, formed during the discharge process.
After complete discharge of a cell, it was scanned for another 1800 s to obtain a tomography of the fully discharged cell. All projections were noise filtered using a 1D orientated median filter, flat field and dark field corrected, and corrected for beam hardening effects. To reconstruct the tomographic data the SIRT iterative reconstruction code with 200 iterations from the ASTRA toolbox45,46 reconstruction library was used within the python programming language. All projections were binned by 3 × 3 pixels to minimise the reconstruction time and match the neutron resolution detailed above, which resulted in an effective pixel size of 26.8 μm. SIRT was used because of the expected lower levels of noise in the reconstructed 3D volumes in comparison to the commonly used FBP algorithm. Each tomogram was reconstructed from 813 projections. To improve the time resolution between the tomograms, consecutive tomograms were reconstructed after every 90° of sample rotation adopting the previous 270 ° rotation, resulting in a sampling frequency of about 7.5 min per tomography. As a result of this optimisation, a total of 40 tomograms were reconstructed for the cell discharged at 300 mA, and 121 tomograms reconstructed for the cell discharged at 100 mA.
X-ray tomography was performed on each of the discharged cells and a fresh ER14505M cell, using the X-ray imaging system installed on the beamline. The X-ray system consists of an L12161-07 X-ray source from Hamamatsu Photonics K.K. (Japan) and a flat panel PaxScan 2530HE X-ray imaging detector (Varex Imaging Corporation, USA). A Newport 350 mm motorized rotation stage (High-Speed DC Drive, Newport Corporation, USA) was used to rotate the sample. For the X-ray tomography scans, an energy of 140 kV and a current of 150 μA was used. To improve the image quality and reduce beam hardening, a 500 μm thick Sn filter was used. Images were collected at a rate of three radiographs per second, with five radiographs averaged for each of the 1600 projections obtained over a full 360° rotation. X-Act, the beamline software, was used alongside the FBP algorithm to reconstruct images with an effective pixel size of 19.8 μm.42
Results and Discussion
Figures 2a, 2c shows the discharge profiles for the ER14505M cells, discharged at 100 and 300 mA respectively, highlighting the typical flat discharge curve for the lithium metal/thionyl chloride battery chemistry. The curves show a similar discharge potential plateau at around 3.5 V; with the cell discharged at 300 mA plateauing approximately 30 mV lower due to an increased internal resistance of the battery cell caused by the increased discharge rate. The increase of the internal resistance can be traced back to diffusional limitations of the Li-ions by e.g. lithium diffusion blocking by remnants of the LiCl protection layer or gas evolution in the SOCl2 electrode. A voltage delay at the beginning of the discharge process is typical for this battery chemistry and can be observed in Figs. 2b, 2d. This delay is caused by the protective LiCl layer, which is formed on the lithium metal surface during storage and increases the internal cell resistance, reducing the initial cell potential. During the first phase of the discharging process, the protection layer starts to exfoliate from the anode surface, exposing fresh lithium, which then participates in the cell reaction and enables the recovery of the cell potential.19 The higher discharge current shown in Fig. 2c enables a quicker recovery of the cell potential due to a more powerful mechanical disruption of the protection layer during dissolution of Li-ions from the anode by the higher current.

Figure 2. Discharge profiles of the EVE ER14505M cells obtained at 100 mA (a), (b) and 300 mA (c), (d) highlighting the characteristic discharge shape (a), (c) and voltage recovery observed during initial operation (b), (d).
Download figure:
Standard image High-resolution imageX-rays, which are sensitive to the electron density of an element, are a standard imaging investigation tool for characterising the internal cell processes during the discharging process of batteries. Figure 3 shows orthogonal slices of three X-ray tomography reconstructions of the cells at different states of charge (SoC). Highly attenuating cell parts, shown in yellow, including the positive tab at the top of the cell and the cell casing. Owing to the low atomic number of Li, the anode appears as a weakly attenuating, white spiral. The SOCl2 cathode can be seen wound around the anode in a dark purple colour alongside the separator, which is difficult to distinguish due to a similar attenuation. Differentiation between the electrolyte and the cathode is also not possible as the cathode also acts as the electrolyte, enriched with LiAlCl4 lithium salt. The electrolyte is, however, visible above the electrodes, and in the centre of the cell. Along the outer Li-metal electrode, a highly attenuating nickel current collector mesh can be seen, ensuring the electrical connection to the negative cell can and the bottom terminal (not in the image). The mesh ensures an electrical connection when parts of the electrode are fully consumed and "Li islands" remain. A similar mesh is used in the cathode and increases the electrical conductivity of the SOCl2. The cathode current collector is visible in the centre of the cell and is connected to the positive cell terminal on the top of the battery cell. Due to unavoidable reconstruction artefacts caused by the high metal content, the top of the battery is blurred by star artefacts which partially hide the battery seal.

Figure 3. Horizontal and vertical X-ray tomography slices of an ER14505M battery cell in (a) pristine condition and discharged at rates of (b) 300 mA and (c) 100 mA.
Download figure:
Standard image High-resolution imageDuring the discharge of the cell the Li-metal is consumed and Li ions diffuse into the SOCl2 electrode where they react to form LiCl, S and SO2. In the process, excess electrolyte is consumed and SO2 gas formed, which fills the centre of the cell and the gas reservoir in the upper cell region. In both discharged cells the Li consumption can be seen indirect through the inhomogeneous shrinking of the transparent gap between the SOCl2 cathode windings. Here, the excess electrolyte is assumed to have been converted to a gas. Towards the top of the electrodes, the protruding separator membrane is visible. In the middle of the cell discharged at 300 mA [Figs. 3b, 3c], some material can be seen to remain after discharge. This material cannot be directly identified; however, it does have a similar attenuation as the electrolyte.
Figure 4 shows orthogonal slices from the cell imaged using neutrons during a 300 mA constant current discharge in pristine, 50% discharged and fully discharged condition. The extremely high contrast for Li can be noticed throughout the images, in sharp contrast to the X-ray orthoslices shown in Fig. 3. Again, the highly absorbing components, including the Li-metal anode and the glass-to-metal sealing in the cell header, are displayed as yellow. Weakly attenuating components such as the metallic cell casing and the positive terminal are shown in purple. The SOCl2 cathode and the SOCl2:LiAlCl4 electrolyte show a slightly higher attenuation and are displayed as dark purple. Due to a similar attenuation coefficient of the SOCl2, the current collector mesh inside the cathode is not visible. Further, the Ni, anode current collector mesh, on the outer Li-metal side cannot be distinguished from the electrolyte. The cathode current collector in the centre of the cell can be seen surrounded by the excess electrolyte in the pristine SoC. In the pristine cell the lithium metal anode shows a rough surface and an inhomogeneous lithium thickness.

Figure 4. Horizontal and vertical neutron tomography slices of an ER14505M battery discharged at 300 mA in the (a) pristine, (b) half discharge and (c) fully discharged state with key components labelled.
Download figure:
Standard image High-resolution imageThere are clear areas in Fig. 4a where the lithium anode protrudes by several microns. These rough surface areas and protrusions are not believed to be from the manufacturing process of the battery cell, more likely they can be attributed to the formation of an insulating LiCl-protection layer. This layer is not readily distinguishable from the Li-metal in the neutron images and has been reported to have a thickness of several micrometres. Further evidence for this is provided by the LiCl "bridge" observed in Figs. 4a–4c which connects two regions of anode. Were this bridge composed of Li the cell would likely have short-circuited. At a minimum the "bridge" region would have reacted with the SOCl2 reducing the open circuit potential, something which was not observed. During the discharge process, the Li-metal electrode thickness can be seen to reduce, with the excess electrolyte consumed. Lithium becomes more visible in the cathode region, with the attenuation of this area increasing at lower states of charge visible by the colour change from purple over black to yellow [Fig. 4c]. The Li removal from the anode is observed to occur in a heterogeneous fashion due to a higher mobility in the inner cell windings. The diffusion inside the SOCl2 cathode occurs in a similar fashion. A gradient from the outer cathode region is obvious which suggests that a blocking barrier prevents the Li diffusion between the Li-metal electrode and the inner cathode. The internal cathode winding and the external Li electrode winding can be seen to remain intact despite the full discharge of the cell. This may be caused by a misalignment of the electrodes during manufacture which inhibits the reaction. Alongside the relatively high current used in discharge, this misalignment may be the reason the cell discharge capacity obtained was limited to 1329.5 mAh rather than the 2000 mAh specified. In the cell centre, a highly attenuating "particle" connected to the cathode current collector (seen previously in Fig. 3) is visible. The complementarity of using both neutron and X-ray imaging techniques is highlighted here and suggests that the particle is composed of LiCl formed through a reaction with excess electrolyte. This hypothesis is based on the observation that the particle is highly attenuating for neutrons, therefore it most likely contains Li, but is also moderately attenuating in the X-ray imaging (Fig. 3) suggesting that the particle does not solely consist of Li. As such, a similar reaction to the formation of the LiCl-protection layer on the lithium metal anode surface seems to be the most likely explanation.
The orthogonal neutron imaging slices in Fig. 5 show the corresponding data for a cell discharged at a constant current of 100 mA. Once again, the lithium can be seen to be removed from the anode heterogeneously, with a higher extent of removal in the inner cell region. In contrast to the scan at higher current, shown in Fig. 4, the Li gradient inside the SOCl2 cathode in Fig. 5b seems to be flatter and the lithium is more homogeneously distributed over the cathode. However, regions with a lower reactivity are obvious. These regions can be caused by large areas of the LiCl-protection layer remaining on the anode surface, which affects the lithium diffusion from the anode. This can be noticed in the lower right side of the vertical slices in Figs. 5a–5c and causes the major inhomogeneity in the Li diffusion into the cathode. This cell also shows an unreacted outer winding of the Li electrode; however, the inner cathode winding can be seen to react due to a better initial alignment between the anode and cathode layers. In the fully discharged SoC the whole Li-metal anode of the inner two windings is seen to be consumed. The remaining gap, between the cathode windings, is filled with SO2 gas hindering the wetting of the electrodes with electrolyte. Likewise, unreacted electrolyte is observed in the neutron tomograms at the protruding upper separator winding where it is attached to the surface. This lower discharge current results a higher usable cell capacity of 1464 mAh; however this is still far below the rated usable cell capacity of 2000 mAh.

Figure 5. Horizontal and vertical neutron tomography slices of an ER14505M battery discharged at 100 mA in the (a) pristine, (b) half discharged and (c) fully discharged state with key components labelled.
Download figure:
Standard image High-resolution imageThe high sensitivity of neutrons towards Li enables a more detailed analysis of the Li-metal anode volume during the discharge of the cells with respect to X-rays. By obtaining a series of neutron tomographies the Li volume can be rendered for visualisation and quantified by calculating the volume fraction of the segmented anode at different SoC's. In total, seven and eight neutron tomographies were acquired from the 300 mA and 100 mA discharge rates respectively, with the volume of the Li calculated for each of the points. Figure 6 shows the lithium volume present in the pristine and fully discharged cells alongside a volume obtained at approximately 50% SoC.

Figure 6. Volume rendering of the lithium metal anode at three different SoCs (100%, ca. 50% and 0% SoC) for the two cells discharge at (a) 300 mA and (b) 100 mA showing the higher lithium consumption at the inner anode windings.
Download figure:
Standard image High-resolution imageIn the pristine cells the surface of the Li anodes can be seen to alternate between flat and rough sections. Here the flat surfaces are indicative of a thin LiCl protection layer with the rough surfaces being the result of a more significant LiCl growth. The extent of this LiCl growth is highlighted by measuring the anode thickness; at the flat surfaces the lithium metal anode is approximately 350 μm thick whereas in the rough regions the thickness extends to a maximum of 900 μm. In the pristine state in Fig. 6a, the cell discharged at 300 mA is characterised by large flat surface areas with one larger rough section clearly visible in the inner electrode winding. During the discharge process, the extent of lithium removal at the internal windings is seen to be more significant (as previously demonstrated in Figs. 4 and 5); however, while the Li-metal is removed relatively uniformly in the sections where the surface is flat, the large rough section in the cell centre remains, even following the full discharge of the cell. It is suggested that the formation of the LiCl-protection layer results in the consumption of portions of the lithium metal resulting in a reduced cell capacity. Additionally, the formation of this large LiCl layer intrudes on the lithium removal and diffusion processes from the anode reducing cell performance. The extent to which this mechanism will impact cell performance will depend on the storage time of the cell, as sustained storage will enable a more significant growth of the LiCl layer. It can also be seen that there is a significant quantity of Li remaining after the cell has been fully discharged. Several mechanisms can result in poor lithium reactivity including the disruption of diffusion by the LiCl layer or a poor electrical connection of the electrode section. Reduced Li ion conductivity is also likely in the outer electrode windings due to weaker electrode compression which promotes the discharge reaction towards the interior of the cell. Around the exterior of the Li electrode winding, small LiCl particles are observed which could be formed from lithium particles remaining from the manufacturing process or disconnected particles from the protection layer on the anode surface. Similar behaviour is observed for the cell shown in Fig. 6b which was discharged at 100 mA. In this instance however, the lithium removal is more uniformly distributed over the full electrode length due to the lower discharge current which facilitates a more homogeneous lithium diffusion. In the pristine state, a smaller number of rough areas are seen on the Li anode which suggests that initially the LiCl protection layer is smaller. As the cell is discharged, the lithium electrode maintains a relatively uniform shape, with Li being removed from all areas in contrast to the mechanism observed in Fig. 6a. When the cell is fully discharged more of the lithium from the inner cell windings can be seen to be removed as seen in the other cell. Here, the anode shows small volumes of remaining Li or LiCl in the centre which increase in size towards the outer electrode winding; these are however, substantially lower than those observed in the cell discharged at 300 mA. It can therefore be assumed that (as expected) the influence of the lithium diffusion is more pronounced at higher discharge currents with the extent of Li-ion diffusion blocking seemingly having a significant impact on the maximal usable cell capacity.
By examining the lithium metal volume at the different SoCs, it is possible to calculate the mass of lithium which is needed for the practical realisation of a given capacity. In this work, only ca. 50% of the total electrode assembly was scanned. Therefore the determined volumes must be adjusted to approximate the true lithium metal volume. In doing these the total lithium volumes for the ER14505M cells were calculated to be 1,014 mm3 and 1,047 mm3 for the two cells, corresponding to a mass of approximately 5.5 g per cell. The relationship between the lithium volume change and the capacity increase or time dependency is shown in Fig. 7.
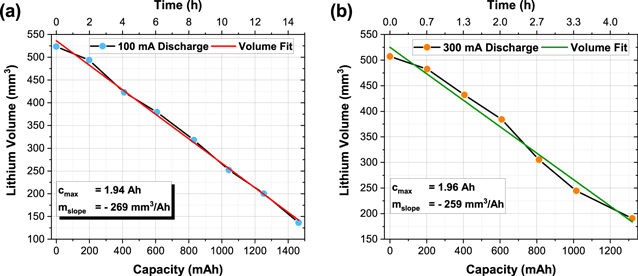
Figure 7. Lithium volume decrease of the two ER14505M cells during the (a) 300 mA and (b) 100 mA discharge as determined by a calculation of the volume fraction using the AVIZO visualisation software from operando neutron tomographies.
Download figure:
Standard image High-resolution imageThe correlation between the change in capacity to the reduction in measured volume, both plots show a linear trend over the full cell discharge for both tests. Small variations can be explained by uncertainties in the measuring process, such as the threshold for the lithium segmentation and the homogeneity of the discharge process in the measured half-cell parts. Both graphs show a similar slope with −269 mm3 Ah−1 and −259 mm3 Ah−1, respectively. Correcting this for the assumption that only half of the electrode assembly were scanned during the experiment the true lithium volume removal rates were calculated as −538 mm3 Ah−1 and −518 mm3 Ah−1. These measured rates are larger than the theoretical relationship between the lithium volume and the resulting capacity which can be calculated using Eq. 1; where MLi is the molar mass of lithium, C the electric charge, NA the Avogadro constant and ρLi the density of Li, and results in a theoretical removal rate of 485 mm3 Ah−1.
The theoretical minimum lithium volume which is needed to generate the rated 2.0 Ah cell capacity is 970 mm3, it can however, be assumed that the actual volume of Li in each cell is in excess. As such, the calculated lithium volumes in the pristine state between 1035–1075 mm3 are representing realistic volumes for the given capacity. Using the plots shown in Fig. 7, it is possible to determine the actual cell capacity from the determined Li volumes by calculating the intersection point with the abscissa. The cell discharged at 300 mA had a maximum cell capacity of 1944 mAh, compared with that discharged at 100 mA having a capacity of 1962 mAh. Both values are close to the maximum cell capacity of 2.0 Ah specified by the manufacturer. Differences between the theoretical and measured lithium consumption can be explained by uncertainties in the segmentation process, where, for example, the differentiation between lithium metal and LiCl is difficult and a small variation of the lithium threshold can change the volume by a few cubic millimetres, and that only about the half of the cell is measured which can vary by a few percent.
A direct quantification of the Li diffusion inside the SOCl2 cathode is extremely complex and requires a direct link between the intensity change and the amount of deposited Li. The need to use a beam hardening correction and the challenges associated with isolating the whole cathode region from the surrounding anode-electrolyte-separator assembly renders this analysis impractical using the methods described here. However, qualitative analysis of the time dependent Li diffusion can be achieved for various regions of the electrode assembly as seen in Fig. 8.

Figure 8. Qualitative evaluation of the lithium movement inside two ER14505M Li/SOCl2 cells discharged at 300 mA (a), (c) and 100 mA (b), (d) by examining time dependent line plots during a constant current discharge.
Download figure:
Standard image High-resolution imageTime dependent line plots obtained through the horizontal slices [shown in Figs. 8a, 8b] of the cells discharged at 300 and 100 mA can be seen in Figs. 8c, 8d. The slice was chosen from the middle height of the scanned portion of the cell and, as such, can be considered representative for the whole cell. The red line shown in Figs. 8a, 8b marks the position of the line profile plots shown in Figs. 8c, 8d which detail normalised intensity changes at various states of charge from pristine to fully discharged. The specific region was chosen to exclude large inactive parts of the LiCl protection layers which would obscure the underlying diffusion processes throughout discharge. The line plots show the intensity change during the discharging process inside the electrodes due to the movement of Li ions from the anode (marked by a blue line) to the cathode (red line) from the pristine to the discharged cell state.
In pristine condition (corresponding to 0 mA discharge), the cell discharged at 300 mA displays the highest intensity in the region of the Li-metal of the anode as seen in Fig. 8c. The 1.0 mm thick SOCl2 electrode and the electrolyte show a consistent normalised intensity around 0.3 throughout the entire discharge due to a constant Li volume. During the discharge, Li-ions are removed from the Li-metal electrode and diffuse into the cathode, seen by an intensity decrease at the anode and corresponding increase of the normalised intensity at the cathode. The lithium diffusion into the cathode occurs from the outer and inner surfaces, with a higher amount of Li identified on the external side. This behaviour may be caused by the higher availability of Li in this region owing to the larger anode radius. At the middle of the cathode, the lithium diffusion appears irregular but from both electrode sides. In the discharged state in the inner cell windings, the lithium metal is seen to be completely removed, with SO2 gas evolved and occupying the free space visible by the significant reduction in intensity. Simultaneously, the excess electrolyte in the centre of the cell is consumed, and the region is occupied by SO2 gas detectable by a large drop in normalised intensity in the centre of the cell during discharge. The peak in the line profile plots for the cell centre show the position of the cathode current collector.
An equivalent analysis was performed also for the cell discharged at 100 mA as shown in Fig. 8d. This cell shows a stronger lithium removal from the anode indicated by a larger reduction in normalised intensity due to the occupation of evolved SO2 gas in that region; this is consistent with higher mass utilisation at lower discharge currents. Further, a higher amount of deposited Li in the cathode is visible by the higher normalised intensity, and smaller intensity gap, in the middle of the cathode volume. The low discharge current facilitates a more homogeneous diffusion over the cell and a higher usable capacity resulting in a larger Li content in the SOCl2 electrode.
A semi-quantitative assessment of the lithium diffusion into the cathode can be made by defining a rectangular region of interest in a vertical slice of the measured cell. Here, the Li and SOCl2 electrodes can easily be spatially separated by rectangular boxes and the intensity change graphically displayed over the discharge process. However, this can only be performed for a selected slice and region. In Fig. 9a such an analysis is reported for a selected region [shown in Fig. 9b] which captures the dynamics observed throughout the whole cell discharged at 300 mA. The intensity changes as a function of capacity are graphically displayed in Fig. 9a for the lithium electrode regions and in Fig. 9c for the cathode regions. The line plots indicate the activity of the Li ion movement away from the lithium metal electrode, evident through the decreasing normalised intensity, and into the SOCl2 electrode, as indicated by the increasing intensity. The slopes of the graphs represent a measure of the activity of the electrode sections and show a large difference in the lithium removal from the three anode sections. The inner anode section exhibits the highest activity, whereas the outer section shows no reduction in intensity throughout the entire discharge. For the outer and middle cathode sections, the lithium accumulation follows a similar slope while the inner section shows a smaller lithium increase. This lower intensity increase of the inner cathode section can be explained by the lithiation occurring only from the external electrode side due to the geometry of the cell which left the internal surface free. A similar analysis is highlighted for the cell discharged at 100 mA in Figs. 9d–9f. Once again, the lithium removal from the anode is strongest for the inner section with the middle section showing a deviation from the observed linear behaviour towards the end of the discharge where an increased rate of lithium removal is observed. The profiles associated with the cathode remaining are comparable to the behaviour observed for the cell discharged at 300 mA with outer cathode sections showing a similar slope. Again, the inner section displays approximately half of the intensity increase due to lithiation from one electrode side only. The variation of cell activity, with a higher lithium movement in the cell centre, can be explained by the higher compression of the electrode assembely in the inner cell sections due to the stronger winding of the electrodes which facilitates the ion conductivity.

Figure 9. Semi-quantitative analysis of the lithium removal and accumulation in an ER14505M Li/SOCl2 cell during two discharges at 300 mA (a)–(c) and 100 mA (d)–(f). The profiles show the removal of lithium from the anode (a), (d) and the accumulation of lithium in the cathode (c), (f) from regions highlighted in (b), (e).
Download figure:
Standard image High-resolution image
A quantification of the intensity changes was performed by determining the rate of change in intensity during discharge, plotted in Fig. 9, of the summed Li removal and accumulation from the anode to the cathode which provides information about the balance of the Li removal and the accumulation throughout the cell, with the results shown in Table I.
Table I. Quantification of the rate of intensity change as a result of lithium removal and accumulation in the electrodes of two ER14505M Li/SOCl2 cells during 300 mA and 100 mA constant current discharges.
| Electrode | Discharge Rate (mA) | Slope (Intensity Ah−1) |
|---|---|---|
| Anode | 300 | −0.26 |
| Cathode | 300 | 0.29 |
| Anode | 100 | −0.38 |
| Cathode | 100 | 0.32 |
It can be observed that the measured slopes are similar for both the removal and accumulation of Li in the cell discharged at 300 mA indicating a reasonable balance across the cell. However, a larger difference can be observed in the cell discharged at 100 mA indicating a slightly imbalanced cell in the region analysed. It should be noted that the measurements represent a small local area of the cells which are not representative for the whole cells. The local lithium removal and accumulation from the anode and cathode are affected by many different effects, such as diffusion blocking or gas evolution, which can result in disbalances between the opposite electrodes.
Conclusions
The optimisation of the electrochemical processes in commercial lithium battery cells offers the potential to reduce the amount of active material in cells, to reduce costs and to achieve improved cell performance and capacity. To study dynamic processes, X-ray CT has traditionally been used to track structural changes in the battery electrodes, taking advantage of the high contrast for metallic components. Here, operandoneutron CT was used to directly detect the electrolyte consumption and related SO2 gas evolution and quantify the lithium removal from the anode during discharging at two different currents. The experiments show an inhomogeneous lithium consumption, with more pronounced consumption occurring in the inner electrode windings. This indicates a stronger electrochemical reaction in the inner cell sections. Further, both cells reached less then three-quarter of the maximal theoretical cell capacity with the cell with the discharge at a lower current achieving ca. 7% improved capacity.
These results support the conclusion from Part One47 of our two part study, which suggests that the speed of the lithium diffusion inside the SOCl2 cathode and the blocking by precipitation of solid LiCl and sulphur has a major influence on the achievable cell capacity. Additionally, the diffusion blocking can be traced back to areas which remain from the initial LiCl protection layer, which forms during cell storage, on the lithium electrode surface. This layer was seen to vary locally in size and was seen to influence the amount of reacted lithium in the opposite cathode section. The complementarity of X-rays and neutrons has helped to identify dislocated elements in the battery which remained from the cell manufacturing process including LiCl, reacted lithium and the LiCl protection layer which are difficult to distinguish or specify using only one type of radiation.
Acknowledgments
This work was carried out with funding from the Faraday Institution (faraday.ac.uk; EP/S003053/1FIRG003, FIRG013, FIRG014). We would like to acknowledge the Royal Academy of Engineering (CiET1718/59) and the EPSRC (EP/ S003053/1; EP/M028100/1) for financial support.
Time-resolved operando neutron tomography scans were performed on the D50/NeXT-Grenoble neutron imaging beamline (DOI: 10.5291/ILL-DATA.UGA-63) at the high-flux research reactor located at the ILL in Grenoble/France. Located at a neutron guide, the D50 beamline at ILL has an outstanding high (polychromatic) neutron flux as the reactor is the world's most powerful continuous source of neutrons.