
Abstract
Economic operation of carbon dioxide (CO2) electrolyzers generating liquid products will likely require high reactant conversions and product concentrations, conditions anticipated to challenge existing gas diffusion electrodes (GDEs). Notably, electrode wettability will increase as lower surface tension products (e.g., formic acid, alcohols) are introduced into electrolyte streams, potentially leading to flooding. To understand the hydraulically stable operating envelopes in mixed aqueous-organic liquid domains, we connect intrinsic electrode wettability descriptors to operating parameters such as electrolyte flow rate and current. We first measure contact angles of water-organic product dilutions on polytetrafluoroethylene (PTFE) and graphite surfaces as planar analogues for GDE components. We then use material balances around the reactive gas-liquid-solid interface to calculate product mass fractions as functions of water sweep rate and current. Product composition maps visualize the extent to which changes in cell performance influence capillary pressure, a determinant of GDE saturation. Analyses suggest that formic acid mixtures pose little risk for GDE flooding across a wide range of conditions, but effluents containing <30% alcohol by mass may cause flooding. This study reveals opportunities to integrate microstructural features and oleophobic surface treatments into GDEs to repel aqueous-organic mixtures and expand the window of stable operating conditions.
Export citation and abstract BibTeX RIS
This was paper 1074 presented at the Atlanta, Georgia, Meeting of the Society, October 13–17, 2019.
List of Symbols
| Variable | Unit | Description | ||
| dfiber | m | fiber diameter | ||
| dmax | m | maximum pore diameter | ||
| dmin | m | minimum pore diameter | ||
| I | A | current | ||
 out out |
kg s‒1 | total mass flow rate exiting the reactor | ||
| P,in |
kg s‒1 | product feed rate | ||
| w,in |
kg s‒1 | water feed rate | ||
| P,rxn |
kg s‒1 | product generation rate | ||
| W,rxn |
kg s‒1 | water consumption rate | ||
| PC | bar | capillary pressure | ||
| PG | bar | gas phase pressure | ||
| PL | bar | liquid phase pressure | ||
| Q | mL min‒1 | volumetric flow rate of feed water | ||
| r | m | cylindrical pore radius | ||
| xP | — | mass fraction of product | ||
| xW | — | mass fraction of water | ||
| z | m | longitudinal cylindrical coordinate | ||
| Constant | Value | Unit | Description | |
| F | 96485 | C mol e‒1 | Faraday constant | |
| MP | FA | 0.04603 | kg mol‒1 | molar mass of a CO2R product |
| MeOH | 0.03204 | |||
| EtOH | 0.04607 | |||
| PrOH | 0.06009 | |||
| MW | 0.01802 | kg mol‒1 | molar mass of water | |
| nP | (Table I) | mol CO2 mol P‒1 | carbon ratio | |
| zP | mol e mol P‒1 | electron-product ratio | ||
| zW | mol e mol W‒1 | electron-water ratio | ||
| ρW | 998.2071 | kg m‒3 | density of water at STP | |
| Greek letter | Unit | Description | ||
| α | ° | filling angle | ||
| γ | mN m‒1 | liquid-gas surface tension | ||
| γC0 | mN m‒1 | critical surface tension for complete wetting (θ = 0°) | ||
| γC90 | mN m‒1 | cylindrical capillary transition surface tension (θ = 90°) | ||
| θ | ° | intrinsic solid-liquid-gas contact angle | ||
Electrochemical carbon dioxide reduction (CO2R) is increasingly recognized as a viable technology for flexible generation of chemicals using carbon dioxide (CO2) recovered from industrial exhaust streams or directly captured from air.1,2 When coupled with affordable electricity generated from renewable sources, CO2R has the potential to displace petroleum-based chemicals production in a low-carbon economy.3 Given that the form factors of electrochemical technologies evolve as they transition from benchtop prototypes in the laboratory to engineered unit operations integrated into an industrial process, it is reasonable to anticipate commensurate shifts in the objectives and challenges for each scale. Historically, three-electrode analytical cells have been used to study catalyst activity, selectivity, and stability with a goal of incorporating proven materials into larger devices.4–6 However, it has been recognized that the limited CO2 flux through bulk volumes of liquid electrolyte suppresses the reaction rate of CO2 and inhibits the performance of otherwise promising catalytic systems.7–9 Gas-fed electrolyzers adapted from commercially successful water electrolyzer and fuel cell technologies have motivated CO2R researchers to explore various combinations of porous electrodes, catalyst layers, liquid electrolytes, and polymeric membranes to achieve higher areal productivity while maintaining steady fluxes of species between flow channels and active sites.10–14 For example, state-of-the-art devices achieve high current density (>200 mA cm−2) production of valuable intermediates, such as carbon monoxide (CO), at moderate cell voltages (ca. 3 V) and ambient conditions for relatively extensive durations (>100 h) using cell configurations similar to polymer electrolyte water electrolyzers.15
Such impressive prototype performance begs the question: Could operation of electrolyzers at high product generation rates result in reaction environments so extreme that they challenge the flooding thresholds of existing porous electrode materials sets? We posit that the conditions necessary for industrial CO2R may render GDEs composed of hydrophobic materials incompatible with lower-surface-tension mixed aqueous-organic phases generated at the reactive gas-liquid-solid interface. Note that flooding occurs across a range of gas-to-gas and gas-to-liquid electrolyzers for a variety of reasons (e.g., electrolyte carbonation and salt precipitation,16 electrowetting,17 and uneven GDE pressure distributions17). In this work, we consider the wettability of GDE components, evinced by sessile drop contact angles on planar analogues, in contact with aqueous-organic liquid mixtures representative of potential product stream compositions. Subsequently, we use a simple mass balance model paired with contact angle measurements to estimate electrolyzer operating limits, represented by the capillary pressure, beyond which product streams would be anticipated to spontaneously flood conventional GDEs without deploying additional pressure control strategies. By connecting readily obtainable measures of electrode-liquid affinity to cell operating conditions, we aim to develop insights into operating regimes for CO2 electrolyzers that generate liquid products and to address critical questions, such as: (i) What are threshold compositions for liquid product mixtures that may lead to spontaneous electrode flooding under pressure-balanced conditions? (ii) Do current state-of-the-art effluent compositions fall within a stable region for PTFE-containing GDEs? (iii) Can we design porous electrodes with flooding resilient structures and surface energies to withstand high product concentrations?
Industrial CO2 to Liquids Electrolyzers Will Move Beyond Differential Operation
At the bench-scale, where component validation and performance benchmarking are typically the desired outcomes, electrochemical cells with active areas of ca. 1–10 cm2 are often operated to generate dilute product streams that are conducive to quantitative analyses. Under differential conditions, in which species concentration gradients are assumed to be negligible,18 electrochemical kinetic parameters can be determined in the absence of mass transfer limitations that may obscure results at higher degrees of reactant depletion. When targeting gas-phase products, such as CO, differential conditions are generally achieved by feeding CO2 in stoichiometric excess to the cathode compartment to ensure low single-pass CO2 conversion (<20%) for a given total current (Fig. S1, Supplementary Information is available online at stacks.iop.org/JES/167/124521/mmedia). For cells with flowing electrolytes, water-miscible liquid products can be diluted either by increasing the total electrolyte volume for batch operation or increasing flow rate in single-pass operation. As an added benefit, generating dilute products can reduce the risk of creating dangerous concentrations and/or quantities of hazardous reaction products that are more appropriately handled in industrial settings where suitable hazard management protocols exist.
In contrast, the choice of operating conditions and reactor architecture for commercial CO2R systems will be driven by application economics to the point that the set of idealized scenarios explored at the bench-scale may not reflect practical device set points. Indeed, it may be more cost-effective to operate electrolyzers so that both gaseous and liquid effluents are highly enriched in CO2R products. Results from our previously reported technoeconomic model indicate that separations could constitute a larger fraction of overall CO2R process cost when generating liquid products as opposed to gaseous products.19 Based on this coarse analysis, we postulate that process economics, driven by the desire to minimize downstream separations of liquid products from the carrier phase, will likely dictate that future at-scale CO2R systems generate higher product concentrations than those contemplated at the laboratory-scale today. Accordingly, publications focused on scale-up have begun to highlight electrolyzers which operate with high current densities,20 large total currents,21 and concentrated product streams.22–24
As CO2R cell prototypes begin to traverse these new operating regimes, challenges can be anticipated due to shifts in chemical compatibility requirements for reactor components (catalysts, electrodes, periphery), significant deviations from low-concentration kinetic behavior, and greater process safety concerns arising from concentrated toxic products. Here, we elect to focus on irregularities expected to arise for gas diffusion electrodes (GDEs) while operating gas-fed CO2R devices at high liquid product generation rates. Recent reports of flowing electrolyte CO2R cells with extended durability (ca. 10–100 h) have generally espoused the importance of incorporating fluorinated polymers (i.e., polytetrafluoroethylene (PTFE)) in the GDEs, either as an additive or a structural component, to maintain a stable gas-liquid-solid interface between the liquid product/electrolyte phase and gaseous reactant phase.20,25,26 Historically, fluorinated polymers have been used as hydro-phobic coatings for carbon gas diffusion layers to assist in water management in polymer electrolyte fuel cells27 and as structural components in oxygen depolarized GDEs to maintain stable gas-electrolyte interfaces.28 Initial investigations by Haas et al. and Dinh et al. suggest that fluoropolymer-rich GDEs can significantly improve the operating lifetimes of a variety of CO2R cell architectures.26,29 While PTFE as a GDE support has expanded the envelope for high-current electrolysis, it is reasonable to expect that the assumed equilibrium state of the cathode-electrolyte interface could be perturbed by high concentrations of liquid products, such as alcohols. High alcohol generation rates have also been reported to dissolve some anion-exchange polymer membranes in situ.23 Although this observation is relevant for understanding the limits of specific component durability, we will not focus on this aspect of chemical compatibility in this work.
Gas Diffusion Electrode Flooding Is Governed by Capillary Pressure and Wettability
In CO2R, the GDE is an interfacial cell component that separates the gaseous and electrolyte phases and facilitates flux of reactants/products/electrons to/from the catalytically active sites. A key challenge is the rational selection of GDE materials that can manage diverse (e.g., electrical conductivity and electrocatalytic activity/selectivity) and often contradictory (e.g., permeability and flooding resistance) functionalities across a range of operating modes. Equilibrium between two immiscible mobile phases (i.e., gas and electrolyte) in a porous medium depends on a trans-interfacial pressure differential that is defined both by surface wettability, fluid physical properties, and pore dimensions. If we consider an idealized porous medium to be composed of cylindrical pores, or capillaries, we can use Eq. 1, as proposed by Washburn,30 to calculate the capillary pressure, PC, as a function of the solid-liquid-gas contact angle, θ, the pore radius, r, and the liquid-gas surface tension, γ. The capillary pressure defines the difference at equilibrium between the gas and liquid phase pressures (PG and PL, respectively).31
The relationships between parameters in Eq. 1 are generally valid for understanding high-level capillarity trends. However, in order to more accurately predict the complex filling behaviors of real porous materials, this simple model for capillary pressure should be paired with additional macroscopic descriptors such as porosity, tortuosity, pore size distribution, and pore accessivity.32
Understanding the effects of material selections on wettability properties of the electrodes requires consideration of surface energetics. Porous electrodes are often composite materials, consisting of high energy constituents (i.e., metal or carbon) that provide electrical and thermal conductivity33 and low energy adjuncts (e.g., polymer binders or coatings) that contribute additional functionalities, such as mechanical durability or wet-proofing to manage liquid saturation. Modifications to electrode surfaces can drastically change wettability characteristics regardless of the bulk material.33 In the 1960s, pioneering work by Zisman characterized the spreading and adhesion of liquids on solids as a function of surface energy/surface tension.34 In the context of fluid droplets on planar solids, (i) macroscopic solid-liquid-gas contact angles track with the composition of test fluids according to the surface tension and (ii) test fluids transition from non-wetting (θ > 0°) to wetting (θ = 0°) on a given solid at a surface energy (surface tension) threshold value that depends on the chemical character and physical structure of the surface.
Commonly pursued CO2R products like organic acids (i.e., formic acid) and C1–C3 primary alcohols (i.e., methanol, ethanol, 1-propanol) are water-miscible at ambient conditions. When these organic species are introduced into aqueous solution, even at dilute concentrations, they can greatly affect physical properties such as density, viscosity, and liquid-gas surface tension (Fig. S2, Supplementary Information). Changes to density and viscosity affect pressure drops within flowing electrolyte-based cells; however, we choose not to focus on pumping duties in this work. Changes to surface tension/contact angle, in combination with electrode geometries, most directly influence GDE wetting and saturation, which acutely impact reactant fluxes and, therefore, electrocatalytic performance. Surface tension in electrolyte solutions can be influenced by several factors including ionic strength, anion-cation pairs, and temperature.35–39 Given the breadth of the compositional space and potential testing conditions, here we elect to focus on the introduction of organic components into solution as they are anticipated to most drastically impact surface tension. Further analyses may explore how these effects are amplified or suppressed depending on electrolyte composition or operating conditions.
Measuring the apparent contact angles of sessile droplets is an effective method for characterizing the wettability of candidate porous electrode materials with a variety of test liquids reminiscent of CO2R product streams. Although this macroscopic approach is often applied to study non-ideal substrates, intrinsic contact angles can only be measured on smooth, non-porous surfaces (Young's theory).40 Appropriate corrections to contact angles measured on textured materials, which appear distorted when compared to flat materials with equivalent surface chemistry,33 can be made for both homogeneous (Wenzel) and heterogeneous (Cassie-Baxter) wetting regimes.41,42 Despite the obscurations introduced by roughness and entrapped fluids when determining quantitative measures of wettability on porous substrates, droplet-based protocols are widely practiced to evaluate the resistance of textiles and other electrochemically functional materials to wetting.43–48
Experimental
Contact Angle Measurements with Sessile Drop Goniometry
To better understand the wettability of aqueous-organic mixtures in the context of CO2R, we selected formic acid (FA; reagent grade, ≥95% purity, Sigma-Aldrich), methanol (MeOH; HPLC grade, ≥99.9%, Sigma-Aldrich), ethanol (EtOH; anhydrous, 200 Proof, KOPTEC), and 1-propanol (PrOH; ACS reagent, ≥99.5%, Sigma-Aldrich) for analysis. We prepared solutions across a range of dilutions from 0 to 100% by mass with deionized (DI) water (18.2 MΩ, Milli-Q). Salt-free solutions were used to isolate the interaction between each test liquid and water. Subsequent studies may elucidate the impacts of the chemistry and concentration of dissolved salts on relevant physical properties. FA mixtures were used in place of formate salt solutions because this study focuses on the effect of introducing organic solvent components into aqueous solutions. Although formate salt product mixtures are typically reported in the literature, some electrolyzer variants utilizing porous solid electrolytes can generate salt-free, concentrated acid product streams, making a focus on FA applicable.22,49 Additionally, organic acid solutions are known to have lower surface tension than electrolyte solutions, so FA has utility for a bounding study focused on negative surface tension deviations from water.36,37 PTFE (FP303050, Goodfellow) and graphite (99.997%, 867-421-20, Goodfellow) sheets were used as the primary solid substrates for droplet studies. PTFE sheets were cleaned with DI water and isopropyl alcohol (IPA; ≥99.5% ACS, VWR Chemicals BDH®) and dried using compressed air prior to analysis. Graphite sheets were prepared by removing the top layer of material with Scotch® tape (MFR#: 810, 3 M). 5-μL droplets50 were dispensed onto substrates using an automatic pipetting unit. Measurements were taken in ambient air where the temperature and relative humidity remained between 20–24 °C and 10–40%, respectively. Videos of 30–60 s duration were captured at 30 frames per second using a contact angle goniometer system (Model 200, ramé-hart) and processed using DropPy V1.0.0a0, a Python ≥3.6-based goniometer software.51 Substrates were spot-cleaned before dispensing and imaging new droplets. Contact angles were determined by fitting edges with a two-parameter Bashforth-Adams model that accounts for the effects of gravity on droplet shape. To minimize the influence of evaporation on measurements, only the first 10 s of each recorded video were used for contact angle fitting. As a result of these practical constraints, the reported contact angles may not strictly reflect the equilibrium state. Additional descriptions of experimental procedures (Sections S.1 and S.2) as well as the data collected for each trial (Tables SI and SII) are provided in the Supplementary Information.
Contact Angle Measurements with Select CO2R Products as Test Liquids
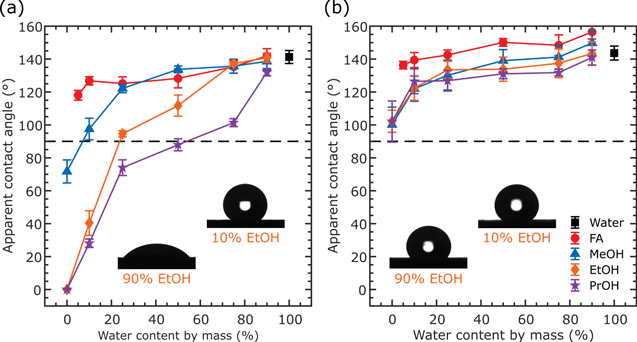
To determine the qualitative impact of mixed organic-aqueous product streams on electrode wettability, we measured the contact angles for the solutions described above as a function of water content, as shown in Fig. 1. The markers for each product represent the average contact angle from 5 trials at each concentration and the error bars are one standard deviation of the same measurements. The water contact angle on PTFE is found to be 112° ± 1.5°, which is consistent with previous work.52 The water contact angle on the graphite sheet is measured at 131° ± 1.8°. As expected, the contact angles of the mixtures on both surfaces decrease with increasing mass fraction of organic species due to the reductions in surface tension. The tendency to wet the solids is directly proportional to the carbon chain length of the product which is associated with decreased polarity and surface tension (PrOH < EtOH < MeOH < FA < water), especially for the primary alcohols.53 The ability for each solid to prevent spontaneous liquid imbibition by a porous electrode can be assessed, at a high level, by comparing the point at which the test fluid would be neutrally wetting in the context of a cylindrical capillary (i.e., has a contact angle of 90°). When studying graphite, solutions with more than 10% alcohol fall below the 90°-threshold; however, the alcohols can be mixed in higher proportions before neutrally wetting conditions are reached on PTFE. In both cases, the FA mixtures reach neutrally wetting conditions at much greater mass fractions than the alcohols, suggesting that such product streams will not lead to significant changes in capillarity relative to pure aqueous solutions in PTFE-containing GDEs. As such, CO2R to FA appears to have a wide range of feasible operating compositions, exceeding the highest reported concentrations to date (ca. 15–30% by mass).22,49 In contrast, the transition concentrations for alcohols are significantly lower and we anticipate that such compositions will be readily-achievable in practical CO2R-to-liquids electrochemical processes, posing a stability challenge for PTFE-containing GDEs.
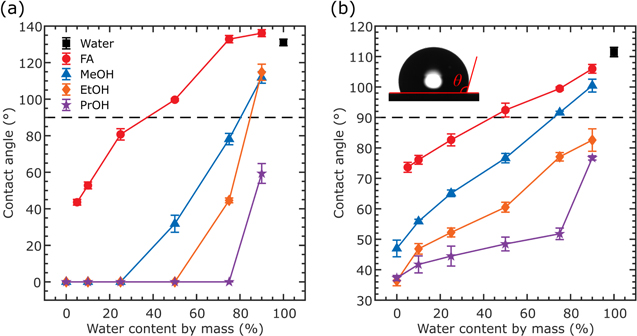
Figure 1. Sessile drop contact angles, θ, on (a) graphite and (b) PTFE for an array of liquid CO2R products as a function of water content by mass. An example image of a sessile water droplet on PTFE is provided in panel (b) to demonstrate the position of θ.
Download figure:
Standard image High-resolution imageBeyond experimental measurements of the apparent contact angles of test fluids, γ can be used as a common predictor for the wettability of different fluid mixtures.33 With the previous θ measurements, we can construct Zisman plots (Fig. 2) to predict the critical surface tension, γC0, for complete wetting (θ = 0°) and the surface tension at the cylindrical capillary transition composition, γC90, (θ = 90°) for both graphite (Fig. 2a) and PTFE (Fig. 2b). We fit the data (black open circles) for each surface with quadratic functions (red lines), which is reasonable based on previous analyses that used similar empirical fits.34 We then predict γC0 values of 34.8 mN m−1 for graphite (R2 = 0.93, RMSE = 4.1 mN m−1) and 21.9 mN m−1 for PTFE (R2 = 0.97, RMSE = 2.4 mN m−1). We performed a similar analysis using a secondary set of well-defined test fluids and determined γC0 to be 14.8 mN m−1 for PTFE. These data (Table SIII) along with an additional Zisman plot and linear empirical fit (Fig. S3) can be found in the Supplementary Information. As can be seen for graphite, the data below 34.8 mN m−1 represent the product compositions that completely spread when contacting the solid. Note that none of the liquids tested had sufficiently low surface tensions to completely wet PTFE, so the empirical fit is needed to estimate γC0. The γC90 for graphite and PTFE are predicted to be 45.2 mN m−1 and 47.2 mN m−1, respectively. These values are useful for predicting sign changes in PC, as will be considered in the next section. For comparison, Zisman reported a γC90 of ca. 40 mN m−1 for PTFE,34 but did not report a value for graphite, which is reasonable given that wettability of carbon surfaces vary widely depending on allotrope.54 As such, microscopically smooth bulk materials that can serve as proxies for carbon particles or fibers remain elusive.55

Figure 2. Zisman plots for (a) graphite and (b) PTFE with all the CO2R test liquids are used to predict wettability with surface tension, γ, as a common descriptor. Empirical quadratic fits (x = γ, y = 1 ‒ cos(θ)) are plotted in red and are used for determining critical surface tensions (☆ markers), such as γC0 and γC90, associated with each material.
Download figure:
Standard image High-resolution imageOperating Envelopes Are Mapped Using Electrolysis Mass Balances
Model Formulation
While ex situ contact angle data only provide qualitative insights on wettability for porous electrodes, such understanding informs materials selection for different classes of reactions. Here, we use wettability data in combination with a simple mass balance model around the cathode reaction zone to estimate ranges of feasible operating conditions before liquid product enrichment near the gas-liquid-solid interface would be expected to induce electrode flooding. A mass balance model represented by the schematic in Fig. 3 accounts for the mass flow rates of water and organic products to/from a well-mixed liquid phase control volume. The results and possible implications of changing electrolyzer set points are primarily discussed in the context of the widely studied flowing liquid electrolyte configuration.8,10,11,25,26,29,56–67 However, some recently reported cell configurations can generate salt-free aqueous-organic mixtures by integrating polymer electrolyte components (dense polymer electrolyte membrane,23 porous polymer electrolyte,49 or ionomer-coated packed beads22). Although the model framework is inspired by cells that use a flowing electrolyte, the zero-dimensional mass balance approach can serve to bound the operating space of CO2R systems without assuming device-specific geometry. It should also be noted that this model cannot predict location-specific flooding susceptibility based on operating conditions and cell geometry.

Figure 3. Electrolyzer mass balance model schematic. Water is fed to the cathode GDE where CO2, water (H2O), and electrons (e‒) are consumed within the catalyst layer to produce liquid organic components. The exiting stream contains an aqueous-organic mixture. We do not include the contributions of hydroxide (OH‒) ions and other anions on the overall mass balance or liquid phase properties.
Download figure:
Standard image High-resolution imageFaraday's law of electrolysis connects the mass flow rates for product generation, P,rxn, (Eq. 2) and water consumption, W,rxn, (Eq. 3) at the cathode to the current (I) and one of the two stoichiometric constants, zP and zW, which correspond to the number of electrons per mole of product generated and water consumed, respectively.


In these equations, F is the Faraday constant, MP is the molar mass (kg mol−1) of a product species, and MW is the molar mass of water. The mass flow rate of feed water, W,in, is defined (Eq. 4) as a function of the inlet volumetric sweep rate, Q, and the density of water, ρW.

Generally, the sweep rate of liquid electrolyte impacts product flux away from the catalyst layer to the bulk electrolyte and, by extension, the distribution of product concentrations along the reactor length and at the exit. In this treatment, we select Q directly (mL min‒1) to regulate product dilution for a given current (mA), but this ability to independently control product removal and tune dilution would be hampered in polymer-electrolyte-based cells as alternative flux mechanisms, like evaporation and membrane transport, are less readily controllable.23
We implement material balances around electrons, water, and liquid reaction products to directly calculate the total mass flow rate exiting the reactor, out (Eq. 5), while ignoring dissolved gases (e.g., CO2, CO, hydrogen, etc.) and dissociated ions such as hydroxide (OH–) produced from the cathodic half-reactions as well as bicarbonate (HCO3‒) and carbonate (CO32‒) that form as a result of carbonation reactions.68 We also choose to set the product feed rate, P,in, to zero in this study.

Through substitution, we define the product mass fraction, xP (Eq. 6), as the total product mass divided by the total mass exiting the reaction zone as a function of total current, I, and inlet water volumetric sweep rate, Q.
Here, I can either represent a partial current towards a target product or, assuming 100% faradaic efficiency, a total current. The water mass fraction, xW (Eq. 7), is readily determined from xP because we assume a binary mixture in the liquid phase.

Each cathodic half reaction consumes CO2, H2O, and electrons and produces hydrogenated products and OH‒ as shown in Table I. Included are the relevant stoichiometric constants—nP (the number of moles of CO2 per mole of product), zP, and zW—as well as MP for each product. We convert from a molar basis to a mass basis because it can be more convenient to work in a laboratory setting with mass (or weight) fractions at high solute concentrations.
Table I. CO2R half-reaction stoichiometry for liquid products.
| Half reaction | nP (mol CO2/mol P) | zP (mol e/mol P) | zW (mol e/mol W) | MP (g/mol P) |
|---|---|---|---|---|
| CO2 + 2 e− + H2O ⟶ HCOO− + OH− | 1 | 2 | 2 | 46.03 |
| CO2 + 6 e− + 5 H2O ⟶ CH3OH + 6 OH− | 1 | 6 | 6/5 | 32.04 |
| 2 CO2 + 12 e− + 9 H2O ⟶ C2H5OH + 12 OH− | 2 | 12 | 12/9 | 46.07 |
| 3 CO2 + 18 e− + 13 H2O ⟶ C3H7OH + 18 OH− | 3 | 18 | 18/13 | 60.09 |
This simple mass balance analysis enables consideration of the cumulative impact of water consumption and organic product generation on the physical properties of the solution and the wettability of the electrode. Note that the stoichiometric constants used in this model only account for the water consumption in cathode half-reactions, as the microenvironment local to the electrode-electrolyte interface will determine flooding. However, in a full cell water is generated at the anode during the oxygen evolution reaction. Depending on the cathode reaction stoichiometry, this source could offset some or all the water consumption (Table SIV, Supplementary Information). For example, there is no net water consumed for the conversion of CO2 to formate/FA, but CO2R-to-alcohols reactions still result in net water consumption. By focusing on the cathode water consumption, this model estimates a conservative upper bound for organic product concentrations anticipated for a given chemistry, current, and liquid sweep rate.
Model Results and Discussion
We have constructed composition contour plots for FA, MeOH, EtOH, and PrOH (Fig. 4) by calculating xP across many currents and flow rates. The y-axes are reported on a base-10 log scale for clarity across several magnitudes of flow rates. Composition isoclines, reported in product content mass (%, solid lines), start at 0.1, 1, and 10% and then continue from 10–100% in increments of 10%. Sweeping the current from 0–1000 mA at fixed Q results in a linear increase in the production rate (Eq. 2), while increasing Q from 0.001–1 ml min‒1 at fixed I decreases xP due to their inverse relation. The product composition contours generally shift downward with increasing number of electrons transferred (i.e., deeper reduction products) and increasing molar mass. The exception is FA, which has a similar molar mass to EtOH. FA composition is less sensitive to Q at fixed I, whereas the alcohols are more likely to reach high concentration through modest changes to Q.

Figure 4. The liquid product concentration, xP, reported in product content by mass (%) with the solid contours, is calculated for (a) FA, (b) MeOH, (c) EtOH, and (d) PrOH as a function of liquid inlet water flow rate and current by using a mass balance around a hypothetical CO2 electrolyzer with a flowing electrolyte stream. The additional black dashed lines correspond to the measured ( – · –) and theoretically predicted (47 mN m−1 from this work, · · · and 40 mN m−1 from Zisman,34 – – –) θ = 90° point on PTFE at which the mixture transitions from non-wetting to wetting.
Download figure:
Standard image High-resolution imageDetermining 90°-threshold compositions from ex situ contact angle data allows us to estimate a band of operating conditions that may lead to an unfavorable PC sign change (i.e., from positive to negative). We use wettability metrics for PTFE to represent GDE stability because they are assumed to be invariant to mild voltage biases within the electrode. In contrast, graphite is the more polarizable GDE component, so we may anticipate that its wettability will increase as a function of electrode voltage in accordance with electrowetting phenomena.69,70 The measured transition composition, here, corresponding to a measured 90° contact angle on planar PTFE, is indicated with a black dot-dash (–  –) line for each of the product subpanels in Fig. 4. These compositions were determined by interpolating between measured data points (Fig. S4, Supplementary Information). If making predictions using a Zisman rule, all liquids with γ below that of a threshold value, which is either 47 mN m−1 (this work, ) or 40 mN m−1 (Zisman, – – –),34 should wet PTFE with a contact angle less than 90°. We estimate the transition composition for each CO2R product by finding the water composition at which the γ curves (Fig. S2b, Supplementary Information) reach the 90°-threshold. While there are discrepancies between the measurements and predicted isoclines, the differences between the operating conditions needed to achieve each composition are relatively minor. At flow rates above each transition line, the sweep stream provides enough water to the reaction zone at a given current to keep the product composition below the critical imbibition point. Put another way, for a given sweep rate, the electrochemical conversion rate is slow enough that enrichment of organic species in the reaction zone is not so great as to lead to flooding.
In agreement with the contact angle measurements, the ordering and position of the transition composition isoclines in Q-I space align with the γ and polarity of the organic species (Fig. S2b, Supplementary Information). Plotting the isoclines for different liquid species together (Fig. 5) is an effective way for determining if electrolyzer operating conditions need to be tailored according to product identity. For example, although FA mixtures reach the threshold at much higher concentrations as compared to the alcohol mixtures, the operating conditions required to reach zero capillary pressure are similar for species of equivalent polarity. At the extremes of species wettability (i.e., PrOH vs FA), however, the Q required to induce a contact angle transition varies by nearly an order of magnitude at the same I.
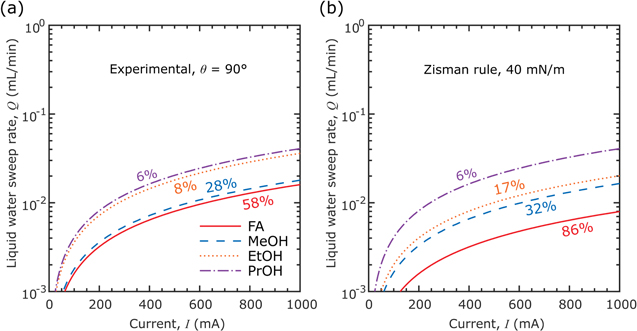
Figure 5. Transition composition contours corresponding to θ = 90° on PTFE (when PC = 0 bar) as (a) measured in this work and (b) predicted from a Zisman rule surface tension threshold (θ = 90°) of 40 mN m−1 for nonpolar solvents on PTFE.34
Download figure:
Standard image High-resolution imageNow with xP mapped to different operating conditions, we can connect the wettability of the various liquid mixtures to a simple prediction of equilibrium PC using Eq. 1, which is helpful for understanding the pressure differentials required to maintain a stable gas-liquid-solid interface in a gas fed CO2 electrolyzer. Again, here we do not initially consider complex physical and geometric features evident in real GDE materials (e.g., thickness, pore size distribution, fiber spacing, particle sizes, mixed wettability)71,72 to determine PC or flooding dynamics because simplified models suffice for capturing general trends in capillarity. However, further analyses explicitly considering saturation or wetting dynamics in electrodes with finite volume could expand from these zeroth-order analyses of interfacial PC and refine predictions of stable operating envelopes.
We compute PC at various levels of water content, xW, (Fig. 6) in order to translate product composition to equilibrium interfacial pressure along the contours in Fig. 4. The PC data associated with this figure are reported in Table SV in the Supplementary Information. We employ interpolated PTFE contact angle values (Fig. S4) to calculate PC with diameters of 30 μm and 0.1 μm as representative of the effective pore dimensions for macroporous carbon fiber substrates and microporous layers, respectively.72 As the pore diameters differ by a factor of 300, the PC scales accordingly. Results can be interpreted for each pore by using the left (30 μm) and right (0.1 μm) vertical axes of Fig. 6. Generally, the smaller pores characteristic of a microporous layer—assuming it is crack-free—exhibit greater capillary pressure values as compared to the larger pores characteristic of a carbon fiber substrate.73 For a given set of intrinsic solid-liquid affinities (specified by γ and θ), the pore diameter can serve to modulate the driving force for imbibition. If we were to overlay the PC outputs onto the corresponding composition contours of Fig. 4, these new isoclines would serve to approximate the magnitude of the maximum liquid-gas pressure differential that a GDE could withstand while still maintaining interfacial stability. For example, once PC becomes negative, a porous electrode may spontaneously imbibe the liquid phase and become flooded. This coarse approach allows for the insertion of PC models that are uniquely suited to specific electrode microstructure, layer composition, and surface functionalization. Comparing the operating envelope for each liquid-PTFE combination as a function of current and flow rate is useful for predicting if any notable physical changes to the system pressure equilibrium emerge when targeting different CO2R products. The critical composition lines generally shift upward from FA to PrOH, according to chain length, depth of electroreduction, and decreasing polarity, which taken together indicate that the allowable operating space will narrow as the deeper CO2R products considered in this subset are pursued.
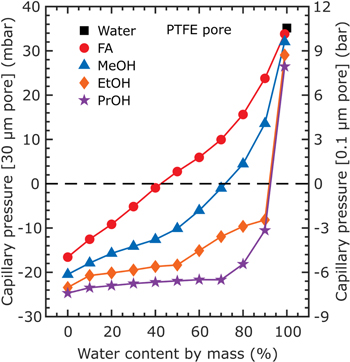
Figure 6. Capillary pressure, PC, is calculated as a function of water content by mass, xW, and CO2R liquid product for cylindrical PTFE pores with diameters of 30 μm (left axis) and 0.1 μm (right axis), which are representative of characteristic pore sizes in carbon fiber substrates and microporous layers, respectively.
Download figure:
Standard image High-resolution imageThese results suggest that the operating envelope for FA is likely to be wider than for alcohols for PTFE-containing GDEs. However, when considering that many existing commercial GDEs are composite materials (conductive metal and hydrophobic PTFE components) with mixed wettability properties (vide supra, oxygen depolarized cathodes), these contours may constitute an optimistic set of conditions correlating to PC transition. Using composite GDEs may ultimately prove necessary when scaling to larger cell areas due to enhanced through-plane conductivity as compared to the PTFE-supported electrodes. Despite the greater flooding risk inherent to this category of GDEs, which are necessarily composed of high energy conductive constituents, there are still opportunities to tune wet-proofing content to achieve favorable PC envelopes70 as well as high CO2R activity and faradaic efficiency.8,11
This mass balance analysis serves to estimate PC thresholds for porous electrodes in contact with low surface tension liquid mixtures. However, what is not evident from the results until now is that pore geometry and surface wettability together determine PC in real porous media. Therefore, in the next two sections we briefly discuss the potential for leveraging microstructure and surface chemistry to engineer more robust porous electrodes for CO2R-to-liquids electrolyzers.
Opportunities for Selecting Electrode Microstructure to Prevent Spontaneous Flooding
Using idealized cylindrical pore geometry alone to determine electrode stability thresholds suggests that liquid mixtures spontaneously enter porous media precisely at the 90° threshold. However, porous electrodes often consist of non-ideal material geometries, such as packed particles or entangled fibers, that can exhibit non-intuitive filling and draining behaviors.71 Inspired by the earlier works of Purcell71 and Mason & Morrow,74 Forner-Cuenca and colleagues developed a constricted pore model and used it, in part, to explain why patterned hydrophilic channels in fibrous gas diffusion media do not necessarily spontaneously fill with water.72,75 This adaptation of the Washburn model framework shown in Eq. 8 appears similar to Eq. 1, but allows for a pore radius, r = r(z), that varies as a function of longitudinal position, z, and introduces a new variable called the filling angle, α = arctan(dr/dz), which changes according the local derivative of the pore profile.
It is important to note that PC = PC(z) since the pore diameter varies according to the longitudinal position along the pore channel. Therefore, the operable output of this model is the maximum capillary pressure along the channel length, since the location of highest resistance determines whether the liquid will tend to spontaneously advance into, or flood, the pore. For this analysis, we use a maximum pore diameter, dmax, of 30 μm, and fiber diameter, dfiber, of 10 μm as representative of carbon fiber substrates.72 A schematic of the pore geometry (Fig. S5) along with more details about the modified capillary pressure expression (Section S.3) and the model's parameter sensitivities (Figs. S6–S8) are provided in the Supplementary Information.
Exploring the resistive effect imparted by α, we calculate the maximum PC as a function of the constriction aspect ratio, dmin/dmax, or the ratio between minimum and maximum pore diameters. Each contour in Fig. 7 corresponds to a generic CO2R liquid aqueous-organic mixture in contact with PTFE surface. The surface tension and PTFE contact angle combinations (γ, θ) for each contour are functionally defined by the polynomial fit shown in Fig. 2b. The results reported in this plot indicate that, as might be expected, solutions with θPTFE > 90° have a maximum PC > 0 for all constriction ratios. However, mixed results emerge for solutions with θPTFE < 90°. From this plot, we see that the maximum PC values for solutions with contact angles slightly lower than 90° start negative but eventually cross the zero capillary pressure line. These results support the previously validated observation that positive pressure differentials (PL ‒ PG > 0) are sometimes required to fill constricted (dmin/dmax < 1), hydrophilic pores.72 Through this simple analysis, we can see the inherently protective effect of constricted pore geometry with regards to electrode flooding. Considering this possibility, we suggest that porous media be selected according to specifics of the pore geometry (i.e., packed particles or fibers) in addition to other factors (e.g., pore size distribution, pore connectivity, thickness, etc.). However, we cannot neglect the fact that adding constrictions to the porous substrate (i.e., decreasing dmin/dmax) could negatively impact other transport phenomena in the GDE (e.g., gas phase effective diffusivity) by increasing the tortuosity and/or decreasing overall permeability.76 The extent of this tradeoff has yet to be determined in this context.
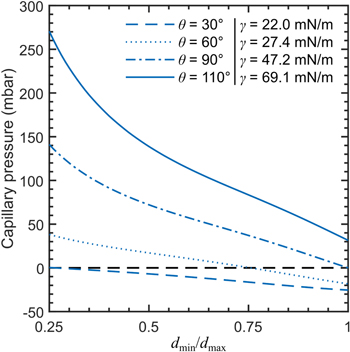
Figure 7. Maximum capillary pressure is calculated for a constricted cylindrical pore (dmax = 30 μm, dfiber = 10 μm) as a function of the ratio between minimum and maximum pore diameters, dmin/dmax. The contour lines correspond to different combinations of (γ, θ) for a generalized liquid CO2R product on PTFE as defined by the (red) Zisman plot polynomial fit line shown in Fig. 2b. By adding a constriction (dmin/dmax < 1) to an otherwise cylindrical channel, we see that a positive pressure difference is required to flood the pore for liquid mixtures with θ < 90°.
Download figure:
Standard image High-resolution imageOpportunities for the Integration of Oleophobic Materials
Oleophobic treatments constitute a readily-available modification to GDEs that may better suit aqueous-organic environments.34 Introducing oleophobicity to PTFE membranes has enabled their use as venting materials in electronic devices filled with organic solvents, such as lithium-ion batteries.77 Although we cannot necessarily measure the intrinsic wettability of porous materials with macroscopic sessile drop methods,47,78 apparent contact angles enable comparisons between different samples. Using the same methods as described for solid PTFE (vide supra), we measured the apparent contact angles (Fig. 8) of the test liquids on two different porous sheets: untreated PTFE (PM21M, Porex®) and oleophobic PTFE (PMV15T, Porex®). The raw data are reported in Tables SVI and SVII of the Supplementary Information. The non-wetting envelope (ca. θ > 90°) for all the test liquids is expanded for the porous materials as compared to the dense, flat PTFE sheet shown in Fig. 1. As mentioned earlier, surface roughness and entrapped gases can increase the apparent phobicity/philicity of a given solid-liquid-gas combination. However, while the untreated porous PTFE is eventually wetted by lower surface tension mixtures, the oleophobic PTFE does not exhibit any θ < 90°. These initial results demonstrate that appropriate modifications to extant and proven material sets may greatly improve wettability characteristics. While the oleophobic treatment here was applied to a PTFE substrate,79 it could, in principle, be expanded to other polymer, metal, or carbon substrates to improve liquid repellency or tune wettability, ideally with a covalent bond to improve adhesion.80 Durability under alkaline CO2 electrolysis conditions is paramount, so it is advantageous that disclosed compositions for oleophobic fluoropolymer coatings are already functionally compatible with proven polymer additives such as PTFE.79,81,82 However, validation of coating compatibility in this application requires the development of rigorous protocols that emulate a variety of extreme scenarios (solvent exposure, elevated temperatures, physical abrasion, etc.).83,84 Finally, although the optimal distribution of oleophobicity throughout the GDE subdomains (i.e., macroporous substrate, microporous layer, and/or catalyst layer) is not explored in this work, it should be considered in future studies.
Figure 8. Apparent sessile drop contact angles for selected CO2R product liquids as a function of water content by mass on (a) Porex® PM21M expanded PTFE and (b) Porex® PMV15T oleophobic treated sintered PTFE sheets.
Download figure:
Standard image High-resolution image
Conclusions and Outlook
The generation of concentrated liquid products in CO2 electrolyzers is an economically attractive operating objective that may be attainable by targeting high current to liquid sweep rate ratios. Under such conditions, the propensity to flood cathode GDEs may increase, in part, due to enrichment of low-surface-tension liquid products. Thus, connecting electrolyzer set points to gas diffusion media wettability/capillarity is paramount for understanding device durability. By combining sessile drop contact angle measurements, electrolyzer mass balances, and capillary pressure models, we can map CO2R liquid product compositions to cell operating conditions (liquid sweep rate and applied current) and, subsequently, estimate the liquid-gas pressure differentials that might result in electrode flooding. Using this simple framework, we predict that FA-generating electrolyzers could be more resistant to flooding than the equivalent alcohol-producing electrolyzers when targeting high-mass-fraction effluents. In fact, we predict that alcohol concentrations <30% by mass could flood a GDE in the absence of additional pressure control. After expanding the capillary pressure model to include pore constrictions, we observe that it may be possible to exploit the complex capillarity behavior of realistic microstructures to engineer more robust GDEs. We also see an opportunity to tune the wettability characteristics of current GDE material sets via oleophobic treatments, with the goal of expanding the stable operating envelope for CO2R-to-alcohols electrolyzers. By exploring some of the material challenges that face CO2R during the necessary scale-up phase, we hope to inspire additional researchers in this field to consider these obstacles at an early stage of technology development.
Acknowledgments
The authors acknowledge the financial support of DOE SBIR Contract #DE-SC0015173. The authors kindly thank Prof. Karen K. Gleason and the members of her group for access to and support using their goniometer system to measure contact angles. The authors also thank Lauren E. Clarke and Charles T.-C. Wan of the Brushett Research Group for insightful discussions. Finally, we would like to thank Porex® for providing us with samples of its porous PTFE and oleophobic-treated PTFE materials that were used in this study.
Credit Author Statement
McLain E. Leonard: Conceptualization, Methodology, Formal Analysis, Investigation, Resources, Writing—Original Draft, Writing—Review & Editing, Visualization Michael J. Orella: Methodology, Software, Writing—Original Draft, Writing—Review & Editing Nick Aiello: Investigation Yuriy Román-Leshkov: Supervision Antoni Forner-Cuenca: Conceptualization, Methodology, Formal Analysis, Writing—Review & Editing Fikile R. Brushett: Funding Acquisition, Project Administration, Supervision, Writing—Review & Editing.