
Abstract
The fibrous electrodes used in redox flow batteries are a key component of the batteries and have a determining effect on their performance. In this work, a two-dimensional numerical model of redox flow batteries was developed and used to optimize the architecture of the electrodes employed in vanadium redox flow batteries with interdigitated flow fields. The developed model was validated and subsequently used to determine the optimized electrode architecture. During the optimization process, we considered the fiber diameter, porosity, and thickness of the fibrous electrode as well as the geometrical properties of the channel. Numerical simulations revealed that the cell performance can be improved significantly by employing electrodes consisting of finer fibers. We also show that multiple-parameter optimization that considers the electrode properties and channel geometry is essential for improving the design of redox flow batteries.
Export citation and abstract BibTeX RIS

This is an open access article distributed under the terms of the Creative Commons Attribution Non-Commercial No Derivatives 4.0 License (CC BY-NC-ND, http://creativecommons.org/licenses/by-nc-nd/4.0/), which permits non-commercial reuse, distribution, and reproduction in any medium, provided the original work is not changed in any way and is properly cited. For permission for commercial reuse, please email: oa@electrochem.org.
Electrical energy storage systems that can be used for the efficient utilization of renewable energy are attracting increasing attention, owing to their swift response, which allows them to compensate for the intermittent availability of solar and wind power. Redox flow batteries (RFBs) are among the devices being explored for this purpose, as they allow for the storage of large amounts of energy, which can then be used during periods of peak shaving and load leveling.1–5 In the RFB system, the energy and power are decoupled, since the energy is stored in chemical form in solutions held in external tanks, and is only converted into electrical energy during use. Hence, these subsystems can be designed independently, allowing for the development of versatile electrical energy storage systems for a low-carbon society.
Further improvements in the energy and power densities of RFBs are necessary for their commercialization.6–8 Recently, redox pairs based on both inorganic and organic chemistries9–13 have been proposed and demonstrated for use in high-energy-density and low-cost RFB systems. In RFBs, aqueous and non-aqueous solutions are circulated from the external tanks to the cells during operation. A high energy density can be achieved by concentrating the active species in the solution or by ensuring that the solution contains the active materials in solidified form.14–16 However, this inherently increases the viscosity of the solution and causes the cell performance to deteriorate, owing to mass transport and pumping losses.
While high-power-density operations remain a challenge and depend on the cell architecture, there is a lot of freedom with respect to the architecture, especially when designing the electrodes and flow channels.17 In the last decade, the designs and materials developed for polymer electrolyte membrane fuel cells have also been evaluated for use in RFBs. Serpentine and interdigitated flow fields18 result in superior performance and reduce the overpotential of RFBs when used in combination with thin, fibrous carbon electrodes.19–21 They are thus replacing the flow-through channel geometry used in conventional RFBs. Different types of flow fields have been investigated through numerical and experimental studies22–33 in order to further improve the performance of RFBs.
Some of the approaches under exploration for energy loss reduction in RFBs include modifying the conventionally used electrodes and developing new ones; this is because the cell performance is highly affected by the electrode architecture34–42 and catalytic activity.43–45 To enhance the electrochemical reaction and reduce the activation overpotential, the surface area of the electrode must be large. Thus, electrospun fibrous electrodes are being tested, as the diameter of the fibers that make up these electrodes can be controlled with ease. The aim is to reduce the diameter of the electrode fibers, which are synthesized by electrospinning techniques,46–49 to be significantly lower than 10 μm, which is the diameter of the fibers of conventional carbon papers and cloths. On the other hand, electrodes consisting of finer fibers can potentially lead to poorer cell performance because of their lower permeability. The large flow resistance of such electrodes means that the flow velocity of the electrolyte within them is low. This results in an insufficient supply of the active species to the electrode surface, resulting in an overpotential during the electrode reaction.50 Therefore, the fiber diameter is an important parameter that must be optimized, as it can potentially have both positive and negative effects on the cell performance. The porosity and thickness of the electrode as well as the geometrical properties of the channel are also important parameters to be optimized, because these parameters also have a determining effect on the cell performance.
The aforementioned approaches are promising for improving the cell performance. However, optimizing the electrodes and flow field architecture of RFBs remains an open question. In particular, optimizing the electrode architecture is of great importance with respect to the development of fibrous electrodes suitable for use in RFBs. Therefore, in this work, a two-dimensional numerical model of RFBs in which the electrode properties and the channel geometry are taken into account, was developed for optimizing the electrode architecture. Numerical simulations were performed using different sets of parameters to computationally determine the optimal parameter values. In addition, experimental tests were performed to validate the numerical model. Next, the different parameters were optimized individually, in order to highlight those that affect the electrode surface area and electrolyte flow velocity. Finally, multiple-parameter optimization was performed to determine the set of parameters corresponding to the optimal electrode architecture.
Mathematical Model of RFBs
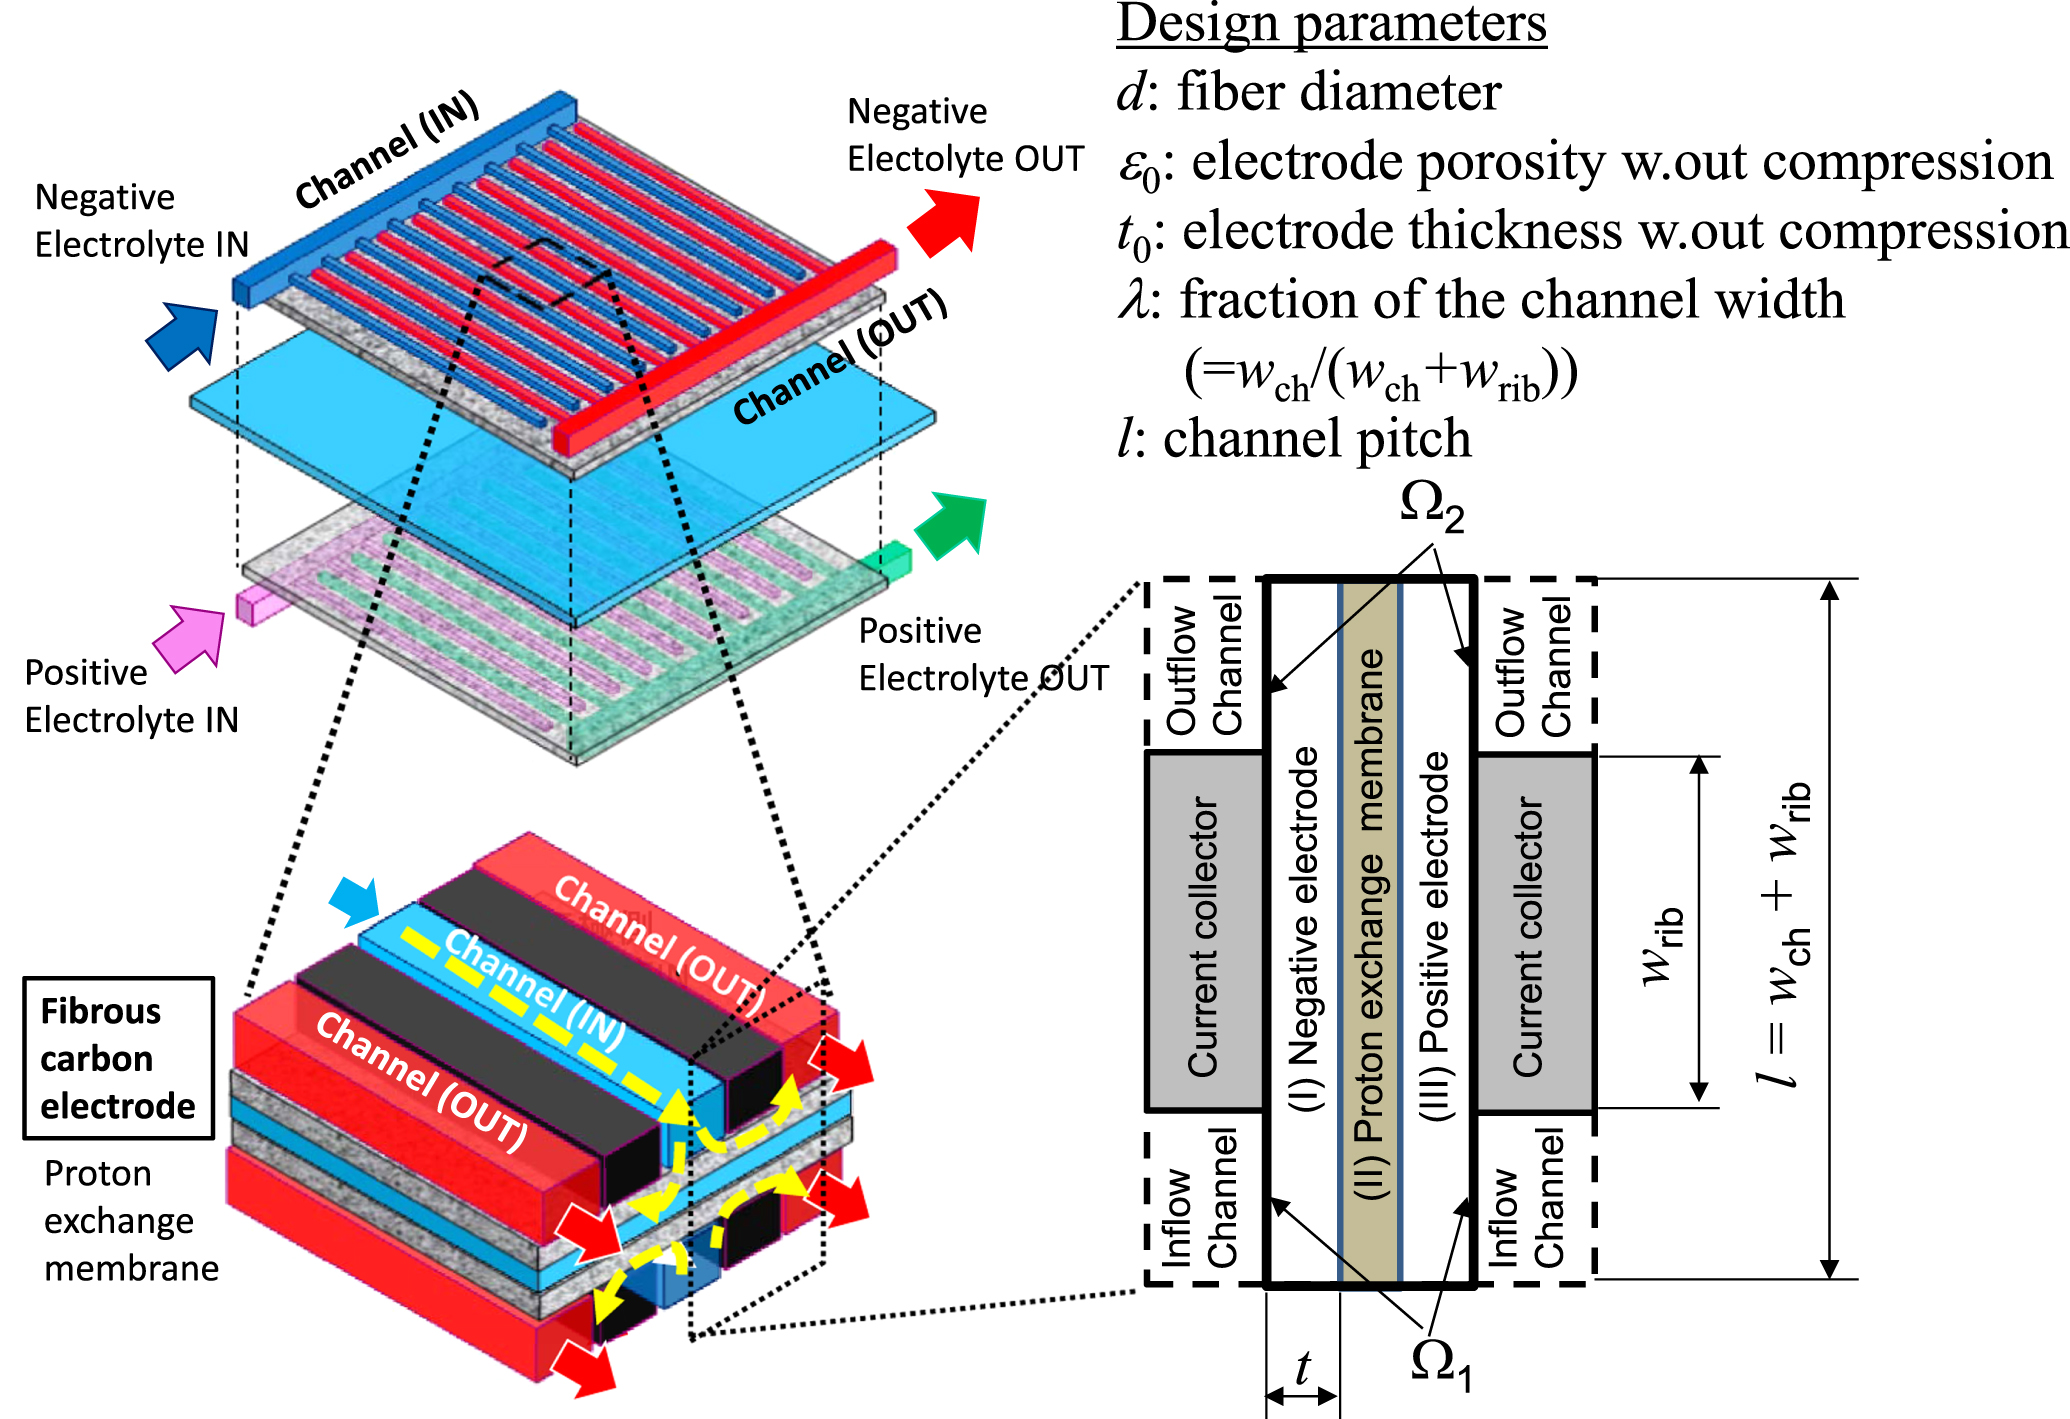
Focusing on the optimization of the electrode architecture, a two-dimensional RFB system was modeled in this study. An interdigitated flow flied was assumed for the simulations, as it results in superior cell performance. Figure 1 shows a schematic of a single cell of an RFB with an interdigitated flow field and the calculation domain to be modeled. A proton exchange membrane is sandwiched between the two fibrous carbon electrodes. Negative and positive electrolytes are supplied from the inlet channels, and they flow to the outlet channels via the electrodes.

Figure 1. Schematic view of a single RFB cell with interdigitated flow field and calculation domain with design parameters examined.
Download figure:
Standard image High-resolution imageThe calculation domain consists of the (i) negative electrode, (ii) proton exchange membrane, and (iii) positive electrode, as shown in the figure. The negative and positive electrolytes are supplied from the inlet boundary, which is denoted by Ω1, and flow to the outlet boundary, which is denoted by Ω2. The inlet and outlet pressures were taken as the boundary conditions during the simulations. Further, incompressible electrolyte flow was assumed, as shown below:

The two-dimensional electrolyte velocity, u, within an electrode can be calculated using Darcy's law:

where μ is the electrolyte's viscosity and p is the electrolyte's pressure. The permeability of the fibrous carbon electrode, kf, is modeled using the following equation51,52:

where d and ε are the fiber diameter and porosity of the fibrous electrode after compression and κf is the Kozeny-Carman constant.
A previously described global kinetics model53,54 was used for the discharging process.
Negative electrode:

Positive electrode:

The two-step dissociation of H2SO4 in the aqueous sulfuric acid solution was also taken into account.


It was assumed that the first step of the dissociation process occurs to completion while the dissociation rate of the second step, Rd, is determined by the following equation53:

where kd is the dissociation rate constant, and β is the degree of dissociation of HSO4−.
The concentration distribution of each species, Ci, where i is V2+, V3+, VO2+, VO2+, H+, and HSO4−, in the porous electrode is calculated based on the mass balance and hence the transport equation, that is, the Nernst-Planck equation:


where ϕl is the liquid potential and F is the Faraday constant. The source term for each species, Ri, is given in Table I.
Table I. Source terms for mass and charge conservation equations.
| Species | Domain | Source term |
|---|---|---|
| V2+ | Negative electrode | iR,neg/F |
| V3+ | Negative electrode | −iR,neg/F |
| VO2+ | Positive electrode | iR,pos/F |
| VO2+ | Positive electrode | −iR,pos/F |
| H+ | Negative electrode | −Rd |
| H+ | Positive electrode | −2iR,neg/F−Rd |
| HSO4‒ | Negative electrode | Rd |
| HSO4‒ | Positive electrode | Rd |
The effective diffusion coefficient, was calculated using the following Bruggeman correction:

The ionic mobility in the electrolyte, umob,i, was found using the Nernst-Einstein equation. Equation 12 is based on the dilute solution theory55:

where R is the universal gas constant and T is the temperature. Charge conservation was assumed in the solid and liquid phases:


where  is the effective (bulk) electronic conductivity of the electrode (solid phase), which was modeled using the electronic conductivity of the solid electrode material,
  as follows:

The local reaction current density per unit volume in the negative and positive electrodes, that is, iR,neg and iR,pos, respectively, were determined based on the surface concentrations of the chemical species i,  using the Butler-Volmer equations:
Negative electrode:


Positive electrode:


where i0,neg and i0,pos are the exchange current densities of the negative and positive electrodes, respectively. Further, kneg and kpos are the reaction rate constants for the negative and positive electrodes, respectively. Finally, A is the volume-specific effective surface area of the fibrous electrode after being compressed in the cell, and was calculated using the following equation52,56:

where κs is the effective surface ratio while assuming that the electrode surface was partially covered by the binder, and was assumed to be unity in this study. The fibrous electrode was assumed to be uniformly compressed, and the compression ratio, ψ = t/t0, was defined as the ratio of the electrode thickness after compression, t, to the electrode thickness before compression, t0.
To solve these equations, the mass transfer resistance at the electrode−electrolyte interface was introduced. The mass transfer flux of the vanadium species from the bulk electrolyte solution to the surface of the electrode was balanced by the reaction flux at the electrode surface. For example, to calculate  and
and  the following mass balance equations were used for the vanadium species,53,54


where the local mass transfer coefficient, km,pos, which has a significant effect on the overall cell performance, depending on the electrolyte velocity, as reported recently,57,58 was modeled using the Sherwood number.52–54,59,60

Where Re = ∣u∣d/v is the Reynolds number and Sc = v /Dpos is the Schmidt number. Further, Dpos is the bulk diffusivity of the vanadium species; v is the kinetic viscosity, and χ, ζ, and ξ, are fitting parameters. Note that the local mass transfer coefficient used here is spatially averaged around the fiber although it depends on the orientation of the fiber to the flow direction. Similar expressions were used to calculate the local mass transfer coefficient, km,neg, and the concentrations of the vanadium species, namely, 

 and
and  at the negative electrode.
The activation overpotentials in Eqs. 16 and 18 were calculated as follows:


where  and
and  are the potentials in the solid matrix and the electrolyte solution (liquid) in the electrode, respectively; and
  and
and  are the open-circuit potentials, which were calculated using the Nernst equation, as follows:


where  and
and  are the equilibrium potentials in the negative and positive electrodes, respectively.
The transport and kinetics-related properties namely, the permeability, viscosity, bulk diffusion coefficient, reaction rate constant, charge transfer coefficient, and electronic conductivity of the electrodes used for model validation are listed in Table II.
Table II. Transport and kinetics-related properties used for model validation.
| Symbol | Value | Description |
|---|---|---|
| μneg | 2.5 × 10⁻³ | Negative electrolyte viscosity [Pa s]53 s]53 |
| μpos | 5.0 × 10⁻³ | Positive electrolyte viscosity [Pas]53 |
| ρneg | 1.3 × 10³ | Negative electrolyte density [kg/m3]53 |
| ρpos | 1.35 × 10³ | Positive electrolyte density [kg/m3]53 |

|
2.4 × 10⁻¹⁰ | V2+ diffusion coefficient [m2/s]53 |

|
2.4 × 10⁻¹⁰ | V3+ diffusion coefficient [m2/s]53 |

|
3.9 × 10⁻¹⁰ | VO2+ diffusion coefficient [m2/s]53 |

|
3.9 × 10⁻¹⁰ | VO2+ diffusion coefficient [m2/s]53 |

|
9.3 × 10⁻⁹ | H+ diffusion coefficient [m2/s]54 |

|
1.33 × 10⁻⁹ | HSO4− diffusion coefficient [m2/s]53 |

|
1.06 × 10⁻⁹ | SO4− diffusion coefficient [m2/s]53 |
| β | 0.25 | HSO4− degree of dissociation53 |
| kneg | 2.21 × 10⁻⁷ | Rate constant, negative reaction [m/s]a)) |
| kpos | 8.84 × 10⁻⁷ | Rate constant, positive reaction [m/s]a)) |
| αneg | 0.5 | Transfer coefficient, negative reaction [−]b)) |
| αpos | 0.5 | Transfer coefficient, positive reaction [−]b)) |
| ε0 | 0.83 | Electrode porosity without compression [−] |
| ψ | 0.75 | Compression ratio [−]c)) |
| σs | 6.05 × 10² | Electronic conductivity of electrode [S/m]53 |
| σm | 2.95 | Ionic conductivity of membrane [S/m]c)) |
| Rcell | 0.61 | Cell electrical resistance [Ωcm2]c)) |
| χ | 0.38 | Coefficient in Eq. 23 [−]a)) |
| ζ | 0.78 | Index in Eq. 23 [−]a)) |
| ξ | 0.31 | Index in Eq. 23 [−]a)) |
The proton and sulfonic acid concentrations in both the negative and the positive electrodes at the inlet were determined by considering the electroneutrality and dissociation of H2SO4 in the electrolyte used in the experiments, as described below. The ionic conductivity of the membrane was measured experimentally. The calculation conditions are given in Table III.
Table III. Species concentration at inlet boundary.
| Symbol | Value | Description |
|---|---|---|

|
1615 | V2+ concentration at negative inlet [mol/m3] |

|
85 | V3+ concentration at negative inlet [mol/m3] |

|
85 | VO2+ concentration at positive inlet [mol/m3] |

|
1615 | VO2+ concentration at positive inlet [mol/m3] |

|
4241 | H+ concentration at negative inlet [mol/m3] |

|
4244 | H+ concentration at positive inlet [mol/m3] |

|
2546 | HSO4− concentration at negative inlet [mol/m3] |

|
2544 | HSO4− concentration at positive inlet [mol/m3] |
The cell voltage during discharge was calculated as follows:

where I is the current density and Rcell is the cell electrical resistance.
As stated previously, in this study, we first validated the numerical model by comparing the simulations results with those of experiments for different electrolyte flow rates. Then, we focused on the parameters affecting cell performance and investigated each parameter individually in order to elucidate their influence on the electrode surface area and flow field, and hence the cell voltage. Finally, we performed multiple-parameter optimization with respect to the electrode and channel properties to determine the set of optimal parameters for the electrode architecture corresponding to the optimized channel geometry.
Results and Discussion
Model validation
To validate the proposed model, the numerically calculated cell polarization curves were compared with those obtained experimentally. Figure 2 shows the vanadium RFB used for model validation. The cell, which had an interdigitated flow field, and consisted of end plates, current collectors, gaskets, electrodes (Sigracet®10AA, SGL carbon), and a proton exchange membrane (Nafion®212, DuPont). The geometrical dimensions of the electrodes were 1.9 cm × 1.9 cm. Further, resin-impregnated graphite current collectors were used. The width of the channels and ribs of the interdigitated flow field were fixed at 1.0 mm. During the experiments, an electrolyte solution consisting of vanadium ions and sulfonic acid was used, based on the calculation conditions listed in Table III. Each 100 ml electrolyte solution was stored in a glass vessel and supplied to each side of the cell by a peristaltic pump. Both solution charging and discharging were carried out under a temperature of approximately 25 °C. The solution was charged until the open-circuit voltage of the cell reached 1.57 V. Subsequently, the polarization curves were recorded during the discharge stage. The phenomenon of mass transfer in the porous electrode has a significant effect on the cell performance.41,57 Hence, the experiments were performed at three different electrolyte flow rates, namely, 5.2, 3.0, and 1.5 ml min−1, corresponding to the stoichiometries of feed rates to the consumption rates of 0.13, 0.22 and 0.44, respectively, at 0.5 A cm−2. The numerical simulations corresponding to these flow rates were performed by varying the difference in the applied pressures, namely,  where
where  and
and  are the applied pressures at the inlet and outlet, respectively.

Figure 2. Schematic of RFB used for model validation.
Download figure:
Standard image High-resolution imageFigure 3 shows the polarization curves for the different flow rates. The experimental results indicate that the cell performance deteriorated with the reduction in the flow rate of the electrolyte solution supplied to the cell. At the highest flow rate, that is, at 5.2 ml min−1, the cell voltage decreased linearly with the current density. On the other hand, at the lower flow rates, the cell voltage dropped sharply during operations at large current densities. The limiting current densities observed at flow rates of 3.0 and 1.5 ml min−1 were approximately 0.95 and 0.65 A cm−2, respectively. It is also worth noting that the flow rate affected the cell performance even at moderately high current densities (0.2 − 0.4 A cm−2).

Figure 3. Polarization curves of vanadium RBF with interdigitated flow fields for different flow rates.
Download figure:
Standard image High-resolution imageThese results can be attributed to the mass transfer resistance caused by an insufficient supply of the active species to the electrode surface, as discussed below. As shown in Fig. 3, the proposed model captured these experimental phenomena, and the calculated polarization curves were in good agreement with the experimental results.
Figure 4 shows the spatial distributions of  and
and  in the negative and positive electrodes at a current density of 0.4 A cm−2. It should be noted that the bulk concentrations of the reactive species, namely,
  and
and  were not less than 1 mol l−1 even at the lowest flow rate of 1.5 ml min−1. On the other hand, the numerical simulations showed the spatial distributions of
  /
/ and
and  /
/ in the negative and positive electrodes at the current density of 0.4 A cm−2. At the lowest flow rate of 1.5 ml min−1, both
  /
/ and
and  /
/ were less than 0.2 in the entire corresponding electrode, as shown in Fig. 5. These observations confirmed that the deterioration in the cell performance shown in Fig. 3, were caused by the localized depletion of the reactive species at the electrode surface. The decrease in the electrolyte flow rate reduced the local mass transfer coefficient, owing to the decrease in the local Reynolds number in the electrodes.

Figure 4. Spatial distributions of  and
and  in negative and positive electrodes at a current density of 0.4 A cm−2.
Download figure:
Standard image High-resolution image
Figure 5. Spatial distributions of  /
/ and
and  /
/ in negative and positive electrodes at a current density of 0.4 A cm−2.
Download figure:
Standard image High-resolution imageOptimization of individual parameters
Prior to the simulations to determine the optimal electrode architecture, which are discussed in the next section, we first performed a survey to examine the effects of various cell parameters on the cell performance in order to obtain insights into the simplified system. Here, we focused on the following design parameters related to the electrode and channel geometry, as depicted in Fig. 1: fiber diameter, d; porosity of the porous electrode without compression, ε0; electrode thickness without compression, t0 = t/ψ; ratio of channel width to cell width, which is the channel width plus the rib width, λ = wch/(wch + wrib); and channel pitch, which is the centerline distance between the inlet and the outlet channels, l. It should be noted that, in the following calculations, a single parameter from the ones mentioned above was varied while the other parameters were kept constant (see Table II). The variations in the cell voltage at a current density of 0.1 A cm−2 during the discharge stage were also examined, because the numerical simulation can be kept stable at low current density conditions even with large parameter variations. We also confirmed that the mass transfer resistance around the fibers gives rise to an overpotential even at 0.1 A cm−2 as shown in Table IV.
Table IV. Effect of mass transfer resistance on the calculated cell voltage at 0.1 A cm−2.
| Flow rate | 5.2 ml min−1 | 3.0 ml min−1 | 1.5 ml min−1 |
|---|---|---|---|
| W.Out Mass transfer resistance | 1.352 V | 1.350 V | 1.343 V |
| W. Mass transfer resistance | 1.332 V | 1.322 V | 1.303 V |
Without the mass transfer resistance, assuming  and
and  the calculated cell voltage is 1.352 V at a flow rate of 5.2 ml min−1, with a voltage drop of 9 mV caused by decreasing the flow rate from 5.2 ml min−1 to 1.5 ml min−1 (=1.352 V-1.343 V). With the consideration of mass transfer, the cell voltage is 1.332 V at 5.2 ml min−1. This is 20 mV lower than the case without mass transfer resistance at the same flow rate. The effect of the mass transfer resistance is further pronounced when the flow rate decreases as the voltage drops further by 29 mV (=1.332 V-1.303 V); indicating that the mass transfer resistance gives a negative impact on the cell voltage even at the low current density of 0.1 A cm−2.
Fiber diameter
The fiber diameter is one of the most important parameters affecting cell performance in RFBs. The diameter of the fibers in the fibrous carbon electrodes used in RFBs is typically approximately 10 μm.61 There is however limited choice of commercially available fibrous carbon materials. Because the fiber diameter determines the electrode surface area as well as the flow field within the electrode, the electrospinning technique has recently been used to fabricate the fine fibrous electrodes used in RFBs.42–45,49
Figure 6 shows the variations in the cell voltage at the current density of 0.1 A cm−2 when the fiber diameter was varied from 1.5 μm to 20 μm. The cell voltage was highest at a fiber diameter of 4 μm (Fig. 6a). Reducing the fiber diameter increased the specific surface area of the electrode (Fig. 6b). This, in turn, reduced the activation overpotential. On the other hand, reducing the fiber diameter had a negative effect on the electrolyte flow velocity within the fibrous electrode, as shown in Fig. 6b, where the line-average velocity of the electrolyte flowing under the center of the rib from the inlet channel to the outlet channel is plotted for the different fiber diameters. With a reduction in the fiber diameter, the electrode pore diameters were also reduced, resulting in lower permeability. This decreased the flow velocity and limited mass transfer around the fibers, leading to a decrease in the concentration of the active species at the electrode surface. This, in turn, induced higher overpotential. The loss in the cell voltage at fiber diameters smaller than 4 μm can thus be attributed to the reduction in the flow velocity.

Figure 6. Effects of fiber diameter on (a) cell voltage and (B) specific surface area and flow velocity.
Download figure:
Standard image High-resolution imageThe positive and negative effects of the fiber diameter on cell performance must be balanced. Hence, we attempted to determine the optimal diameter through simulations. Note that this optimal value was obtained through a single-parameter optimization process and thus would be different from the optimal value obtained when all the parameters were optimized together, as discussed in the following section.
Electrode porosity
The effect of the electrode porosity on cell performance is shown in Fig. 7. Here, we varied the electrode porosity from 0.6 to 0.95. The highest cell voltage was obtained when the electrode porosity was approximately 0.8. It can be seen from the figure that the electrode porosity also had both positive and negative effects on the cell voltage. An increase in the porosity resulted in a higher flow velocity (Fig. 7b), which is advantageous for improving mass transfer around the electrode surface. However, this positive effect was limited. Further, the effect was less pronounced for porosities higher than 0.8. These observations suggest that there is a flow velocity critical value for reducing the mass transfer resistance, with the effect becoming negative once the flow velocity exceeds this limit.

Figure 7. Effects of electrode porosity on (a) cell voltage and (b) specific surface area and flow velocity.
Download figure:
Standard image High-resolution imageWith respect to the negative effects of the porosity, an increase in the porosity reduced the specific surface area of the electrode (Fig. 7b). For electrode porosities higher than 0.8, this negative effect of the reduction in the electrode surface area played a dominant role in determining the cell performance while the effect of the flow velocity became less pronounced.
Electrode thickness
The geometrical properties of the electrode and the channel are also of great significance for improving cell performance. Hence, we next investigated the effects of the electrode thickness. Figure 8 shows that the electrode thickness had a significant effect on the cell performance, with the optimal electrode thickness being approximately 2.0 mm (Fig. 8a). This was because the electrode surface area increased linearly with the electrode thickness (Fig. 8b). However, it was also observed that further increases in the electrode thickness had a less pronounced effect on the cell voltage. This can be explained by the fact that the electrolyte flow velocity decreased with the electrode thickness, as shown in Fig. 8b. This resulted in an inhomogeneous flow distribution within the electrode, as shown in Fig. 9b, in that the flow velocity in the electrode near the membrane was much lower than that near the ribs (Fig. 9a).

Figure 8. Effects of electrode thickness on (a) cell voltage and (b) electrode surface area and flow velocity.
Download figure:
Standard image High-resolution image
Figure 9. Effects of electrode thickness on flow field for t0 = (a) 1.0 mm and (b) 3.0 mm.
Download figure:
Standard image High-resolution imageGeometrical properties of the channel
The effects of the geometrical properties of the channel were also examined by changing the ratio of the channel width to the cell width, that is, the channel fraction (Fig. 10) and channel pitch (Fig. 11).

Figure 10. Effects of channel fraction on (a) cell voltage and (b) flow field.
Download figure:
Standard image High-resolution image
Figure 11. Effect of channel pitch on (a) cell voltage and (b) flow field.
Download figure:
Standard image High-resolution imageThe cell voltage was the highest at a channel fraction of 0.2 (Fig. 10a) and channel pitch of 0.3 mm (Fig. 11a). Both the channel fraction and the channel pitch had positive and negative effects on the cell voltage, as was also seen in the case of the other electrode parameters. Note that the geometrical properties of the channel do not have any effect on the electrode surface area but influence the flow field. This is different from the case for the electrode parameters, which affect both the electrode surface area and the flow field.
The flow fields for the different channel fraction values are shown in Fig. 10b. At λ = 0.2, which corresponded to the case where the electrode consisted mostly of the rib, the electrolyte flowed uniformly from the inlet to the outlet in the electrode. This was advantageous for ensuring a homogeneous electrochemical reaction. On the other hand, at λ = 0.9, the electrolyte flowed through the shortcut path from the inlet to the outlet in the electrode under the rib. This caused a part of the electrode to have a lower flow velocity, resulting in a decrease in the cell performance.
The channel pitch also affected cell performance, with the effect being negative for a shorter pitch (l = 0.1 mm), as shown in Fig. 11b. For channel pitch values smaller than the electrode thickness, the flow distribution in the electrode was inhomogeneous, resulting in an insufficient supply of the reactive species in the electrode, especially near the membrane side. Further, higher channel pitch values should ideally have had a negative effect on the cell performance, as they should result in an increase in the flow resistance of the fibrous electrode. However, this was not observed in the present study. In fact, it was seen that the flow velocity remained high even at a channel pitch of 1.6 mm.
Multiple-parameter optimization: optimization of electrode architecture
Single-parameter optimization can help improve cell performance while providing useful insights regarding how the individual parameters affect the electrode surface area and flow distribution, as was described in the previous section. However, to determine the optimal structure for RFBs, in principle, all the parameters affecting cell performance should be optimized simultaneously. Thus, next, we attempted to simultaneously optimize the various parameters investigated in the previous section.
We set the optimization problem using the vector x = (d, ε0, t0, λ, l), which consisted of the electrode and channel properties, and defined the objective function, f, as the cell voltage at I = 0.1 A cm−2 during the discharge stage. The objective function was multiplied by −1 to set the problem to be one of minimization. Note that all the parameters to be optimized had their own constraints owing to various geometrical and physical limitations. Therefore, the problem was expressed in the constrained local minimization form:


where m = 5, and  and
and  are the lower and upper bounds of
  respectively.
To find the optimal vector  we used the bound optimization by quadratic approximation (BOBYQA) algorithm.62 This method has been used widely in various fields, including engineering,63 because of it suitability for use with nonlinear least-squares problems. The objective function, f, was calculated by solving the aforementioned governing equations and was updated iteratively with the revised vector, x, until it no longer improved beyond a set limit.
A starting point, x0, was set, and multiple-parameter optimization was performed. The optimal values of the various parameters are listed in Table V. The calculation converged after 150 iterations, and the cell voltage improved to 1.45 V. This is much higher than the voltages after the single-parameter optimizations, where the highest value was 1.4 V and was seen in the case of the optimized electrode thickness (see Fig. 8). This confirmed that when the various parameters are optimized simultaneously, greater improvements in the cell performance can be realized.
Table V. Values of electrode and channel parameters during multiple-parameter optimization.
| Fiber diameter d [μm] | Electrode Porosity ε0 [−] | Electrode Thickness t0 [μm] | Channel fraction λ [−] | Channel pitch l [mm] | Cell voltage E [V] | |
|---|---|---|---|---|---|---|
| Initial, x0 | 10.00 | 0.840 | 390 | 0.50 | 2.00 | 1.351 |
| Trial at 14 | 6.01 | 0.819 | 409 | 0.49 | 1.96 | 1.414 |
| Trial at 26 | 1.70 | 0.892 | 572 | 0.28 | 1.32 | 1.439 |
| Trial at 62 | 1.42 | 0.920 | 634 | 0.29 | 0.50 | 1.449 |
| Trial at 80 | 1.40 | 0.917 | 632 | 0.29 | 0.48 | 1.450 |
| Trial at 150 (After opti.) | 2.41 | 0.885 | 896 | 0.48 | 0.62 | 1.451 |
The variations in the parameters during the optimization process are plotted in Fig. 12, and some of the identical parameter sets are listed in Table V. It can be seen from the listed values that the improvement in the cell performance was primarily attributable to the optimization of the fiber diameter and thickness of the electrode, that is, to the use of the optimized electrode parameters, and the channel geometry. However, all of the parameters were related and simultaneously affected the cell voltage.

Figure 12. Values of various parameters during multiple-parameter optimization: (a) cell voltage, (b) fiber diameter, (c) electrode porosity, (d) electrode thickness, (e) channel fraction, and (f) channel pitch.
Download figure:
Standard image High-resolution image
From the initial conditions, the cell voltage first increased sharply with a decrease in the fiber diameter to approximately 6.0 μm during Trial 14. Note that, during this trial, the porosity of the electrode was 0.819, which is slightly lower than that in the initial state. As was observed during the single-parameter optimizations (see Figs. 6 and 7), a decrease in the fiber diameter and porosity increased the electrode surface area, resulting in an improvement in the cell performance. Thus, the tuning of the fiber diameter and porosity of the electrode resulted in a positive feedback effect.
Next, during Trial 26, the fiber diameter was reduced further to 1.6 μm, and the electrode thickness was increased to approximately 600 μm. These changes also increased the electrode surface area. However, as was also observed during the single-parameter optimizations (see Fig. 6), very large decrease in the fiber diameter caused the cell voltage to fall, as it reduced the electrolyte flow velocity. However, this negative effect was compensated for by an increase in the electrode porosity and decrease in the channel pitch during the trial. These two changes resulted in a decrease in the flow resistance of the fibrous electrode.
Next, slight improvements were seen in the cell voltage during Trials 62 and 80. During these trials, the channel pitch was reduced. This caused the flow resistance between the inlet and outlet channels to decrease. However, it should be noted that, in actual RFB systems, reducing the channel pitch can lead to pumping losses because of the flow resistance induced in the channel. For a constant applied pressure, the narrowing of the channel had a negative effect on the flow velocity. Thus, the obtained results confirmed that three-dimensional multiple-parameter optimization is essential for improving the design and hence the performance of RFB systems.
Finally, the optimization process showed that a fiber diameter of 2.4 μm was the optimal one, as it increased the electrode surface area. Simultaneously, to mitigate the negative effect of the decrease in the fiber diameter on the flow velocity, the electrode porosity and thickness and channel width were also optimized; the optimized values were found to be approximately 0.885, 900 μm, and 0.62 mm, respectively. Thus, single-parameter optimization is not sufficient for realizing significant improvements in the cell performance. On the other hand, multiple-parameter optimization performed while taking the electrode and channel parameters into account, was found to be suitable for improving the cell performance. In the future, we plan to use this approach in combination with topology optimization64,65 to simultaneously optimize the design of each electrode matched with the reaction rates and transport properties in the positive and negative side, and the flow fields in RFBs.
Conclusions
In this study, we developed a mathematical model for vanadium RFBs and validated the model using experimental data obtained at different flow rates. The model was then subjected to single-parameter optimizations in order to elucidate the effects of the individual parameters on the electrode surface area and electrolyte flow velocity. Although the cell performance improved after the independent optimization of each of the parameters, we found that simultaneous optimization of all the parameters was necessary to determine the set of parameters at which the electrode architecture matched the channel geometry. The bound optimization by quadratic approximation method was used successfully to determine the optimal electrode and channel parameters for vanadium RFBs. The results showed that a reduction in the fiber diameter to 2.4 μm and an increase in the electrode thickness to 900 μm are necessary, as these changes increase the reactive surface area. Further, the porosity of the electrode should be increased to 0.89 to ensure that the electrolyte velocity in the fibrous electrode is high, which helps decrease the resistance to mass transfer around the fiber electrode. The channel pitch should also be reduced to 0.62 mm to lower the flow resistance in the electrode, thereby improving the cell performance. After the multiple-parameter optimization, the cell voltage could be improved by 0.1 V with respect to that in the case of the conventional electrode architecture. In summary, the simultaneous optimization of the electrode and channel parameters is essential for designing the optimal fibrous electrode and flow field and hence realizing further improvements in the performance of RFBs.
Acknowledgments
This research was supported by a Precursory Research for Embryonic Science and Technology (PRESTO) grant (grant number JPMJPR12C6) from the Japan Science and Technology Agency (JST).