
Abstract
The majority of the ceramic solid electrolytes (LLZO, LATP) demonstrate polycrystalline grain/grain-boundary (G/GB) microstructure. Higher lithium (Li) concentration and lower mechanical stiffness result in current focusing at the GBs. Growth of Li dendrites through local inhomogeneities and subsequent short circuit of the cell is a major concern. Recent studies have revealed that bulk Li metal is a viscoplastic material that has low (∼0.3 MPa) and high (∼1.0 MPa) yield strength during deformation at smaller and larger rates of strain, respectively. It has been argued that during deposition at smaller current densities, due to its lower yield strength, Li metal should demonstrate plastic flow against stiff ceramic electrolytes, and Li dendrites will be prevented from penetrating through solid electrolytes. In this manuscript, a multiscale modeling framework has been developed for predicting properties of GBs and the bulk of ceramic electrolytes using atomistic calculations for input to mesoscale models. Using the parameters obtained from the atomistic simulations, the mesoscale model reveals that, given enough time, even at low charge rates, lithium dendrites can grow through the GBs of LLZO. The present multiscale model results also provide information regarding the dendrite growth velocity through LLZO.
Export citation and abstract BibTeX RIS
The exceptional mechanical and electro-chemical properties of ceramic based solid state electrolytes (SSEs) have made them one of the leading candidates for use in next generation lithium metal batteries, including solid-state batteries.1–3 In particular, the high stiffness of SSEs (around 5 times or more larger than that of lithium)4 is expected to prevent lithium dendrite growth during metal deposition.5,6 However, recent experiments demonstrate that dendrite growth can occur in SSEs7,8 despite their high stiffness. Numerous theories have been proposed to explain this phenomenon, including their polycrystalline nature,9 presence of space charge regions,10 or other unique transport parameters.11 Experimentally, current focusing has been observed within the SSEs, which can eventually lead to fracture initiation and propagation.8 Lithium dendrites have been observed to penetrate through these crack openings.7
Examples of ceramic based SSEs are Li7La3Zr2O12 (LLZO), Li1.3Al0.3Ti1.7(PO4)3 (LATP), Li10GeP2S12 (LGPS), and all of them demonstrate substantially different conductivities and mechanical properties at the grain boundaries (GBs) and the bulk (or grain interior) domain.9,11–13 Here, we focus on the LLZO based ceramic SSE, because of its relatively high room temperature conductivity and enhanced chemical stability with respect to Li.4,14 In order to stabilize the high conductivity cubic phase of LLZO, it is usually doped with aluminum (Al), or tantalum (Ta), or niobium (Nb), which helps to create vacancies and enhances the conduction of lithium ions.14,15 Regarding the initiation of dendritic protrusions within LLZO based SSEs, multiple theories have been proposed that predict the propensity of dendrite formation either in the GB or inside the bulk grain interiors.16,17 Density Functional Theory (DFT) based calculations estimate that excess electrons can be trapped around the lanthanum (La) atoms located near the surface of the cubic LLZO,10 which has the capability to reduce lithium ions and form lithium precipitates inside the SSEs. Due to higher partial molar volume of lithium atoms than lithium ions,18 such a precipitate can lead to the generation of substantial stress within the SSE, which can cause initiation of cracks.19 Some other researchers have observed flow of electrons through the LLZO electrolyte,20 and attribute the dendrite growth to the reduction of lithium ions by these flowing electrons. Another theory proposes that the inherent poly-crystallinity of LLZO leads to mechanically softer GB regions.9 This has the ability to cause current focusing at the softer GB regions, and subsequent dendrite growth through them.9,21 The current focusing at the GB can be attributed to lower stress induced electrochemical potential at the GBs.21 It has been demonstrated that evolution of the mechanical stress induced electrochemical potential prevents the deposition of lithium metal.6,22 Softer GBs lead to the development of less stress induced electrochemical potential, as compared to the bulk. This, in turn, leads to enhanced lithium deposition at the GBs. In the present research, the authors focus on this third theory, and try to estimate how the variation in transport and mechanical properties at the bulk and GB cause formation and propagation of dendritic protrusions though LLZO SSEs.
The deformation mechanism of Li metal should have substantial impact on the propagation of Li dendrites. Very recent experiments have observed that bulk metallic Li demonstrates elastoplastic behavior with yield strength around 0.7 MPa.23 Due to the lower melting temperature of Li (180 °C), at room temperature a metallic Li anode can demonstrate substantial viscoplastic and creep effects.24–26 The rate of deformation experienced by lithium metal is usually directly proportional to the applied current density.27 Hence, at lower currents (∼1 A m−2), depositing Li metal has a lower yield strength (∼0.3 MPa), whereas, at higher rates of deposition (∼100 A m−2), Li should behave as a much stronger material (yield strength ∼10 MPa).27,28 This inherent rate dependent variation in the yield strength of Li metal can have significant effect on the stress field that evolves around the GBs during lithium deposition under various current densities. It should be easier for Li deposited at higher rates (∼100 A m−2), to crack the LLZO electrolyte and short the cell.29 Similarly, at lower rates of deposition (∼1 A m−2), due to very low yield strength and creep flow of Li, it is expected that lithium dendrites should be retarded.27 However, experimentalists have observed growth of lithium dendrites through LLZO SSEs at current densities as low as 1 A m−2–2A m−2.8
It has been argued that irrespective of the germination mechanism of dendritic protrusions, their propagation happens mostly through the GB region of LLZO electrolytes.7,8,30 Hence, the size of the propagating Li should have similar dimensions as that of the GB region, in the range of nanometers.31 Sizes of these dendrites are much smaller than that usually used in bulk experiments.24,27 Smaller Li protrusions are expected to have smaller grain sizes, and due to the Hall-Petch effect, lead to higher yield strength. It has been observed by experimentalists that micron sized Li protrusions demonstrate yield strength around 30 MPa—100 MPa.31,32 Extrapolating from this trend, nanometer sized Li should have yield strengths in the range of few GPa.
Since dendrite growth can happen through the bulk as well as grain-boundary of the LLZO SSEs,33–35 the elastic modulus of both bulk and GB region, as well as grain size of LLZO electrolyte, should have an impact on the dendrite growth rate. Hence, the magnitude of current focusing and propensity of fracture initiation at the GB domain depends on the kinetic, transport and mechanical properties of Li metal and LLZO GB region with respect to the bulk of LLZO SSE.9,11,12,36 There exist several experimental attempts where the conductivities within grain-interior and grain-boundaries have been investigated using impedance based methodologies.11,13,36,37 Some of them concluded that the lithium conductivity within bulk (or GI) is larger than the GB,13,36,37 and some others concluded that the GB conductivity is larger than GI under room temperature conditions.8,11 Regarding mechanical properties, such as Young's modulus, there does not exist any conclusive methodology that can successfully probe the GB region, which is around 2 nm to 10 nm in thickness,38 to measure its elastic properties. Overall, there does not exist any experimental data in the literature that conclusively reports the physical or electrochemical properties at the GB region.
Hence, in the present research, a multiscale computational framework has been developed that can estimate the required parameters at the bulk and GB domains using atomistic calculations; and the calculated properties can be used in a mesoscale model to predict the propensity of current focusing and dendrite growth within the SSE. For estimating the relevant parameters at the atomic scale, a combination of Density Functional Theory (DFT), Monte Carlo (MC) and Molecular Dynamic (MD) simulations has been conducted.9,12 For the mesoscale analysis, we extended our earlier work, where continuum level charge conservation equations have been solved along with a momentum balance relation, which helps to capture the stress induced electrochemical potential.21 The atomistic model provides information regarding the magnitudes of conductivity and Young's modulus in both the bulk and GB, along with the fracture energy of bulk-LLZO. Incorporating these parameters into the mesoscale model, it is possible to estimate the extent of current focusing at the GB, and the time needed to initiate fracture within the LLZO SSE under a specific applied current density. We demonstrate that GB cracking, Li nucleation and dendrite propagation through the GB region of LLZO electrolytes can happen even under lower current densities, if deposition is allowed to continue for sufficiently large amount of time. The impact of lithium yield strength, GB elastic modulus, and LLZO grain size, on the dendrite initiation time and growth velocity has been investigated as part of this research. Finally, limitations of the present modeling technique are discussed briefly.
Methodology
A multiscale computational framework has been developed capable of estimating the propensity of dendrite growth through the LLZO solid electrolytes. Estimation of the transport (for example, ionic conductivity) and mechanical (for example, Young's modulus) properties at the GB and bulk grain interior has been conducted using the atomistic simulations at lower length scales.9,12 The possibility of lithium dendrite growth through the LLZO ceramic electrolyte has been investigated by solving a set of continuum equations at the mesoscale level.21 The material properties at bulk and GB domains, required for solving the continuum model, have been adopted from the atomistic lower length scale simulations. Elastic-viscoplastic properties of lithium metal anode and the exchange current density at Li/LLZO interface have been adopted from existing literature.27,31,39,40 Both the atomistic and continuum based mesoscale modeling techniques have been described below.
Atomistic modeling techniques
The entire lower length scale model framework has been developed based on Density Functional Theory (DFT), Ab-Initio Molecular Dynamics (AIMD), Monte Carlo (MC) and classical Molecular Dynamics (MD) techniques. Appropriate methodologies have been evoked for predicting different parameters of interest. For example, a combination of DFT and AIMD has been used for determining the LLZO surface facet with lowest energy with respect to lithium metal.41 Classical MD has been used to predict the Young's modulus at the GB regions of the electrolyte,9 which is an almost impossible task with the AIMD techniques due to the computational limitations associated with it. A description of the various atomistic computational techniques mentioned above is provided below.
First principles calculations have been performed using the Vienna Ab-initio Simulation Package (VASP)42 code with plane wave basis sets and projector-augmented wave (PAW) pseudo-potentials.43 The exchange-correlation functional has been treated within the generalized gradient approximation (GGA) of Perdew-Burke-Ernzerhof (PBE).44 The cutoff energy for the plane-wave basis has been set at 600 eV, which was tested and applied for all super-cells. The convergence criterion of the total energy has been set to be within 1 × 10⁻⁵ eV within the K-point integration, and all the geometries were optimized until the residual forces becomes less than 1 × 10⁻² eV Å−1. For the interface structure with extended super-cells in each phase, a 5 × 1 × 1 Monkhorst-Pack k-points mesh has been used in the self-consistent calculations, whereas 3 × 3 × 3 Monkhorst-Pack k-points mesh has been applied to the bulk and surface calculations.
To investigate the interaction of a Li metal anode and LLZO surface, ab initio molecular dynamics (AIMD) simulations have been performed using the VASP code.42 The exchange-correlation functional is treated within the generalized gradient approximation (GGA) of Perdew-Burke-Ernzerhof (PBE)43 with Γ-point Brillouin zone sampling and a 600 eV plane-wave energy cutoff. A time step of 1 femtosecond is used for the integration of the equations of motion and a 10−6 eV energy convergence criterion. An NVT-ensemble simulation at the temperature T = 300 K is employed. A supercell containing 6 layers of Li (100) (78 atoms) and LLZO (100) with Li termination (192 atoms) is developed. The fully optimized structures at T = 0 K have been used as initial structures to simulate AIMD calculations. The final Li/LLZO interface used for the AIMD structure is shown in Fig. 1b. The stability of the interface between Li electrode and the lowest energy LLZO surface ((100) Li terminated) has been investigated with ab initio molecular dynamics (AIMD) simulations. All production runs of AIMD trajectories have been obtained after 20 picosecond of thermal equilibration. It is worth noting that the (100) surface of LLZO has already been pointed out as the lowest energy surface in earlier studies.45
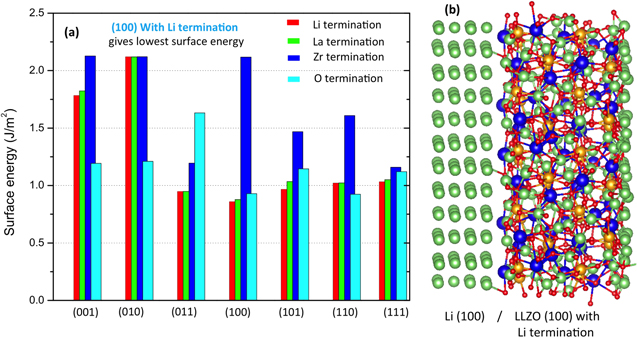
Figure 1. (a) Surface energies obtained from DFT calculations for different crystalline facets of LLZO under different termination conditions. It is evident that the crystal facet (100) with lithium termination gives the minimum surface energy. (b) Interface between Li and LLZO, with (100) surface for lithium metal anode and lithium terminated (100) surface for LLZO solid state electrolytes facing each other.
Download figure:
Standard image High-resolution imageTo establish the atomic structure/stoichiometry of LLZO GBs, Monte Carlo and Molecular dynamics simulations have been conducted using LAMMPS with soft BV potentials.12,46–48 The GB structure has been determined through a series of calculations including zero Kelvin geometry optimization, NPT MD heating to 1200 K, NPT equilibration at target temperature, NVT equilibration at target temperature for 3 ns, and NVT Monte Carlo (MC) simulations. These calculations have provided the structure of low angle grain boundaries ![$\left[\displaystyle {\sum }_{3}\left.\left(112\right)\right)/\left(1-10\right)\right],$](https://content.cld.iop.org/journals/1945-7111/167/10/100537/revision2/jesab9b08ieqn1.gif) where the tilt angle is 70.5°. It reveals that the equilibrium composition near the
where the tilt angle is 70.5°. It reveals that the equilibrium composition near the  GB in LLZO is enriched with Li. The structure of the grain boundaries has been used to calculate various properties, such as, Li ion conductivity, and mechanical properties that are needed for the continuum level modeling of dendrite growth. Approximately 1.9 M atoms have been used for mechanical property calculations.
Mesoscale modeling techniques
All the computational analysis in the atomic scale were conducted in length and time scales in the range of nanometers and nanoseconds.9,12 Continuum level analysis usually involve length and time scales in the range of hundreds of microns and thousands of seconds, for example growth of dendrite and complete short circuit of a LLZO pellet.7,30 In order to bridge these atomic scale estimations with the predictions conducted at the continuum level, it is necessary to successfully capture the physicochemical phenomena that occurs at the intermediate length and time scales.49 In the present context, ion transport in the GI/GB region of the LLZO SSE, lithium deposition at the electrode/LLZO interface, mechanical stress generation within Li and LLZO, have been modeled in detail. Several prior research activities characterized the computational modeling of physical phenomena at GI/GB domains as mesoscale models.50,51 Hence, the intermediate length (sub-micron) and time (seconds) scale models developed here to understand the mechanical stress generation and charge transport processes within Li and GI/GB of LLZO, can be characterized as mesoscale models.49
The mesoscale analysis has been conducted in a two-step fashion, where the stress induced electrochemical potential at the GB and the bulk has been evaluated using a Localized Model, and the propensity of current focusing and dendrite growth in the electrolyte have been estimated using the Generalized Model.21 Suppression of Li protrusions due to the plastic deformation and creep flow of metal deposits have been estimated using a modified version of the Localized Model, which were later incorporated into the Generalized Model as an effective parameter. Details of this two-step computational methodology for evaluating the possibility of current focusing and fracture initiation at the GB domain has already been described in an earlier manuscript published by the authors.21 For the sake of completion, the most relevant governing equations and boundary conditions will be briefly discussed below.
As is evident from the name itself, the Localized Model focuses at a very small domain at the triple junction point of lithium electrode, GB and bulk grain interior, where the domain width is approximately 50 nm.21 Based on the evolution of mechanical stress at the Li/LLZO interface, the magnitude of stress induced electrochemical potential is estimated, which impacts the overall reaction current density.6,22 Due to differences in the elastic properties at the GB and bulk of LLZO, different magnitudes of stress induced electrochemical potential evolves there, which results in variation in reaction current density at the GB and bulk domains.21 The magnitude of stress induced electrochemical potential has been transferred from the Localized Model to the Generalized Model, where the extent of current focusing along with possibility of fracture initiation and propagation, have been investigated.
During deposition, the total amount of Li that should deposit at a particular point can be estimated from the local current density using the Faraday's Law.52,53 Due to plastic deformation of Li, all the metal that deposits at the Li/LLZO interface, or within a cracked region of the LLZO electrolyte, does not cause deformation of the solid electrolyte. Actual deformation of LLZO is obtained from a modified version of the Localized Model, where the fractional vertical deformation of LLZO has been estimated during Li deposition at the electrode/electrolyte interface. Similarly, fractional horizontal deformation of LLZO has been estimated for metal deposits at open cracked regions. These fractional horizontal and vertical deformations of LLZO have been used in the Generalized Model while analyzing the initiation and propagation of lithium dendrites.
A larger computational domain has been adopted in the Generalized Model, where the domain width is around 500 nm, and contains multiple grain/GB microstructural features.21 The total number of grain/GB/Li triple points depends on the grain size adopted in the analysis. Along with the mechanical stress induced electrochemical potentials, the relative conductivity and Li concentration of the bulk, with respect to the GB, impacts the presence or absence of current focusing at the GBs.9,12,21 To simplify the computational analysis, no lithium electrode has been analyzed in the Generalized Model. In the presence of current focusing, non-uniform deposition of lithium should occur, and that can lead to application of point loads within LLZO electrolyte. It has also been demonstrated by the authors in their earlier research work, that current focusing at the GB domain can eventually lead to initiation of crack fronts at the same place.21 Propensity of these crack fronts to propagate and form spanning cracks through which lithium dendrites can easily grow, will also be predicted by the Generalized Model.
To capture the ion transport within lithium electrode and LLZO electrolyte, the charge balance equation, as demonstrated below, has been solved in both the Localized as well as the Generalized Models.21,52,53

where,  is the gradient operator,
  indicates conductivity, and
  denotes potential. The magnitude of conductivity is substantially different in lithium metal, bulk LLZO and GB domains, which has been adopted from the lower length scale simulations. Assuming that ceramic LLZO behaves as a single ion conductor, no equation has been solved to capture the evolution of concentration gradient within the solid electrolyte.21,52 Reaction current at the Li/LLZO interface is given by the modified version of the Butler-Volmer equation, as shown below6,22,54 (see Appendix A and Fig. A·1 for a physical understanding):
where,  is the reference exchange current density,
  and
and  are the anodic and cathodic transfer coefficients, respectively,
  indicates the mechanical stress induced electrochemical potential, and
 and
and  are Faraday's constant, the universal gas constant and the absolute temperature. The surface overpotential,
  for this lithium-electrolyte interface is given by
  where
where  and
and  are the potentials in the electrode and electrolyte phases, and
  indicates the open circuit potential, which has been assumed to be zero for the reduction reaction of lithium metal. The reference exchange current density,
  is given by the following expression22,54:
where,  indicates the reference rate of reaction, and
  denotes the concentration of lithium salt within the electrolyte adjacent to the electrode. As mentioned earlier, in solid ceramic electrolytes lithium ions are part of the crystal lattice structure, and hence, the concept of salt concentration does not make any sense.12,55 Even though concentration gradients do not evolve within the LLZO solid electrolytes, the concentration of Li ions at the Li/LLZO interface affects the exchange current density through its impact on the jumping frequency. There may be a variation in the concentration of lithium ions within the bulk LLZO and GB domains.9,12 This difference in ion concentration can affect the reference exchange current density, which will again have an impact on the current focusing observed within LLZO electrolytes.22,54 The appropriate equilibrium concentration of lithium ions at the bulk and GB of LLZO has been estimated using the lower length scale simulations. The stress induced electrochemical potential can be expressed in terms of the mechanical stress
  and the partial molar volume of lithium metal
  as,6
as,6
where,  is the unit normal vector at the lithium/electrolyte interface pointing into the solid state electrolyte layer,
  is the molar volume of metallic lithium,
  is the deviatoric stress tensor and
  is the hydrostatic component of the stress tensor. The
  and
and  superscripts indicate lithium electrode and solid-state electrolyte, respectively. Please note that the compressive hydrostatic stress has been assumed to be positive here.6 Since the interface between Li-metal and the SSE is taken to be flat, there is no curvature-induced component. Also, in SSEs, the lithium cations are a part of the crystal lattice structure, so their partial molar volume within the SSE is taken to be zero.18,22 It should be pointed out that the present formulation of stress induced electrochemical potential, as reported in Eq. 4, is only applicable to ceramic based inorganic single ion conducting solid state electrolytes, where only lithium ions carry the current within the bulk of the electrolyte. Since, the anions are part of the lattice structure, they do not participate in the charge carrying process. The transference number of cations in 1.0, and the transference number for anions is 0.0, within these LLZO SSEs. Following Eq. (20) in the article Monroe and Newman (JES, 2004, A880),22 negligible mobility of anions results in zero partial molar volume of cations within LLZO. In polymer electrolytes, the anions actively participate in the ion transport process. Hence, the transference number of anions in polymers is greater than zero, and results in positive magnitudes of lithium partial molar volume.22 It is evident from Eqs. 2–4 that the reaction current density at the Li/LLZO interface is affected by both lithium ion concentration and stress induced electrochemical potential.
The momentum balance equation, as shown below, has been solved at the electrolyte as well as within the lithium electrode domain to determine the mechanical equilibrium within the solids.56,57

The magnitude of mechanical stress  is directly proportional to the strain
  where the elastoplastic modulus acts as proportionality constant.56,58 The elastic moduli of lithium, bulk LLZO, and GB domain vary substantially, and their magnitudes have been estimated using the lower length calculations. The elastoplastic properties of Li metal, such as, yield strength, hardening modulus, have been obtained from existing literature.5,23,27,32,59 In the Localized Model, since estimation of the magnitude of stress is important, the momentum balance equation is solved using the finite element method (FEM).57 Also, determination of the fractional horizontal and vertical deformations of LLZO electrolyte has been conducted in modified Localized Model using FEM. Whereas, in the Generalized Model, capturing the evolution of mechanical degradation in the form of crack formation and propagation within the SSE is more important, which encouraged the usage of a lattice spring methodology (LSM) for solving the equilibrium equation.60 Please refer to earlier publications by the authors for more detailed description of the computational techniques used for estimating the mechanical equilibrium within the solid electrode and electrolyte.21
In the Generalized Model, propensity of rupture within the SSE was estimated based on the evolution of strain energy  within each of the lattice spring elements61:

where  is the local force vector and
  indicates the local displacement vector. If the local force is tensile and the magnitude of strain energy exceeds the fracture threshold of that lattice element
  it is considered broken and irreversibly removed from the network.61 For each lattice element, the fracture threshold value is separately sampled from a uniform distribution with mean
  adopted from atomistic calculations, and ranging between
  and 1.1
 60–62 If the lattice element resides within the bulk grains, the fracture threshold obtained from DFT calculations have been used
  Whereas, for lattice elements residing within the GB domain, fracture threshold energy have been assumed to be half of that observed in the bulk domains
  63
63
Results and Discussion
The combination of electrical, chemical and mechanical driving forces, current focusing, and lithium dendrite growth in LLZO SSEs has been investigated in the present study. A detailed list of the parameters used in the mesoscale computational model is provided in Table I. Some of the required parameters have been predicted from atomistic calculations (for example, lithium conductivity and elastic modulus in electrolyte), and others have been adopted from experimental literature (such as, rate dependent yield strength of Li metal).9,12,27,31 Results obtained from the atomistic simulations will be discussed first. The current focusing, and initiation of lithium dendrites, as predicted by the mesoscale model will be discussed next. Finally, the current density dependent propagation of dendrites through the LLZO electrolyte will be investigated. All the results can be broadly categorized as follows:
- 1.Parameter estimation from atomistic calculations
- 2.Current focusing and dendrite growth from the mesoscale analysis
- a.Analyzing the extent of current focusing at the grain boundaries
- b.Initiation of lithium dendrites inside LLZO
- c.Propagation of dendrite through LLZO
- d.Dependence of current density on dendrite initiation/propagation process
Table I. List of parameters used in both the Localized and Generalized Model for capturing current focusing, dendrite initiation and propagation within LLZO.
| Name of the parameter | Symbol | Unit | Value | References |
|---|---|---|---|---|
| Conductivity in lithium |

|

|

|
6 |
| Conductivity in the GI of SSE |

|

|

|
This work |
| Partial molar volume of lithium |

|

|

|
54 |
| Faraday constant |

|

|
96485 | — |
| Universal gas constant |

|

|
8.314 | — |
| Temperature |

|

|
300 | — |
| Anodic transfer coefficient |

|
— | 0.5 | 6, 52–54 |
| Cathodic transfer coefficient |

|
— | 0.5 | 6, 52–54 |
| Shear modulus of lithium metal |

|

|
3.4 | 6, 23 |
| Poisson's ratio of lithium metal |

|
— | 0.42 | 6, 23 |
| Young's modulus of solid state electrolyte |

|

|
141 | This work |
| Poisson's ratio of solid state electrolyte |

|
— | 0.2 | 64 |
| Initial yield strength for plastic deformation of lithium metal |

|

|
0.4–100 | 24, 25, 27, 28, 31, 32 |
| Hardening modulus for lithium metal |

|

|
1.93 | 5 |
| Hardening exponent for lithium metal |

|
— | 0.4 | 5 |
| Fracture threshold energy of the solid state electrolytes |

|

|
5.3 | This work |
| Thickness of solid state electrolyte |

|

|

|
Assumed |
For the mesoscale analysis, some calculations have been conducted at the localized scale (denoted as the Localized Model in this manuscript), and the obtained information (such as, current focusing at GB and fractional distortion of electrolyte) has been transferred to the Generalized Model, where the dendrite initiation and propagation have been investigated. Both the Localized and Generalized Models at mesoscale use the parameters obtained from atomistic calculations.
Parameter estimation from atomistic calculations
As an initial part of this study we investigated the seven possible surfaces of LLZO to determine which surface is most stable. Since the LLZO surface can have different terminations, we also investigated four different terminations, Li, La, Zr and O. The calculations have been carried out with the PBE functional with a plane wave basis. A summary of the results is given in Fig. 1a for 28 possible surfaces. The lowest energy surface is found to be the LLZO (100) surface with Li termination, which has a surface energy of 0.8 J m−2 (see Fig. 1a). Earlier studies have also revealed that the (100) surface of LLZO is the lowest energy surface.45 In addition, another four Li terminated surfaces [(011), (101), (110), (111)] have low energies. The zirconium (Zr) terminated surfaces are generally quite high in energy. Based on the LLZO surface studies, an interfacial supercell between Li anode and LLZO has been constructed (as shown in Fig. 1b). Please note that, to be consistent with experimental measurements of partial occupancy on the Li sublattice, we generated LLZO structures where Li ions have been quasi-randomly distributed on the 24d and 96h sites, resulting in occupancies of 0.542 and 0.448, respectively.65
To establish the atomic structure/stoichiometry of the LLZO grain boundaries (GB), Monte Carlo and molecular dynamics simulations have been conducted using LAMMPS with soft BV potentials.12,46–48 Several experimentalists reported existence of Li metal at the GB region, and attribute that to the propagation of Li dendrites.7 There may be a possibility of segregation of Li ions at the GB of as synthesized LLZO pellets,12,66 which can help in the deposition of Li ions at the LLZO GBs due to electrochemical reduction of Li.17 The structure of the grain boundaries has been used to calculate various properties such as Li ion conductivity and mechanical properties that are needed for the continuum level modeling of dendrite growth. Based on our MD and MC simulations, the lithium ion concentrations within the bulk and GB domains of LLZO are  and
and  respectively. These numbers translate into lithium ion concentrations of
  and
and  within the bulk and GB regions, respectively.
Around 1.9 million atoms have been simulated in the MD technique for mechanical property calculations. Fig. 2a shows the stress-strain curves as obtained by applying uniaxial load in the computational domain. Different numbers of atoms have been considered in the MD calculations, all of which leads to almost similar stress-strain patterns. At higher magnitudes of strain (strain > 0.1), the stress values drop due to brittle fracture of the LLZO samples.67 It is possible to estimate the Young's modulus in the bulk and GB of the LLZO solid electrolyte from the slope of the linear portion of the stress-strain curves (as shown in Fig. 2b). Figures 2b (i) and 2b (ii) depicts the stress-strain data in bulk grains obtained from two different samples and the corresponding linear fits for estimating the magnitude of Young's modulus. Similarly, Figs. 2b (iii) and 2b (iv) shows the stress-strain data obtained within the GB region along with a linear fit. By measuring the slope of these linear fits, the exact magnitude of Young's modulus has been estimated to be 141 GPa within the bulk and 120 GPa in the GB regions, which is very similar to that observed experimentally.68 It is also possible to estimate the fracture threshold energy at the bulk of LLZO by calculating the area under the stress-strain curve shown in Fig. 2a. Based on the present atomistic calculations, the fracture threshold energy of bulk LLZO is around 5.3 J m−2, which is approximately half of that observed in experiments.67 Since, the formation of a grain boundary requires some excess energy, the total energy required to create fracture within a GB region is less than that needed to form a crack in the grain-interior. Hence, the fracture energy of GB can be assumed to be smaller than the bulk.63 All these mechanical parameters for LLZO have been used in the mesoscale model for analyzing nucleation and propagation of lithium dendrites.

Figure 2. Estimation of elastic modulus from DFT and Molecular Dynamics (MD) based calculations. (a) Stress vs strain curves as predicted by the lower length scale calculations. The stress values are given in GPa units. Non-zero stress values even after fracture can be attributed to the approximations incorporated within the forcing functions. (b) Stress-strain data points and their linear fits as obtained during deformation of bulk and grain boundary (GB) regions along different directions. (i) and (ii) indicates the stress evolution within bulk along "xx" and "yy" directions, whereas, (iii) and (iv) denotes stress evolution in GB domain along "xx" and "yy" directions, respectively. Values of Young's modulus have been obtained from the slope of the linear fit to these stress-strain data.
Download figure:
Standard image High-resolution imageMD simulations have been conducted to estimate the diffusion coefficient of Li within the bulk and GB of the LLZO lattice structure. The results are shown in Fig. 3a, where the magnitudes of Li diffusivity in the bulk (black squares) and GB (red squares) of LLZO are shown with respect to temperature. The corresponding black and red solid lines indicate linear fits to the obtained data, the slope of which can be used to estimate the activation energy associated with Li transport in LLZO. It is evident that with increasing temperature, the transport of Li becomes easier within the solid electrolytes. It can also be concluded that the diffusivity of Li in bulk LLZO is larger in magnitude than the diffusivity in GB. Also, the estimated diffusion coefficients correlate very well with the calculation conducted by Yu and Siegel, which are denoted by the blue (bulk LLZO) and cyan (GB) circles.12 The conductivity of Li ions within LLZO has been estimated from the following equation:  where,
  is the ionic conductivity of LLZO,
  indicates Faraday constant,
  is the Li diffusivity in LLZO,
  denotes Li concentration,
  is the universal gas constant, and
  is temperature.52 The temperature dependent conductivity of Li ions within the bulk and GB of LLZO is shown in Fig. 3b by the black and red squares, respectively. It is obvious that with decreasing temperature, the conductivity of Li ions decrease. The blue circles indicate experimentally observed conductivities of un-doped LLZO at room temperature conditions.69 An extremely good correlation between the computational predictions and experimental observations serve as a good validation for the developed atomistic model. The exact values of LLZO conductivity at room temperature, shown in Fig. 3b, are around three orders of magnitude smaller than that of doped LLZO reported by experimentalists.13,30,39,40 Since, no dopants are used in the atomistic calculations to stabilize the cubic phase at room temperature conditions, the predicted conductivity corresponds to that of tetragonal LLZO, and correlates well with the experimentally observed conductivities of tetragonal LLZO pellets.69
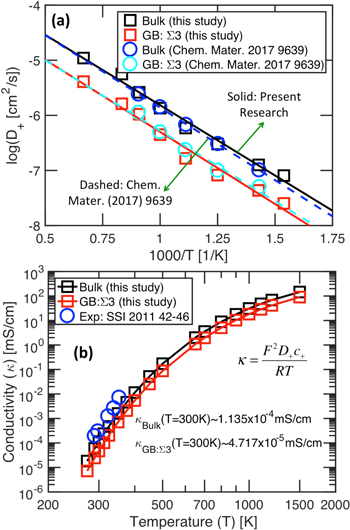
Figure 3. (a) Arrhenius type plot of lithium ion diffusivity within bulk and grain boundary (GB) domains as obtained from the atomistic calculations. The diffusivity values correlate well with that reported by Yu and Siegel (Chem. Mater. (2017) 9639–9647). (b) Variation in lithium ion conductivity with temperature at the bulk and GB regions. Conductivity is affected by both lithium ion concentration and diffusivity. Concentration of Li+ in the bulk and GB has been estimated to be 18,012.24 mol m−3 and 32,422.03 mol m−3, respectively. The blue circles indicate experimentally obtained conductivity of tetragonal-LLZO, which is observed at room temperature conditions.
Download figure:
Standard image High-resolution imageThe magnitude of exchange current density is a very important parameter required for successfully capturing the current distribution at the Li solid electrolyte interface.52,53 In the present research, the magnitude of exchange current density  at the bulk LLZO has been estimated from the charge transfer resistance
  data obtained from experimental literature,39,40,53,70 according to the equation,
  53 The exchange current density at the GB/Li interface has been obtained by scaling the bulk/LLZO exchange current density by a fraction obtained from the relative Li concentration at bulk and GB of LLZO
  22,54 Detailed estimation of the exchange current density at Li/LLZO interface is in Table II.


![$\left[{\rm{\Omega }}.{{\rm{cm}}}^{2}\right]$](https://content.cld.iop.org/journals/1945-7111/167/10/100537/revision2/jesab9b08ieqn90.gif)

![$\left[{\rm{A}}/{{\rm{m}}}^{2}\right]$](https://content.cld.iop.org/journals/1945-7111/167/10/100537/revision2/jesab9b08ieqn92.gif)

![$\left[{\rm{A}}/{{\rm{m}}}^{2}\right]$](https://content.cld.iop.org/journals/1945-7111/167/10/100537/revision2/jesab9b08ieqn94.gif)
Current focusing and dendrite growth from the mesoscale analysis
Next, using the parameters obtained from the atomistic calculations, current focusing, Li nucleation and dendrite growth through the GB region of LLZO solid electrolytes were investigated using the mesoscale model. The charge balance (shown in Eq. 1) and mechanical equilibrium (given by Eq. 5) equations are solved as part of the mesoscale analysis. A highly nonlinear Butler-Volmer equation (given by Eq. 2) has been solved at the electrode/electrolyte interface to estimate the distribution of reaction current in bulk grain and GB regions.22,54 The stress field at the Li/LLZO interface also affects the reaction current density through the mechanical stress induced electrochemical potential  term (see Eqs. 2 and 4).21 The entire mesoscale analysis has been conducted in two different length scales: i) In the lower length scale, a very small portion around the GB region has been analyzed (domain size 50 nm—100 nm), which is characterized as the Localized Model, and ii) In the higher length scale, a larger domain size (∼500 nm) has been simulated with various grain/GB microstructure with grain size ranging from 25 nm–200 nm, which is characterized as the Generalized Model. The Localized Model provides information regarding the current focusing and fractional distortion occurring at GB region, whereas, the Generalized Model informs about the time required for nucleation and propagation of Li dendrites.
Analyzing the extent of current focusing at the grain boundaries
The localized version of the mesoscale model provides information regarding the distribution of current at the Li/LLZO interface by taking into account the effect of conductivity, Li concentration and mechanical stress induced change in electrochemical potential. Figure 4a shows the schematic diagram of a LLZO microstructure (adopted from Cheng et al., ACS Appl. Mater. Interfaces (2015) 7 2073–2081),8 with a Li metal electrode. The zoomed in view of the vicinity of a GB region is shown in Fig. 4b, which has been adopted to run the Localized Model simulations. Conductivity of ions in a particular region depends on the concentration of ions as well as the energy barrier associated with ion transport within the domain.71 It is interesting to note that even though the concentration of Li ions within the GB region is larger than the bulk, the activation energy for Li transport in GB is substantially larger than the activation energy within the bulk domain.12 The combined effect leads to lower conductivity of Li ions within the GB domain as compared to the bulk (see Fig. 3). Due to lower conductivity of Li in the GB region,9,12,13 the electrical driving force tends to deposit more Li in the bulk grain interiors. However, higher Li concentration at the GB increases the propensity of Li deposition at the GB region because of its impact on the exchange current density (as pointed out in Eq. 3).12,66 Also, lower magnitudes of elastic modulus associated with GB leads to the development of smaller stress, and effectively produce smaller magnitudes of  in the GB than in bulk grain interiors
  9,21 This leads to enhanced current focusing at the GB region solely due to the inhomogeneity of stress field between bulk and GB of LLZO. Figure 4c demonstrates the current distribution at the Li/LLZO interface under an applied current density of 1 A m−2. The overall current distribution is shown by the black line, which has contributions from reduced GB conductivity, enhanced Li concentration at GB, and inhomogeneity in stress distribution at the Li/LLZO interface. The GB region has been assumed to be 10 nm thick, and resides between 20 nm and 30 nm in Fig. 4c. The current focusing observed in the GB region can be broadly divided into two components:
- i)Current focusing induced by higher Li concentration at GB
 which has been denoted by the blue dashed line in Fig. 4c.
 - ii)Current focusing induced by lower Young's modulus at GB which has been denoted by the red dash-dot line in Fig. 4c.


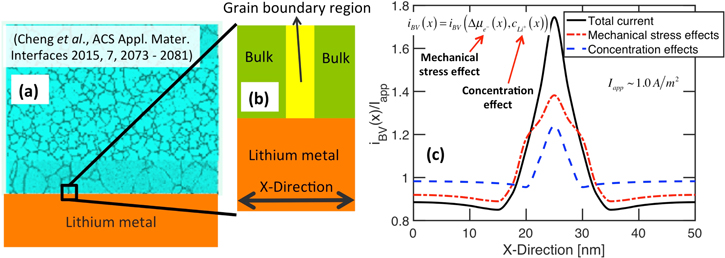
Figure 4. (a) Schematic diagram of a bulk/grain-boundary microstructure adopted from Cheng et al. (ACS Appl. Mater. Interfaces (2015) 7 2073–2081). (b) A zoomed in portion of the interface between lithium-electrode and solid-state-electrolyte (SSE), where the impact of grain boundary (GB) elastic modulus, lithium concentration and GB conductivity on the interfacial current density, have been analyzed (the Localized Model). (c) Distribution of current density along lithium/electrolyte interface as estimated by the Butler-Volmer equation. Total reaction current at the GB is larger than that observed at the bulk region due to higher exchange current density at the GBs. Contributions from enhanced lithium concentration at GB is denoted by the blue dashed line, whereas, the mechanical stress heterogeneity induced increment in reaction current at the GB has been depicted by the red dash-dot line.
Download figure:
Standard image High-resolution imageIt is worthwhile to point out that the increase in Li ion concentration at the GB region is definitely observed far away from the Li/LLZO interface. But, near the Li/LLZO interface, there exists an uncertainty regarding the increment in Li ion concentration at the GB domain, because the presence of Li metal can impact the distribution of ions. Overall, the GB region experiences higher current focusing, which is captured by the lithium concentration (denoted as  in Eq. 3) and stress induced electrochemical potential term (denoted as
  in Eq. 2). This variation in
  and
and  between the grain interior and GB of LLZO is transferred to the Generalized Model, where propensity for dendrite nucleation and growth is investigated.
Initiation of lithium dendrites inside LLZO
In the present analysis, it has been assumed that Li dendrites can only nucleate by creating a crack within LLZO at the Li/electrolyte interface.9,21 Unlike several other mechanisms, electronic conductivity through LLZO is not needed for growing Li dendrites in this particular process.16,17,20 Since the current focusing at the GB is higher than the bulk, it is assumed that initial nucleation of Li dendrite will happen by forming a crack at the GB domain.21 Also, lower fracture energy of the GB region helps to initiate crack fronts.63 A schematic diagram of the Li/electrolyte system used in this modified version of the Localized Model is shown in Fig. 5a. The strain energy required to rupture the LLZO-GB comes from the non-uniform mechanical deformation of the Li/LLZO interface during Li deposition. Due to the possibility of extreme plastic deformation of Li metal, it has been argued that under smaller operating currents (∼1 A m−2), Li should flow freely (yield strength ∼0.3 MPa) under the application of a small amount of stress, and should never accumulate substantially to cause fracture within the LLZO GBs.27 Due to its viscoplastic nature, the yield strength of Li increases with increased rate of deposition, and is supposed to demonstrate larger yield strengths (∼100 MPa) while depositing under higher current densities (∼100 A m−2).25,27 Also, the size of the propagating Li dendrites is extremely small (∼10 nm), and because of the Hall-Petch effect, can demonstrate higher yield strengths (∼100 MPa).31,32 Hence, it is obvious that depending on the rate of deposition and size of the dendritic protrusion, the yield strength of Li can vary from 0.3 MPa to 100 MPa.
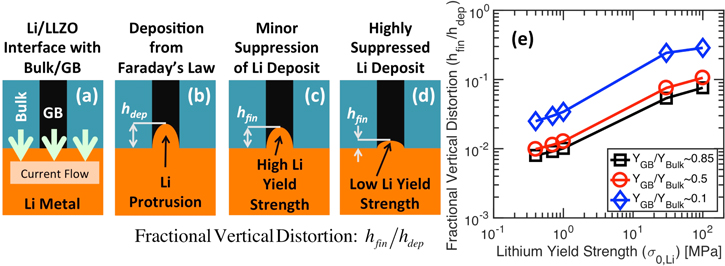
Figure 5. Analysis of the effective vertical distortion experienced by elastic-plastic lithium during deposition at an applied current density of 1 A m−2. (a) Schematic diagram of lithium (orange color) and electrolyte domain (black grain-boundary and blue bulk grain-interior) analyzed in the Localized Model. Direction of current flow is also shown. (b) Total amount of lithium deposited at the grain-boundary (GB) region due to current focusing as predicted by the Faraday's law. Before mechanical equilibrium, the height of lithium is  (c), (d) Height of lithium deposit after mechanical equilibrium, which is denoted as
  In (c) and (d), impact of high and low yield strength of Li have been demonstrated, respectively. (e) Variation in fractional vertical distortion, denoted as the ratio
  as a function of lithium yield strength. The extent of fractional vertical distortion is also affected by the elastic modulus of the GB region.
Download figure:
Standard image High-resolution imageIrrespective of the parameters, it is well understood that not all the Li that deposits at the interface result in deformation of the LLZO electrolyte. As shown in Fig. 5b, due to the current focusing at GB, according to Faraday's law the amount of Li deposited can be denoted as  However, during mechanical equilibration of Li and LLZO interface, and plastic deformation of Li metal, the equilibrated height of the deposit will be smaller (as shown in Figs. 5c and 5d), and can be denoted as
  (please note that
  ). The difference between
  and
and  depends on the yield strength of Li (see Figs. 5c and 5d). Let's define the ratio between
  and
and  as the "fractional vertical distortion" of the LLZO solid electrolyte. It is also expected that both the yield strength of Li, as well as the elastic modulus of the GB region
  will impact the magnitude of fractional vertical distortion.9,21 Accordingly, Fig. 5e demonstrates the variation of this fraction of vertical displacement experienced by LLZO with respect to Li yield strength, which has been plotted for three different magnitudes of GB elastic modulus
  It is evident that, with increasing yield strength of Li, the depositing metal becomes stronger, and can deform the electrolyte to a larger extent, effectively increasing the magnitude of fractional vertical distortion. Similarly, decreasing the elastic modulus of the GB region makes the electrolyte softer so that it can deform easily, which effectively helps to increase the magnitude of fractional vertical distortion. It is worth mentioning that the Young's modulus of Li is smaller than the Young's modulus of LLZO by an order of magnitude. Hence, even at very high yield strength of Li, even though there is no plastic deformation, the fractional vertical distortion is much smaller than unity (around 0.1 in Fig. 5e) due to the smaller magnitude of elastic modulus. Please note that, estimation of the fractional vertical distortion has been conducted prior to any fracture initiation within LLZO.
Incorporating this fractional vertical distortion into the Generalized Model, it is possible to estimate whether the depositing Li will be completely squeezed out of the GB domain, or will it accumulate and lead to fracture of the LLZO electrolyte. If the depositing Li keeps accumulating at the GB, the local strain energy density can exceed its fracture threshold, and the LLZO electrolyte can fail. Figure 6 shows the evolution of normalized strain energy density within a LLZO microstructure with grain size 197 nm and applied current density of 1 A m−2. In Fig. 6a, the yield strength of Li is 0.7 MPa, whereas, in Fig. 6b, the yield strength of Li is 100 MPa. It is evident that even for low magnitudes of Li yield strength (∼0.7 MPa), it is possible to accumulate substantial amount of Li at the GB domain, such that the local strain energy density exceeds the fracture energy threshold, and crack fronts start to evolve within LLZO. However, as shown in Fig. 6a, for low yield strength Li, around 0.7 MPa, the time taken to initiate a crack is large, approximately 4.8 h. Whereas, Fig. 6b shows that when the Li yield strength is much larger, around 100 MPa, lithium deposition for a smaller time, only 1.6 h, can lead to fracturing of LLZO. It is also worth noting that under lower yield strengths, the excess strain energy is very much concentrated (see Fig. 6a), whereas, for high yield strength Li, excess strain energies are more distributed in the LLZO SSE (see Fig. 6b). This clearly indicates that for higher yield strengths, Li dendrites can be more branched, and under lower yield limit, the dendrites will be more unidirectional.

Figure 6. Contour plot demonstrating the evolution of normalized strain energy density during Li deposition at a current density of 1 A m−2. Magnitude of normalized strain energy density has been estimated by normalizing the local strain energy density with the average fracture threshold energy  (a) Yield strength of Li metal is 0.7 MPa and Li deposited for 4.8 h. (b) Yield strength of Li metal is 100 MPa and Li deposited for 1.6 h. It is evident from (a) and (b) that, even with low yield strength of Li (∼0.7 MPa), it is possible to create cracks and propagate dendrites within the LLZO electrolyte.
Download figure:
Standard image High-resolution imageNext, using the Generalized Model, the dependence of the current focusing at GBs and lithium dendrite initiation time on the LLZO grain size is investigated. The current focusing at the GB region (induced by variation in Li concentration and stress induced electrochemical potential) and magnitudes of fractional horizontal distortion, has been extracted from the Localized Model simulations, and incorporated into the Generalized Model. The domain size used in the Generalized Model is around 500 nm, and the applied current density has been maintained at 1 A m−2. The GB elastic modulus is around 85% of the bulk  As the LLZO grain size decreases from 200 nm to 20 nm, the variation in current focusing at the GB region is shown in Fig. 7a. For grain sizes larger than 100 nm, changing the grain size has no impact on current focusing. Such sizes have been characterized as the "bulk zone." For grain sizes smaller than 100 nm, decreasing grain size helps to minimize the extent of current focusing observed at the GB region. These sizes can be denoted as the "GB affected zone." For grains with size smaller than 100 nm, the GBs are located close enough to each other, and one GB can see its neighbor from an electrochemical perspective. As the grain size decreases, the number of grain boundaries increases within a unit length of the Li/LLZO interface (2D scenario). With more GBs, the total current at the Li/LLZO interface has multiple places to get distributed, and current at each of the GBs are effectively minimized. This minimization in current focusing with decreasing grain size has already been discussed in an earlier manuscript by the authors.21 For grains with size larger than 100 nm, the GBs are located so far away from each other, that from an electrochemical standpoint they cannot see each other, and changing the grain size does not alter the current focusing by any significant amount.
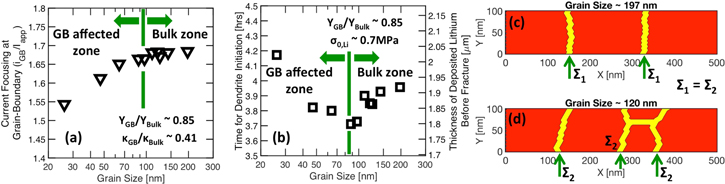
Figure 7. Impact of LLZO grain size on fracture initiation time, as predicted by the Generalized Model, under lithium deposition at a rate of 1 A m−2. (a) Current focusing at the grain-boundary (GB) with respect to grain size for  and
and  Grain sizes smaller than 100 nm is denoted as "GB affected zone," whereas, grain size larger than 100 nm falls under the "Bulk zone." (b) Change in fracture initiation time with respect to grain size. Minimum time for nucleation of dendrites observed for grains with size ∼100 nm. The two regimes around this optimum magnitude can be characterized as "GB affected zone" and "Bulk zone." (c) Schematic diagram of the bottom 100 nm domain of LLZO with grain size 197 nm, where current focusing induced load acts at two different points. (d) Schematic diagram of the bottom 100 nm domain of LLZO with grain size 120 nm, where current focusing induced load acts at three different points.
Download figure:
Standard image High-resolution imageAssuming the magnitude of Li yield strength to be around 0.7 MPa, the time required to initiate fracture within LLZO microstructures with various grain sizes have been investigated, which is shown in Fig. 7b. It has been assumed that initiation of Li dendrites is only possible through formation of fracture at the LLZO grain boundaries. Hence, fracture initiation time can be considered as a good approximation for the initiation of dendrites. In the "bulk zone," as the grain size decreases from 200 nm to 100 nm, the time required for nucleating Li dendrites at the Li/LLZO interface decreases from 4 h to 3.7 h. However, in the "GB affected zone" as the grain size is decreased even more, to 25 nm or so, time for dendrite nucleation increases to 4.2 h. The corresponding thickness of deposited Li is denoted by the axis on the right side. There exists an intermediate grain size (∼100 nm) where fracture initiation occurs the earliest. For grains with size smaller and larger than this optimum magnitude, it takes longer time to initiate fracture within the LLZO electrolyte.
Grains with size smaller than 100 nm falls under the "GB affected zone," where decreasing grain size helps to minimize the current focusing at the GB regions (as shown in Fig. 7a). Nonuniform deposition of Li at the GB region provides the driving force for crack initiation within the LLZO electrolytes. The amount of Li deposited at the GB region dictates how easily cracks can form. In the "GB affected zone," decreasing grain size helps to minimize the amount of Li deposited at the GB region. Hence, decreasing the grain size should increase the time required to nucleate dendrites within the LLZO SSE. Next, the reason behind increase in dendrite nucleation time with increasing grain size, for grains larger than 100 nm, will be discussed.
Two different LLZO microstructures have been demonstrated in Figs. 7c and 7d with average grain sizes of 197 nm and 120 nm, respectively. Both of them reside within the "bulk zone," because their grain size is larger than 100 nm. Enhanced deposition of Li at the GB region leads to application of mechanical force at the GBs. This eventually causes rupture in LLZO SSEs and dendrites can nucleate there. For LLZO grains with size larger than 100 nm, the extent of current focusing at the GB is independent of the grain size, which is evident from Fig. 7a. Let's assume that Li deposition induced point load acting at the GB of Fig. 7c is given by  (grain size ∼197 nm), and the same for Fig. 7d is given by
  (grain size ∼120 nm). Since the current focusing for grains with size larger than 100 nm is independent of the grain size, one can conclude that the Li deposition induced point load that acts at the GB region is also independent of the grain size, or
  The total load acting at the Li/LLZO interface is given by the product of the number of grain boundaries and the load at each of the GB region
  In the "bulk zone," where grain size is larger than 100 nm, LLZO microstructures with smaller grain size contain more GB regions. For example, in Fig. 7c the average grain size is 197 nm, and there exist only two GBs at the Li/LLZO interface. Whereas, in Fig. 7d, with grain size 120 nm, there are three GBs at the Li/LLZO interface. Hence, the total load experienced by the LLZO microstructure with grain size of 120 nm is around
  whereas, the total load experienced by the LLZO microstructure with grain size of 197 nm is around
  As a result, the total load experienced by the LLZO microstructure with grain size 197 nm is less than that experienced by the LLZO microstructure with grain size 120 nm. Time required to nucleate cracks should be proportional to the total amount of load acting at the Li/LLZO interface. Hence, the total time required to initiate cracks in LLZO with larger grains is higher than that required for LLZO microstructures with smaller grains.
Similar results have been reported by Sharafi et al., where they observed an increase in critical current density by increasing the grain size.30 Even though the experimental study is not same as that being reported here, delayed dendrite nucleation with increasing LLZO grain size, is consistent in both the studies. It is worthwhile to note that, the overall improvement in dendrite nucleation time obtained by increasing the grain size is not significant. It is evident from Fig. 7b, as the LLZO grain size increases from 100 nm to 200 nm, the time required for initiation of Li dendrites increases from 3.7 h to 4 h, a mere improvement of 20 min only.
Variation in dendrite initiation time with increasing Li yield strength is reported in Fig. 8a for  and average LLZO grain size of 197 nm. Since, Li metal with higher yield strength behaves as a stronger material, it can cause a larger deformation within LLZO, and that can lead to early fracture within the solid electrolyte. Hence, dendrite nucleation time decreases substantially as the lithium yield strength is increased from 0.4 MPa to 100 MPa. The right side of the y-axis indicates that for high yield strength of Li (∼100 MPa), dendrites should start to grow after deposition of only 200 nm thick Li film. On the other hand, for Li yield strength of 0.4 MPa, around 2.3 μm thick Li film can be deposited prior to nucleation of dendrites. It is also interesting to note that even for very low Li yield strengths (∼0.4 MPa), dendrite nucleation can occur in LLZO under applied current densities of 1A m−2. To understand the impact of the GB elastic modulus on the dendrite initiation time, it has been plotted in Fig. 8b with respect to the Li yield strength in a log-log scale. The GB elastic modulus has been changed between
  to
to  9 Grain size of the LLZO microstructure has been kept constant at 197 nm. As the magnitude of
  decreases, the LLZO microstructure becomes softer, and it becomes easier to deform and rupture under Li deposition induced load. Hence, the time required for dendrite nucleation with
  is much smaller than that needed for nucleating dendrites with
  By comparing the dendrite nucleation time in Figs. 7b and 8b, it is evident that the impact of lithium yield strength and GB elastic modulus is more significant than grain size in determining the structural integrity of LLZO electrolytes. Also note that, in order to keep the analysis simple and tractable using the present computational technique, Li deposition in a particular direction has been assumed in all these simulations. If deposition in the reverse direction is also taken into account, it should lead to more complex phenomena, such as, nonuniform dissolution, formation of dead Li, etc, which is out of the scope of the developed computational methodology.
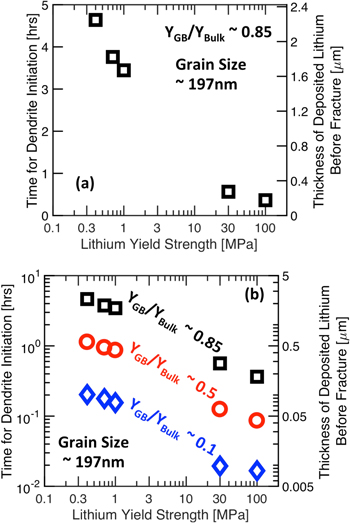
Figure 8. Impact of lithium yield strength and grain-boundary (GB) elastic modulus on fracture initiation time as predicted by the Generalized Model under lithium deposition at 1 A m−2. (a) Dendrite initiation time with respect to the lithium yield strength for YGB ∼0.85YBulk and LLZO grain size of 197 nm. The right side of the y-axis denotes the total amount of lithium deposited prior to initiation of dendrites (d) Variation in dendrite initiation time with respect to lithium yield strength plotted in log-log scale for three different values of GB elastic modulus. Thicknesses of Li that can be deposited prior to fracture have been denoted by the right axis.
Download figure:
Standard image High-resolution imagePropagation of dendrite through LLZO
After nucleation of Li at the GB region, dendrites grow to short the cell. It is well accepted that growth of Li dendrites occurs mostly through the GB regions.7,8,30 Growth of Li dendrite through the GB region should involve deposition of Li at the fractured GB, and making the crack front propagate, until the growing dendrite shorts the cell. Under elastic deformation of Li, it has been demonstrated by researchers that Li dendrite within a cracked region prefers to propagate by increasing the crack length, rather than getting extruded from the crack opening.29 However, it has been argued by other researchers that under externally applied loads due to plastic deformation of Li, metal deposited at the GB cracks should flow out without causing any accumulation or further rupture of the solid electrolyte.27 In order to reconcile the extent of deformation experienced by LLZO due to Li deposition in a cracked region, fractional horizontal distortion of the electrolyte has been analyzed for different yield strengths of Li metal.
Figure 9a schematically demonstrates an updated version of the Localized Model where the bulk and GB region of an electrolyte is shown by blue and black domains, respectively. In the same figure, a thin crack has been assumed in the middle of the GB region, which is denoted by white color. The total amount of Li deposit at the cracked region, as predicted by the Faraday's Law, is shown in Fig. 9b (Li denoted by orange color). Prior to mechanical stress equilibrium, the thickness of the Li deposit is denoted as  (see Fig. 9b). After mechanical equilibrium, because of the very high modulus of LLZO and plastic deformation of Li, the deposited metal experiences a decrease in thickness, and some amount of Li is squeezed out of the crack region. This is schematically shown in Figs. 9c and 9d, for high and low yield strength of Li metal, respectively. The final thickness of the Li deposit is denoted as
  where
where  The ratio between
  and
and  is denoted as the fractional horizontal distortion, and this parameter indicates the extent of horizontal deformation experienced by LLZO during Li deposition at a cracked region. Figure 9e demonstrates how the fractional horizontal distortion changes with Li yield strength. Li metal with higher yield limit behaves as a stronger material and can deform the LLZO electrolyte to a larger extent, which results in higher magnitudes of fractional horizontal distortion. As the elastic modulus of the LLZO GB domain decreases, deformation of the solid electrolyte becomes easier, resulting in larger magnitudes of fractional horizontal distortion (also demonstrated in Fig. 9e). The magenta line with triangular symbols in Fig. 9e is for
  which indicates the Li deposition induced fractional horizontal distortion experienced by crack openings that exist in the bulk grain interior. It is worth mentioning that for extremely high yield strength of Li, the metal should deform elastically, and fractional horizontal distortion should saturate to a certain magnitude. This trend is supposed to be similar to that observed in Fig. 5e, observed in very high yield strength Li. However, the magnitude of fractional vertical distortion in Fig. 5e is much smaller than the magnitude of fractional horizontal distortion observed in Fig. 9e. This difference can be attributed to the type of deformation reported in Fig. 5e, where the LLZO did not have any cracks, whereas, in Fig. 9e, the GB of LLZO already contains a crack. Presence of a pre-existing crack front makes the LLZO GB behave like a much softer material. Please note that, during this analysis, no propagation of the existing crack front at LLZO GB has been taken into consideration.
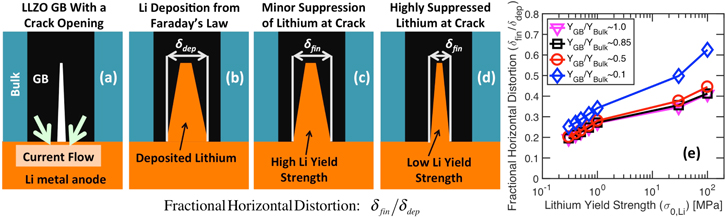
Figure 9. Analysis of the horizontal deformation of LLZO solid electrolytes during lithium deposition at a vertically cracked region. (a) Schematic diagram of a solid electrolyte with blue grain interior (or bulk) and black grain boundary (GB) region. A vertical crack has been artificially induced at the bottom portion of the GB. (b) Amount of Li deposition (denoted by orange color) within the cracked domain according to the Faraday's Law. Before mechanical equilibrium, the thickness of lithium deposit is given by  (c), (d) Schematic diagram of the lithium deposit after mechanical equilibration with the surrounding LLZO electrolyte. The final thickness of lithium within the crack is denoted as
  The deformed state for high and low yield strength of Li has been denoted in (c) and (d), respectively. (e) Fractional horizontal distortion of LLZO, defined as
  has been plotted with respect to the lithium yield strength. Impact of GB elastic modulus on the fractional horizontal distortion is also studied.
Download figure:
Standard image High-resolution imageTransferring the magnitude of fractional horizontal distortion from the Localized Model into the Generalized one, crack propagation, and subsequently Li dendrite growth, through LLZO electrolyte has been analyzed. Figures 10a and 10b demonstrate the crack path, and hence Li dendrite, through the LLZO electrolyte for Li yield strength of 0.7 MPa and 100 MPa, respectively. The grain size of the LLZO microstructure is 88 nm, GB elastic modulus is 85% of bulk  and dendrite propagation has been demonstrated under applied current density of 1 A m−2. It is evident that the majority of the cracks reside within the GB domain, which can be attributed to the smaller fracture energy density of GB considered in the present study. However, growth of Li dendrite through GB is consistent with other experimental observations, where the cross section of shorted LLZO reveals propagation of Li dendrites only within the GB region.7–9,17 It is also clear from Figures 10a and 10b that Li nucleates at almost all the GBs, but only a few of them propagate due to the statistical nature of the fracture energy threshold. Under both low and high yield strengths of Li, the dendrites take almost the same pathway, which can be attributed to the distribution of grains and their orientation within the LLZO microstructure. However, at high yield strengths of Li, as shown in Fig. 10b, the unsuccessful dendrites (see the GBs located around 150 nm, 250 nm and 350 nm along the x-direction) within the GB region tend to grow larger. Also, note that under low yield strength of Li, shown in Fig. 10a, a particular crack front, around 400 nm along the x-axis, tries to penetrate through the bulk grains, but fails to propagate further due to larger load requirements for growing cracks within the grains. Such attempts of propagation through the bulk grain interior have not been observed at higher Li yield strengths (see Fig. 10b). Figure 10c shows the fraction of broken elements that reside within the GB (denoted by red circles) and bulk (depicted by black squares) of LLZO electrolyte. Dendrite propagation through various LLZO microstructures with grain size ranging between 25 nm to 200 nm has been analyzed here. It is evident that, irrespective of grain size majority of the Li dendrite reside within the GB region because of its lower fracture energy density. For grain sizes larger than 100 nm, enhanced cracking within the bulk grains have been observed, which can be attributed to GBs residing extremely far away from each other and minor cracking within the bulk grains. These dendrites through the grain-interior eventually fail to propagate, as shown in Fig. 10a around 400 nm along x-axis.

Figure 10. Dendrite growth through the bulk/grain-boundary microstructure of LLZO solid electrolytes has been demonstrated here. The applied current density is 1 A m−2, and  (a) Formation of mechanical cracks (black dots) and growth of dendritic protrusion (green dots) through the bulk/grain-boundary (B/GB) microstructure. Here red indicates grain-interior and yellow denotes grain-boundary domains. The average grain size is around 88 nm. The simulation has been stopped as soon as a continuous lithium dendrite forms from bottom to top. The yield strength of depositing Li is 0.7 MPa. (b) Propagation of Li dendrite through the same LLZO microstructure, but Li yield strength 100 MPa. (c) Comparison between the fraction of broken elements at the bulk and GB region, denoted by black squares and red circles, respectively, with respect to grain size. This data has been obtained by averaging over all the Li yield strengths.
Download figure:
Standard image High-resolution imageThe dynamics of dendrite propagation through the LLZO electrolyte have been analyzed in Fig. 11. The increase in height of Li dendrite within LLZO with respect to time is shown in Fig. 11a (indicated by the solid black line) during Li deposition at 1 A m−2. A LLZO microstructure with grain size around 197 nm is used here, along with Li yield strength of 0.7 MPa and  Nucleation of Li dendrites takes long time, around 4.5 h, but it propagates very fast, and can effectively short the cell within 60 min. The red squares denote instantaneous velocity of dendrite growth, which can be as large as 2 nm s−1 at certain times. However, the average velocity of dendrite growth is much smaller. This discontinuous growth indicates that, propagation of Li dendrites through LLZO is not a gradual process, but occurs through bursts of fracture events within the brittle solid electrolyte. During this propagation of Li dendrite, variation in electrochemically active surface area and potential drop across the solid electrolyte has been shown in Fig. 11b by the magenta and blue lines, respectively. As the Li dendrite propagates, the electrochemically active surface area increases, which helps to reduce the activation overpotential, and the total potential drop across the LLZO electrolyte decreases. In Fig. 11b, the sudden decrease in electrochemically active surface area (magenta line) around 5 h can be attributed to isolation of electrolyte domain due to fracture though the GB. This kind of decrease in potential drop with propagating dendrite has also been observed by experimentalists during Li deposition with point electrodes.29
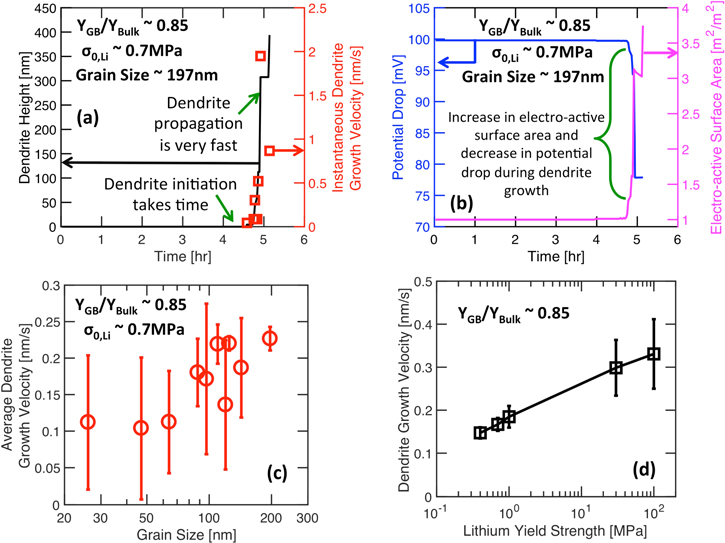
Figure 11. Analysis of dendrite growth through LLZO solid electrolytes during lithium deposition at a rate of 1 A m−2. (a) Height of the propagating lithium dendrite with time of deposition. Initiation of lithium dendrite takes long, but it can penetrate through the electrolyte very quickly. The red squares denote the instantaneous velocity of lithium dendrite growth. (b) During Li deposition, time dependent potential drop across the electrolyte denoted by the blue line and left y-axis. At the same time, increase in electrochemically active surface area has been indicated by the magenta line and the right y-axis. (c) Dendrite growth velocity with respect to grain size for YGB ∼0.85YBulk and lithium yield strength of 0.7 MPa. Here, dendrite growth time has been determined by subtracting the "dendrite initiation time" from the "simulation end time." (d) Dendrite growth velocity with respect to Li yield strength for 
Download figure:
Standard image High-resolution imageThe average velocity of growing Li dendrites have been estimated and plotted with respect to grain size in Fig. 11c. The Young's modulus in the GB has been assumed to be 85% of the bulk, whereas Li yield strength is 0.7 MPa. The applied current density is maintained at 1 A m−2. The average velocity of dendrite growth is defined as:
This definition makes the average velocity independent of the effect of variation in dendrite initiation time (which is similar to fracture initiation time) with different grain sizes (as shown in Fig. 8a). It is evident from Fig. 11c that the average dendrite growth velocity decreases with decreasing grain size. Growth velocity observed in LLZO microstructures with 50 nm grains is almost half of that observed in LLZO with 200 nm grains. This decrease can be attributed to an enhanced amount of GBs and a more tortuous pathway taken by the propagating dendrites inside LLZO microstructures with smaller grain sizes. The errorbars are obtained by averaging over five samples for each of the data points. However, the large standard deviation observed at smaller grain sizes indicates that the decrease in dendrite growth velocity for smaller grains is not significant. Variation in dendrite growth velocity with Li yield strength is shown in Fig. 11d for  Li metal with a higher yield limit behaves as a stronger material, and can result in much faster growth of the dendrite through LLZO. The error-bars at each value of Li yield strength have been obtained by averaging over all the grain sizes. As shown in Fig. 11c, changing the grain size can alter the dendrite growth velocity from 0.1 nms−1 to 0.25 nms−1, whereas, according to Fig. 11d, changing yield strength can vary the dendrite growth velocity from 0.1 nms−1 to 0.4 nms−1. Hence, Li yield strength has a slightly more prominent effect on determining the dendrite growth velocity than grain size.
Dependence of current density on dendrite initiation/propagation process
It has been observed in various experiments that increasing the current density leads to early nucleation of dendrites and eventually a short circuit of the cell.8,30 Since, GBs have lower ionic conductivity than the bulk, at higher current densities more Li should pass through the grain-interiors than the GB regions. This cannot explain the early appearance of a Li dendrite through the GB under higher current densities. In the present study, the authors argue that being a viscoplastic solid; Li demonstrates higher yield strength during operation at higher current densities. During Li deposition at 1 A m−2 and 10 A m−2, the Li yield strength can be assumed to be around 0.7 MPa and 1 MPa, respectively.27 The Young's modulus of GB has been assumed to be 85% of the bulk domain. Taking into consideration these parameters, the predicted height of Li dendrite within an LLZO microstructure of grain size 197 nm is shown in Fig. 12a. Li deposition at two different current densities are considered here, 1 A m−2 and 10 A m−2, which are denoted by the solid and dash-dot lines, respectively. Irrespective of applied current density, dendrite growth is a much faster process than dendrite initiation. It is also evident from Fig. 12a that, given enough time for lithium deposition, it is possible to grow dendrites through LLZO even at low current densities of 1 A m−2. Hence, there should not exist any critical current density for LLZO SSEs, and whether short circuit should occur or not, depends on a combination of applied current density and the total amount of Coulombs passed through the LLZO SSE.

Figure 12. Impact of current density on Li dendrite growth through LLZO is investigated here. (a) Height of Li dendrite is plotted with respect to Li deposition time, for two different current densities of 1 A m−2 and 10 A m−2. Due to viscoplastic deformation of Li, deposition at higher rate leads to higher yield strength of Li metal. (b) Time to short circuit has been plotted with respect to applied current density. The solid blue line indicates a stability limit, below which dendrites should not short the cell, whereas, above the line short-circuit should be observed. The thickness of Li deposition prior to shorting is denoted by the numbers given in the red colored parenthesis.
Download figure:
Standard image High-resolution imageThe average time for short circuit is shown in Fig. 12b by the black squares. The time for short circuit can be considered as the summation of dendrite initiation time and dendrite propagation time. In these simulations  has been maintained. The errorbars are obtained by averaging over all the different grain sizes that ranges approximately between 25 nm to 200 nm. Due to viscoplasticity of Li, the yield strength of Li has been assumed to vary according to the applied current density.25,27,28 It is evident that at higher current densities, it takes smaller time to nucleate and propagate Li dendrites, which is consistent with various experimental observations.8,30,70 The solid blue line indicates a stability limit, below which safe deposition of Li is possible, whereas, operating conditions that reside above the blue line should lead to dendrite growth and short circuit of the cell. In Fig. 12b, the numbers in red parenthesis gives the total thickness of Li deposited prior to shorting. Note that, before initiation of dendrites, more lithium can be passed during operation at higher current densities. This trend is counterintuitive, and can be attributed to the lower conductivity of GB than bulk LLZO
  During operation at higher current densities, the transport limitation become dominant, and the magnitude of current focusing at the GB region starts to diminish (similar trends were also reported by the authors in an earlier publication21). Hence, at higher current densities, total amount of Li deposition at GB with respect to the entire electrode is relatively less than that observed at lower current densities
  which leads to more Li deposition at high current before short circuit. Along the same direction, at higher currents, the total amount of Li deposited is more than that at lower currents
  which results in earlier short circuit of the cells under high current operation, as reported in Figs. 12a and 12b. This analysis clearly indicates that only the short circuit time is not a definitive descriptor of the interfacial stability between Li and LLZO. The amount of charge passed must also be reported to successfully determine the stability of a solid electrolyte against Li metal anode. These results also conclude that there does not exist any critical current density for LLZO electrolytes. Shorting of a cell due to lithium dendrite growth depends on a combination of applied current density and the Coulombs passed through the electrolyte.
Conclusion
In the present article, for the first time, the authors demonstrated a multiscale model capable of capturing the growth of lithium dendrites through LLZO solid electrolytes. Several parameters, such as elastic modulus and Li conductivity within LLZO bulk grain interior and GB region have been obtained from atomistic simulations. Some of the estimated parameters, that has been measured experimentally, correlate very well with experimental observations.67–69 Other parameters applicable in the GB region cannot be measured, and must be estimated from atomistic calculations. Importing this information into the mesoscale model, dendrite initiation time and growth velocity have been predicted. Higher current density is observed at the grain-boundary region due to higher Li concentration, and lower GB elastic modulus, as compared to the bulk grain-interior. Plastic deformation of Li will delay the initiation of Li dendrites at the GB region.26,27 The yield strength of Li has a much higher impact in determining the dendrite initiation time and growth velocity compared to grain size of the LLZO microstructure. Due to the viscoplastic deformation of Li, at higher current densities it behaves as a stronger material with larger yield strength.25,27,28 Hence, the failure of LLZO observed at higher current densities (>0.5 A m−2)8,30,70 can potentially be attributed to the lack of plastic deformation experienced by Li. Also, size of Li dendrites are extremely small, in the range of few nanometers, where the elastic plastic deformation of Li can be very different from that observed within bulk Li.31,32 The following aspects realized from the present research are worth discussing:
- 1.Recently, several experimental and computational studies pointed out that electron conducts through LLZO, and that causes the formation and growth of Li dendrites.16,20 The present model does not assume any conduction of electron through LLZO. Initiation and propagation of dendrites occur through the GB region, and the electrons required for depositing more Li at the tip of the dendrite arrive directly from the Li metal anode through the dendritic protrusion.
- 2.Even though there have been several attempts of defining critical current densities within LLZO solid state electrolytes,16,19 results obtained from the present modeling efforts clearly indicate that dendrite growth is possible in LLZO even under very low applied current densities (∼1 A m−2). Due to plastic and creep deformation of Li, during deposition at lower rates, more Coulombs need to be passed for shorting the cell. It can also be concluded from the present study that there does not exist any critical current density within LLZO solid electrolytes.
- 3.Since, Li metal demonstrates substantial viscoplastic and creep deformation even at room temperature conditions, the yield strength of Li has more pronounced effect in determining the dendrite initiation and propagation time, as compared to the grain/GB microstructure of the LLZO solid electrolyte (compare Figs. 7 and 8). Also, it can be concluded from Figs. 11a and 12a that dendrite initiation takes much longer than the propagation process.
- 4.In the Generalized Model, current focusing in GB has been investigated for grains of size as small as 25 nm. Even at such small sized grains, the current in the GB domain is 55% larger than that observed at the bulk (see Fig. 7a). For even smaller grain sizes, current focusing in GB domain, as observed in the Localized Model, has been discussed in Appendix B and Fig. B·1. The sizes of grains have been assumed to range between 5 nm and 30 nm. Figs. B·1a and B·1b shows the mesh diagram of LLZO bulk/GB microstructure with grain size 10 nm and 30 nm respectively. Figure B·1c demonstrates the decrease in current focusing at the GB region with decreasing grain size. The applied current density is assumed to be 1 A m−2. This trend clearly shows that in LLZO microstructure with extremely small grains, no current focusing and dendrite growth at the GB region should occur. In other words, amorphous solid electrolytes without any GB microstructure should be able to prevent current focusing and dendrite growth.
Acknowledgments
This research is supported by the Vehicle Technologies Office (VTO), Department of Energy (DOE), USA, through the Battery Materials Research (BMR) program. Argonne National Laboratory is operated for DOE Office of Science by Chicago Argonne, LLC under the contract number DE-AC02-06CH11357. Lawrence Berkeley National Laboratory is managed for DOE Office of Science by University of California under contract number DE-AC02-05CH11231. The authors gratefully acknowledge the computing resources provided on Bebop, a high-performance computing cluster operated by the Laboratory Computing Resource Center at Argonne National Laboratory. The authors would also like to thank Dr. Seungho Yu and Dr. Donald Siegel for valuable discussions during the development of the atomistic computational model.
Appendix A
The energy landscape along the reaction coordinate at the Li/LLZO and Li/GB interface has been demonstrated in Figs. A·1a and A·1b, respectively. The energy barrier at the Li metal side and LLZO electrolytes side is shown in the left and right side, respectively, of the diagram. Since Li deposition is being simulated here, Li-ions are supposed to move from LLZO electrolyte to the Li metal. Without any mechanical stress induced electrochemical potential difference, under open circuit conditions the energy barrier on both sides of the reaction coordinate look symmetric. Under positive magnitude of mechanical stress induced electrochemical potential  the energy landscape associated with anodic reaction moves upward. Since,
  the upward movement of the energy landscape in the GB is less than that observed in the bulk LLZO (compare the dash-dot line in Figs. A·1a and A·1b). Since, Li deposition is the main purpose of the electrochemical reaction, cathodic overpotential is applied, which will shift the energy landscape of the LLZO side upward. This has been accomplished by moving the energy landscape of the Li downward, and the final energy profile in the Li metal side is given by the red line (see Figs. A·1a and A·1b). Since the same amount of external potential is applied at the GB and bulk LLZO, the thermodynamic energy difference between Li metal and LLZO at the GB is larger than that observed at the bulk LLZO. Hence, the current density that acts at the GB region has a larger magnitude than the current density at bulk grain interior.
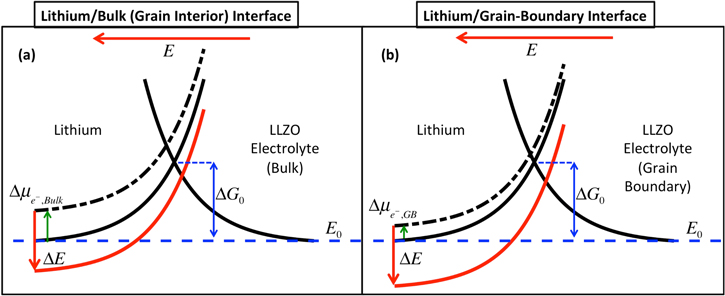
Figure A·1. Demonstration of energy barrier along the reaction coordinate. The left side is lithium (Li) metal and the right side indicates LLZO solid electrolyte. The influence of mechanical stress induced electrochemical potential  has been demonstrated by the black dash-dot line. The red line demonstrates the energy barrier after the application of external potential field.
  indicates the initial activation energy barrier. (a) Energy profile as observed at the Li/Grain-Interior (or Bulk) interface. (b) Energy profile as observed at the Li/Grain-Boundary interface. Comparing Figs. A·1a and A·1b, it is evident that the thermodynamic driving force for Li reduction at the grain-boundary region is larger than that observed at the bulk grain-interiors.
Download figure:
Standard image High-resolution imageAppendix B
In the present research, the Localized Model provided information regarding the current focusing at the GB region, which has been carried over to the Generalized Model, where the dendrite initiation and propagation times have been evaluated. The Localized Model shown in Fig. 4 assumed that the grain size is substantially larger than the GB thickness, such that one can possibly focus at a small portion where only GB, Li metal electrode and bulk LLZO exists. However, for grain sizes smaller than 30 nm, it is possible to have interaction between adjacent GB domains even at the level of Localized Model. Fig. B·1 attempts to resolve the impact of adjacent GBs on the total GB current focusing observed at the Localized Model. The mesh diagram of Li/LLZO microstructures with grain size 10 nm and 30 nm has been demonstrated in Figs. B·1a and B·1b, respectively. The current focusing observed at the GB region with decreasing grain size is demonstrated in Fig. B·1c. It is evident that with decreasing grain size, the current focusing at GB region decreases. However, to obtain zero current focusing at GB region, it is necessary to move to very small grain size, in the range of 5 nm. Even at grain size 10 nm, which is equivalent to the GB thickness itself, there still exists around 20% current focusing at the GB region. Please note that heterogeneity in both elastic modulus  and Li concentration
  contributes to this current focusing observed at the LLZO GB region.

Figure B·1. Impact of extremely small grain size on current focusing has been analyzed, where the diameter of the grains ranges between 5 nm to 30 nm. (a) Demonstration of the lithium (Li) and solid state electrolyte (SSE) mesh with grain size of 10 nm. (b) Demonstration of the Li and SSE mesh with grain size of 30 nm. The lithium metal is shown in blue, grains are denoted by black and the grain boundaries (GBs) are red in color. The GB thickness is 10 nm. (c) Ratio of reaction current at GB over applied current has been plotted with respect to the grain size, which clearly demonstrates that current focusing at GB decreases substantially as the grain size becomes smaller. The present analysis has been conducted at applied current density of 1 A m−2.
Download figure:
Standard image High-resolution image