
Abstract
Stable long-term cycling and solid-electrolyte-interphase (SEI) formation are key challenges in the design of Si/graphite composites as Li-ion battery (LIB) anode materials. Typically, these long-term cycling properties are examined in flooded half-cell settings making use of a Li-metal counter electrode and a Si/graphite working electrode. This form factor has the advantage of offering an unlimited supply of Li-ions and electrolyte, thus isolating performance degradation to the passivation of the working electrode. However, half-cell studies are ineffective in revealing performance and degradation mechanisms of the Si/graphite composite in a more commercially realistic full cell setting. This paper outlines an operando acoustic technique that can offer insights on SEI formation and capacity degradation of Si/graphite composites in a full cell setting. Through a combination of electrochemical and chemical analyses, we show that increasing passivation of the silicon particles in the Si/graphite composite anode is correlated with an increase in the acoustic time-of-flight shift. We further show that temporary loss of the acoustic signal during the first cycle is associated with significant gassing of the cell. The operando acoustic technique outlined here is low-cost, simple to setup and has the potential for localized resolution, indicating usefulness in commercial-scale Si/graphite cell quality control and diagnosis.
Export citation and abstract BibTeX RIS

This is an open access article distributed under the terms of the Creative Commons Attribution 4.0 License (CC BY, http://creativecommons.org/licenses/by/4.0/), which permits unrestricted reuse of the work in any medium, provided the original work is properly cited.
Lithium-ion batteries (LIB) containing graphite anodes are the most widely used power sources for portable electronic devices and electrical vehicles (EVs).1–3 While this has been transformative in its own right, the graphite anode used in traditional LIBs still lacks the energy density to match that of gasoline powered cars, and as such has spurred much research activity to develop a new generation of high energy density anode materials.2,4,5
Of the various materials touted as improvements over graphite anodes, silicon has been one of the most attractive due to its theoretical capacity of 4200 mAh g−1, which is over 10 times that of graphite (372 mAh g−1). However, such a battery is not yet ready for commercial use because of its poor cyclability: silicon nanoparticles undergo massive volume change up to 300% during Li insertion and extraction, leading to mechanical instabilities, continuous formation of the solid-electrolyte-interphase (SEI), and Li-inventory depletion—all of which contribute to poor cycle life.6–8
To date, numerous attempts have been reported to mitigate the mechanical stresses induced by the volume expansion of silicon during lithiation, such as the use of carbon encapsulated silicon particles,9–12 graphite/silicon mixtures,13–16 and improved binder selection.7,17,18 Yet all of these materials still face challenges before commercial implementation either in performance or in cost. If the cost of synthesis of the Si-based material is very high, a breakthrough to the mainstream battery market will be difficult.19,20
This puts a premium on developing and optimizing low-cost silicon anode solutions. Moreover, these anodes must be validated in full cell settings, as opposed to Li-metal half-cells, which are de rigueur in the battery materials discovery sphere. This also poses an additional challenge, as full cells introduce more variables, such as the quality of the cathode, the assembly process, electrode balancing and subsequently a limited supply of Li for cycling, which make it more difficult to ascertain the failure mechanisms in the cell.
As such, it is of paramount importance to develop an effective and widely accessible operando characterization system. This would enable a "materials-by-design" approach to optimize electrochemical performance of the anode, and to monitor long-term cycling in order to deconvolute competing fading mechanisms in a full cell setting.
Insights on cycling behavior of Si/graphite (SiGr) composites can be conventionally obtained through either in situ or ex situ measurements. In situ measurements have included optical microscopy,21–24 atomic force microscopy,25 neutron reflectometry,26 X-ray reflectivity (XRR),27 X-ray tomography,,28,29 nuclear magnetic resonance (NMR) spectroscopy,30 and digital image correlation.31 However, such electrochemical characterization methods typically require expensive equipment and customized setups. Ex situ characterization methods are more accessible, but are destructive and only offer post mortem insights. They also face the pernicious challenge of O2/H2O exposure during cell disassembly and material transfer.32,33
Lastly, electrochemical methods to track cell degradation can be useful, but cannot distinguish between local and global failure mechanisms—as the voltage used for analysis is representative of the whole cell. While this is not an issue for small cells, it becomes much more prescient for cells of larger length scales, especially if there are discrepancies in the calendaring, electrolyte wetting, and pressure stacking of the electrodes.
Recent work by Dahn et al. suggested that an operando volume tracking34 and pressure change detection method35 can produce real-time novel results for the characterization of full cell silicon anode cycling. However, both volume and pressure tracking face some difficulty in separating gassing effects from volume changes.
This study demonstrates the use of a low-cost, reliable and non-destructive operando technique using electrochemical-acoustic (EA) analysis,36–38 in order to gain physical insights into NMC/SiGr composite pouch cells. We demonstrate that EA analysis can be used to gain valuable insights into the nature of SEI formation in SiGr composite materials, and the effects on gassing, rate performance and long-term cycling.
Experimental Methods
Electrode and pouch cell fabrication
Pouch cells containing as-coated LiNi0.5Mn0.3Co0.2O2 (NMC532) and SiGr electrodes were assembled. The NMC532 and SiGr electrodes were fabricated at the U.S. Department of Energy Battery Manufacturing Research and Development Facility at Oak Ridge National Laboratory. Detailed cell information is listed in Table I. Detailed description on electrode fabrication has been reported in the literature.39,40 Li substituted polyacrylic acid (LiPAA) was produced by LiOH neutralization of polyacrylic acid (PAA, Sigma-Aldrich, MW = 450,000). Pouch cells were filled with electrolyte to 3 times the total pore volume of the pouch cells (including cathode, anode and separator pores) to ensure enough total electrolyte.41 All electrodes were dried at 120 °C in a vacuum oven, and electrodes were handled in a dry room (<0.3% relative humidity) or Ar purged glove box (Vigor Scilab) to minimize moisture exposure.40 The cells were tab charged at C/10 for 10 min before being sent to Princeton University for testing. The nominal capacity of the cells is 510 mAh.
Table I. Pouch cell properties.
| Composition | Loading, dimensions, porosity | |
|---|---|---|
| Anode | 53 wt% graphite (Hitachi, MagE 3), | 2.1 mg cm−2, |
| 30wt% silicon (Nanoamor, 70–130 nm), | ||
| 2 wt% carbon black (Imerys, C45), | 86.4 mm × 58 mm × 31 μm, | |
| 15 wt% LiPAA (Sigma-Aldrich, MW = 450,000) | 40% | |
| Cathode | 90 wt% NMC532 (Toda America), | 12.5 mg cm−2, |
| 5 wt% carbon black (Denko), | ||
| 5 wt% 5130 polyvinylidene fluoride (PVDF, Solvay) | 84.4 mm × 56 mm × 63 μm, | |
| 50% | ||
| Separator | Celgard 2325 | 89 mm × 61 mm × 25 μm |
| Electrolyte | 1.2 M LiPF6 in ethylene carbonate: ethyl methyl carbonate (3:7 wt%, Tomiyama's High Purity Chemicals) plus 10 wt% fluorinated ethylene carbonate (FEC, BASF) |
Electrochemical-acoustic analysis
EA analysis is done by applying an ultrasonic pulse to the pouch cell and listening to the echoing behavior with surface transducers. The shape of the resulting ultrasonic waveform is dependent on the material properties along its acoustic path, which is the portion of the cell between the transducers. An accurate real-time detection of physical dynamics is possible because each reading takes <1 ms. An Epoch 600 ultrasonic pulser-receiver and custom-built multiplexers, both controlled with in-house Python software, were used to pulse and take data across multiple cells in turn. Ultrasonic pulses were transmitted through the cells using Olympus 2.25 MHz transducers, one for transmit, one for receive for the 3-layer cells. Transducers were mounted in a custom transducer/cell holder, with a thin film of SONO 600 ultrasonic gel couplant applied at each transducer-cell interface to provide a clean and strong signal. The received signals were amplified with a gain of 35 dB and data collected over the range of 0–12 μs for all cells. The schematic of the experimental setup is shown in Figs. 1a and 1b.
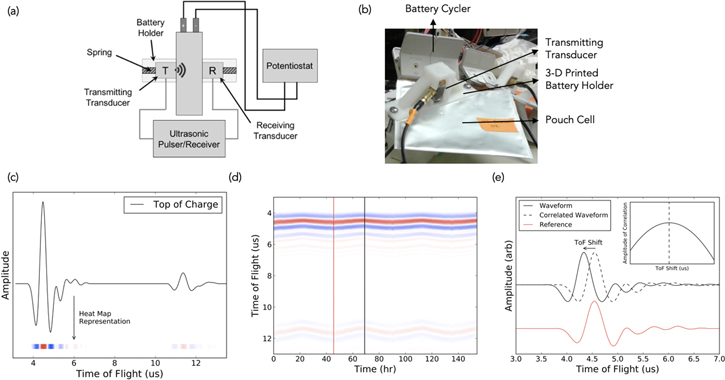
Figure 1. (a) Schematic of a pouch cell side view with ultrasound transducers for EA analysis. (b) Lab-scale setup. The NMC/SiGr pouch cell is held in place by 3D-printed cell holders and the receiving and transmitting transducers are connected on either side. The second transducer is not visible as it is on the other side. In the experiments demonstrated in this paper, the cells also had a second pair of transducers to probe for spatial differences located on the other end of the cell (the one shown in the image is located near the tabs). (c) Sample waveform at the top of charge, which is collated onto a (d) heatmap to plot the time-of-flight (ToF). The heatmap represents the change in the entire waveform over time, with red representing high intensity and blue low intensity. The red and black vertical lines represent a reference and subsequent waveform used for cross-correlation, depicted in (e), where the cross-correlation algorithm allows for calculation of the ToF shift. Mathematically, this amounts to multiplying and summing two time series together (the current waveform and the initial reference waveform) to calculate their level of correlation, where the time shift is determined by the point of maximum correlation. Practically, ToF shift estimates how much the waveform has shifted (in μs). Greater changes in the medium would result in larger magnitudes in the ToF shift.
Download figure:
Standard image High-resolution imageThe key measurement obtained from acoustic data is the acoustic time-of-flight (ToF). ToF is described by Eq. 1, where L is the path length traveled, E is the elastic modulus, and ρ is the density of the material. The square root of E/ρ is the speed of sound, Cs, through a given medium.

From the ToF, we can derive the two key metrics that are used in the acoustic analysis: time-of-flight shift (ToF Shift) and Total Amplitude. ToF Shift is the time shift (in μs) required to find the closest match of the acoustic signal waveform at a given state of charge (SOC) to a reference waveform, which in this case, is calculated with a cross-correlation function. Figure 1c depicts a sample waveform through a battery. The relative intensities of the waveform are then collated onto a heatmap, to show how the entire waveform shifts over time. This is the ToF, as depicted in Fig. 1d. The ToF shift algorithm then takes each subsequent ToF, implements a cross-correlation algorithm with the initial waveform, in order to obtain the ToF shift, which represents how much the waveform has shifted (Fig. 1e). In other words, a more drastic shift due to a more substantial physical change in the medium will result in a larger magnitude of the ToF shift. The Total Amplitude is determined by integrating the absolute value of the signal amplitude over the full waveform. In the context of this paper, the reference waveform utilized will be the acoustic signal obtained at the beginning of charge, also referred to as bottom-of-charge (BOC), of the initial cycle.
Electrochemical specifics
Concurrently with the ultrasonic measurements, cells were cycled at constant current on a Neware BTS-3000 cycler. C/50 (1 C = 510 mA) rates were used for 5 formation cycles, with 30 min rests between subsequent charging and discharging steps, and a voltage window between 2.7 V and 4.2 V. Following the 5 formation cycles, some cells were then tested for rate performance at increasing cycling rates of C/12, C/7, C/5 and C/2.5. This paper focuses on three cells in particular, SiGr-01, SiGr-02 and SiGr-03. All three cells were initially cycled 5 times at C/50. SiGr-01 was immediately disassembled. SiGr-02 went through a further 250 cycles, and SiGr-03 went through a further 750 cycles at C/2.5.
Ex situ characterization
Cells were fully discharged before disassembly in an Argon filled glovebox. Once in the glovebox, the anodes and cathodes were harvested for ex situ characterization.
Half-cell testing
Half-cells were made using anode and cathode 1/2'' diameter disks directly punched from the tabs of the full cell. Half-cells were comprised of the harvested electrode, 750  m commercial lithium metal foil (Sigma-Aldrich) a dual polypropylene (Celgard) glass fiber (Whatman) separator, and 1 M LiPF6 EC:DMC electrolyte (Sigma-Aldrich). Anodes were cycled from 0.01 V to 2.0 V vs Li+/Li, while cathodes were cycled between 3 V to 4.4 V vs Li+/Li. All cycling was done in ambient conditions at a current rate of 80
  A cm−2.
XRD measurements
The SiGr composite powder was harvested from the anodes via sonication in deionized water, before characterization with a Bruker D8 Diffractometer using a Cu-Kα source.
SEM measurements
SEM measurements were taken with a Verios 460 XHR with working distance of ∼4 mm and accelerating voltage of 5 keV. The SiGr anodes were harvested from the cell, rinsed copiously in DMC, and dried in the large antechamber vacuum at 40  C for 2 hours before transferring to the SEM quick load lock chamber in double sealed containers. The sample preparation was done in an Argon filled glovebox with O2 < 1 ppm and H2O < 0.3 ppm. EDS point and line scans were taken with the built-in Oxford EDS detector with Aztec software.
XPS measurements
XPS measurements were taken with a ThermoFisher K-Alpha XPS with Al K  source. The SiGr anode was harvested from the cell, rinsed copiously in DMC, and dried in the large antechamber vacuum at 40
  C for 2 hours before transferring to the XPS with a vacuum transfer module. The sample preparation was done in an Argon filled glovebox with O2 < 1 ppm and H2O < 0.3 ppm. Peak fitting and analysis was done using the Avantage software, with a Shirley background subtraction. The sample was etched for 60 s before the scan with a monatomic Ar+ beam energy of 2000 eV. The spot size was 400
  m.
m.
Results and Discussion
Gassing during first cycle SEI formation
Cells were monitored in triplicate, via acoustic measurements during formation cycles at C/50. For the first cell, the first cycle showed a loss of acoustic signal for the first 40 hours of cycling (Fig. 2a). At first, this was thought to be an anomaly: the pair of transducers happened to lose contact with one another before gaining it back. And yet, the exact same phenomena happened for the second and third cells: there was a loss of acoustic signal for the first 40 hours of cycling, which amounts to a capacity of around 0.40 Ah (Figs. 2b–2c).
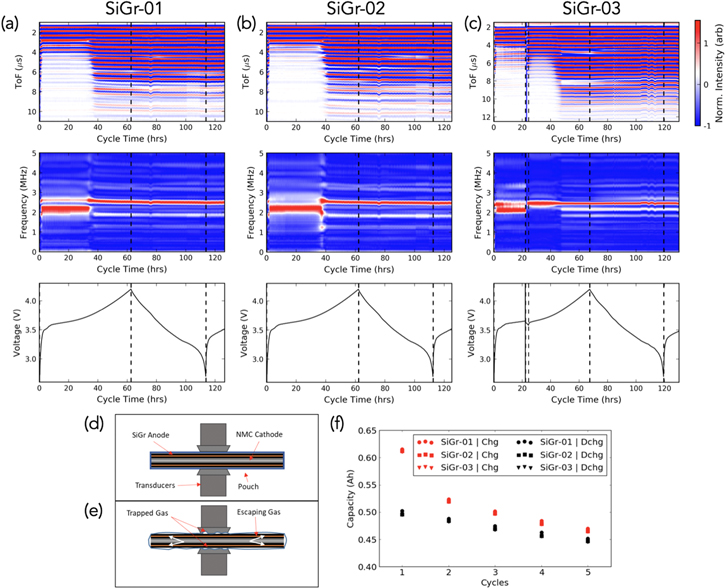
Figure 2. Subplots (a)–(c) each have three panels. The first panel (top) is a heatmap of juxtaposed acoustic waveforms, with the red regions representing amplitude peaks, and the blue regions representing amplitude troughs. White regions are regions of zero amplitude. This is explained in Fig. 1, and the associated waveforms for SiGr-01 are also shown in SI Fig. 1 (available online at stacks.iop.org/JES/167/020517/mmedia) as an example. The middle panel depicts the same waveforms but in the frequency space rather than time space, utilizing a fast Fourier transform (FFT). An FFT clarifies the origins of the partial signal attenuation to be due to predominantly lower frequency waves passing through the cell. When the signal recovers, the frequency upshifts. The bottom panel shows the corresponding voltage of the first cycle at a current rate of 0.01 A (C/50). All cathodes are composed of NMC532. (a) SiGr-01, (b) SiGr-02, (c) SiGr-03—the test was paused halfway through the first charge cycle (note the brief loss of data at t ∼ 22 hours) to probe whether signal loss was a transient external effect such as poor contact, or due to an actual physical process occurring in the first cycle. (d) Schematic of acoustic transducers and pouch cell prior to cycling. (e) Schematic of the gassing phenomenon, along with gas trapped between the pouch wall, electrodes and transducer. (f) Cycling plot of the first 5 cycles at C/50 for all three cells.
Download figure:
Standard image High-resolution imageBecause there was a loss of signal for the first 40 hours, the third cell was purposely stopped at around 20 hours, rested, and cycled again, re-adjusting the transducers during rest. When the cell was stopped and the transducers re-adjusted, the acoustic signal came back immediately, only to disappear a short while later (Fig. 2c). After 40 hours of cycling had been accumulated, the signal once again re-appeared as it had in the other batteries.
This loss of acoustic signal for the first 40 hours followed by the spontaneous signal recovery indicates evidence of substantial gassing during the initial SEI formation/lithiation of the silicon particles. Acoustic signal loss is generally strong evidence of gassing, because there is a significantly higher impedance mismatch ratio between transducer/air as compared with transducer/liquid. The acoustic signal significantly attenuates if it travels through gaseous media. Since the transducers are flush on the pouch surface with a spring contact (Figs. 2d–2e), it would take time for the gas to be transported outside the area where the acoustic signal presents and attenuates the signal. Once the rapid and substantial gassing slows down (at ∼40 hours), or when the transducers are taken off the pouch cell and reset, the signal returns. In the former case, the signal remains present, whereas in the latter case, it disappears again in less than an hour due to continuous gas formation.42 Recent studies in the literature attribute common causes of gas formation in graphite and SiGr anodes, including H2 and CO2, to residual water contamination or electrolyte reduction.43,44 For example, Gasteiger et al. showed significant gas formation, primarily H2 and CO2, during the first lithiation of silicon/graphite composite anodes, due to the selective reduction of FEC.44 In another study, differential electrochemical mass spectrometry was used to show that the gaseous byproducts CO2, C2H4, H2 and CO continue to form throughout long-term cycling of Si anodes, though they recorded <100 parts-per-million as opposed to >1000 parts-per-million as observed by Gasteiger in the first cycle.45 These two studies confirm that significant gassing does occur in SiGr composite anodes in the first cycle lithiation, which agrees with our results indicating partial acoustic signal attenuation in the first 40 hours of charge. While minimal gassing may continue to occur, it is not enough to attenuate the acoustic signal in subsequent cycles. Once the SEI is formed after the first cycle at C/50, further cell degradation would be due to gradual anode passivation rather than the substantial gassing occurring initially.
With regards to electrochemistry, the dominant gas formation of the first cycle charge occurs for close to 2/3 of the initial charge time. The cycling data in Fig. 2f shows that the initial Coulombic efficiency (CE) is ∼82% for all cells, which is similar to a prior study using the same type of cell with slightly lower Si loading (84% CE, 15 wt% Si).40 This shows that while there is ample gas formation during the first cycle, the CE is not as affected. While gas formation primarily results from an initial reaction between electrolyte and electrode surface contaminants, lower CE is due to progressive SEI formation and lithium inventory loss.
To further probe the acoustic origins of the partial signal attenuation in the first 40 hours of lithiation, a fast Fourier transform was applied on the three signals (see middle panels of Figs. 2a–2c). Analyzing the acoustic waveforms in the frequency space, as opposed to the time space as in the ToF heatmaps, allows for visualization of which frequencies are dominant in the waveform. This can provide greater clarity on the type of wave passing through the cell. As shown, all three cells show the same lower frequency wave of around 2 MHz during the partial signal attenuation region. Once the full signal recovers, the higher frequency of around 2.5 MHz dominates and the lower frequency disappears. This indicates that a physical occurrence in the first 40 hours, such as gassing, results in the preference for a lower frequency wave.
The first cycle signal attenuation followed by signal recovery is specific to the SiGr cell. The acoustic time-of-flight signals for conventional silicon-free Li-ion batteries are strong and do not attenuate.36 In a prior study, attenuation was only observed for visibly gassed Li-ion pouch cells that had undergone fast rate and/or high temperature cycling. For further reproducibility, each pouch cell had also been fitted with a second pair of transducers that conducted acoustic measurements at the same time as the first pair. The data shown in Fig. 2 are for the first pair, and all six acoustic waveforms are depicted in SI Fig. 3. They all show evidence of acoustic attenuation in the first cycle followed by signal recovery. There are minute differences between the two locations in a cell, as well as between different types of cells, perhaps due to spatial heterogeneities within the cell or batch to batch differences amongst different cells.
dQ/dV and initial cycling observations
The incidence of gas formation during the first cycle, accompanied by the decrease in capacity and rising Coulombic efficiencies of cycles 2–5, is rendered more evident when plotted as a dQ/dV function in Fig. 3a. Upon the initial charge, there is a prominent peak around 3.7 V. For clarification purposes, the capacity obtained during the attenuated acoustic signal has been shaded in on the plot. This peak is associated with the gas formation/SEI formation, as it fails to recur in subsequent cycles. Another interesting part of the dQ/dV curve of the first cycle is the shoulder peak in the 3.4 V to 3.6 V range. This shoulder peak is minor compared to the large feature at 3.7 V. However, in cycles 2–5, this peak appears as a major feature in the charging step, with more capacity than the initial shoulder peak. This is likely due to a "break-in" effect, where additional lithium storage capabilities in the anode are "activated" after initial lithiation, through processes such as electrolyte wetting and silicon particle pulverization. This "break-in" effect as detected by acoustic ultrasound has also been previously observed and studied for commercial LCO/graphite pouch cells.38

Figure 3. (a) dQ/dV plot of cycles 1–5 for the SiGr-01 battery. (b) ToF heatmap of cycles 2–5 (corresponding ToF for cycle 1 is depicted in Fig. 2a). (c) Corresponding voltage vs time curves of cycles 2–5. (d) ToF Shift of the signal in cycles 2–5. The sudden drop at t ∼ 170 hours arises from an intermittent loss of data (note the corresponding missing data in the ToF heatmap). Similar acoustic data for the formation cycles of SiGr-02 and SiGr-03, both of which also exhibit the upshift of ~0.08 μs in the ToF shift between cycles 2–5, are shown in SI Fig. 2.
Download figure:
Standard image High-resolution imageAdditionally, the first peak then displays an upshift in cycles 2–5, while the remainder of the charging dQ/dV curve stays consistent. This indicates that the loss in charging capacity occurs primarily at lower voltages, and is thus most likely attributed to a loss of storage capacity for the silicon that is present in the anode, as the silicon lithiates at lower voltages than graphite. The discharge dQ/dV curves for cycles 1–5 are more consistent, though slight differences still exist. Cycle 1 exhibits a prominent peak around 3.3 V, which then starts to attenuate and experience a slight upshift in cycles 2–5. This peak attenuation, along with the slight upshift, mirrors what happens to the 3.4 V peak of the charging curve, and as such provides additional evidence of the loss of capacity contribution from the silicon portion of the anode.
Aside from the first cycle in the dQ/dV plots, cycles 2–5 only show slight changes. In cycles 2–5, the acoustic signal homogenizes and stops displaying evidence of gas formation (Figs. 3b–3c). This is in line with the observation from Fig. 2f, which shows that Coulombic efficiency rises above 95% in the 4 cycles following the first one. The combination of these results indicates that gas formation primarily occurs in the first cycle, while SEI formation dominates cell losses after the first cycle.
Figure 3d indicates that there is a negative ToF shift during lithiation of the anode, which means the acoustic signal travels faster through the cell. On the contrary, there is a positive ToF shift during delithiation, indicating the acoustic signal is traveling slower through the cell. These results are in line with earlier published results by Davies et al.37 who showed that the ToF shift in a LCO/graphite pouch cell was dominated by the lithiation/delithiation of the graphite anode due to its lower volumetric density and greater modulus changes relative to LCO. When graphite is lithiated to a LiC6 stoichiometry, the Young's modulus of the graphite increases, thus leading to a faster ToF and a decrease in the ToF shift according to Eq. 1.
In addition to the intracycle negative/positive ToF shift, the general trend over the first 5 cycles is an upward ToF shift, thus implying the waveform is taking a longer time to cross the cell. The capacity in these initial 5 cycles drops precipitously, despite the utilization of a lower current rate. Considering the presence of silicon in the anodes, it is probable that the silicon which was electrochemically active in the first few cycles gradually passivated with SEI due to the large volume changes.
In order to relate structural changes within the cell to the observed acoustic changes, several possibilities were considered. Qi et al. previously documented the modulus changes of graphite anodes and LCO cathodes as a function of state-of-charge, and showed that the graphite anode undergoes a much more significant change in modulus.46 The significantly higher Young's modulus of fully lithiated graphite, as compared with the delithiated state, causes the acoustic signal to travel faster through the battery. Since the graphite comprises a weight majority of the SiGr anode, it makes sense that the ToF shift behavior is predominantly a result of graphite changes. These conclusions confirm the observation that ToF shift decreases during lithiation (Fig. 4). On the other hand, the volume expansion of the SiGr anode appears to have a minimal effect on the ToF shift, as volume expansion during charge would have caused a positive ToF shift due to the acoustic signal taking longer to travel through.

Figure 4. (a) Rate performance test of five decreasing rates with five cycles each. (b) dQ/dV plot of the first cycle in each rate in (a). Voltage curve and ToF shifts obtained at current rates of (c) C/12, (d) C/7, (e) C/5, (f) C/2.5.
Download figure:
Standard image High-resolution imageSecondly, a fully reversible charge/discharge mechanism would result in zero ToF shift, and a ToF signal at the end of discharge that returns to where it was at the BOC. However, Fig. 3d indicates that the ToF shift at the BOC increases with cycling. The ToF shift is normalized at zero after the end of the first cycle discharge. Four cycles later, the ToF had undergone a positive shift of nearly 0.08 μs. There are two possible causes of this shift. First, reduction of the Young's modulus upon delithiation, due to irreversible silicon passivation from the prior lithiation step, causes an increase in ToF.47 This would be reflected as an increase in ToF shift at the end of discharge, where the Young's modulus of graphite is minimized. Second, passivated silicon retains a larger volume due to greater SEI formation, which increases the path length between the two transducers. As the anodes contain 30 wt% Si, fully passivated SiGr anodes would be expected to increase in volume by more than 160%, assuming 300% volume increase for Si and 10% volume increase for graphite. At the top of charge, this increase in path length is obscured by the higher Young's modulus of lithiated graphite, resulting in a negative ToF shift. At the BOC, this increase in path length coupled with a lower Young's modulus of delithiated graphite makes the increase in ToF shift apparent. Both of these possibilities indicate that silicon no longer reversibly participates in the electrochemical reaction, featured by the ToF shift increase at the end of discharge.
Rate performance and long-term cycling
Following the initial cycling at C/50, one of the cells was then tested at constant current rates of C/12, C/7, C/5 and C/2.5. This rate performance test was done to determine if current rate affected the acoustic measurements as observed by ToF shift patterns.
Figure 4a indicates that there are slight decreases in capacity with every increase in the current rate. Furthermore, those losses do not seem to be current dependent. Despite an initial capacity of around 0.6 Ah, capacity falls to 0.45 Ah over the first 5 cycles at a rate of C/50. When brought to current rates of C/12, C/7, C/5 and C/2.5, the capacity decreases slowly at each step, before stabilizing at around 0.30 Ah at a rate of C/2.5. In the dQ/dV plots in Fig. 4b, there is a clear upward shift of the redox peaks as the current ramps up, along with an attenuation of the overall surface area.
In the corresponding acoustics data in Figs. 4c–4f, the ToF shifts show a similar pattern to what was exhibited at a current rate of C/50, though to a lesser degree. In Fig. 3d, it was shown that the ToF shift increased by nearly 0.08 μs throughout the first five formation cycles at C/50. This was correlated with the SEI formation process, where ample passivation of the SiGr composite occurs and dramatic changes in the acoustic waveform results. However, the subsequent rate performance cycles in Figs. 4c–4f result in comparably less significant capacity changes. As a result, the ToF shifts are negligible. Figure 4c, which depicts the C/12 cycles, seems to show an ToF shift increase of 0.02 μs between the first and last cycle, when comparing the troughs at the top of charge. Figure 4d, for the C/7 rate, also shows a similar 0.02 μs increase between the first and last cycle. Figures 4e–4f, for the C/5 and C/2.5 rates, seem to show less than 0.01 μs increase in the ToF shift, if at all. The intracycle trends are still consistent, with the ToF downshift during lithiation and upshift during delithation. As such, this furthers the argument that the irreversible lithiation of the silicon particles accounts for the initial upward trend in ToF shift and the associated capacity loss.
Under long-term cycling at rates of C/2.5 CCCV charge and C/2.5 CC discharge, a similar relationship between ToF shift and capacity is observed. Figure 5a displays the ToF shift measured at the BOC relative to that of the first cycle. The greatest increase in ToF shift occurred in the first 100 cycles, when the majority of capacity fade occurred. After the first 100 cycles, the cell capacity is most likely limited to contributions from graphite only, which could contribute up to 350 mAh based on the cell loading. The lower cell capacity is ascribed to the loss in Li inventory due to SEI formation and possibly lithiated but electrically deactivated Si. Both the rate of capacity fade and ToF shift increase are observed to decline with increasing cycles.
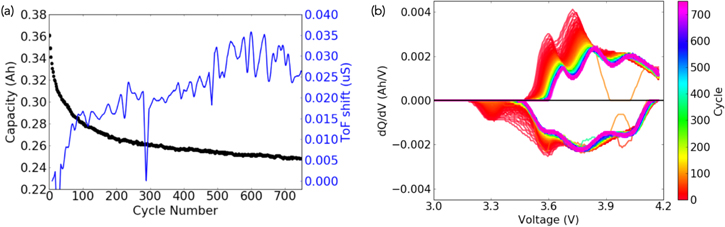
Figure 5. (a) Dual y-axis plot showing the capacity obtained over 750 cycles at a 1 C current rate during long-term cycling (black curve), with the corresponding ToF shift (blue curve). The ToF shifts in question were all measured at the end of each discharge, referred to as bottom-of-charge (BOC), and were compared with the BOC from the first cycle. The sudden drops around cycle 20 and cycle 300 are due to momentary loss of data. (b) dQ/dV plot of the 750 cycles from long-term cycling.
Download figure:
Standard image High-resolution imageAs shown in the dQ/dV analysis in Fig. 5b, the majority of the capacity losses occur with the first 100 cycles and are primarily concentrated at lower voltages. Within the first 100 cycles, the first two reduction peaks on the charging step noticeably attenuate and shift to higher voltages, while the latter part of the dQ/dV charging curve stays relatively unaffected throughout the rest of the charging step. The pattern occurring on the discharge curve is slightly different. As with the dQ/dV from the charging steps, most of the capacity is lost within the first 50 cycles. However, the entire oxidation peak disappears: by the 100th cycle, the peak that was first present at 3.3 V has disappeared entirely. This peak corresponds to silicon lithiation and confirms that most of the silicon particles were electrically deactivated by then.48 The other change comes from the attenuation of the oxidation peak around 3.6 V, though that peak is still present even after the 750th cycle.
These results suggest that the main source of fading over the long-term is the loss of capacity from silicon: after the 100th cycle, the oxidation peak from the silicon delithiation is no longer present, most likely due to the presence of lithiated silicon that has become passivated and rendered electrochemically inactive. As such, the observations of rapid capacity decrease, rapid ToF shift increase, and disappearance of the 3.3 V oxidation peak on the dQ/dV discharge—all within the first 100 cycles—is consistent with the lithiation and subsequent passivation of the electrochemically active silicon.48
The SiGr anodes were harvested from the pouch cells for post mortem chemical characterization to confirm progressive silicon passivation, and to correlate chemical and morphological changes with measured acoustic signals. Samples were dried and placed in vacuum transfer modules to carefully protect against moisture and oxygen contamination. Scanning electron microscopy images for SiGr-01 (cycled 5 times at C/50) and SiGr-03 (cycled a further 750 cycles at C/2.5) show that SiGr-03 has a rougher surface coating (SI Fig. 4). Corresponding energy dispersive X-ray spectroscopy analysis indicates that SiGr-03 has greater relative amounts of fluorine (26 wt%) and oxygen (22.5 wt%) species compared with SiGr-01 (14.8 wt% fluorine and 9.3 wt% oxygen) (SI Fig. 5). The high concentrations of fluorine and oxygen describe the heavy surface coating on SiGr-03, due to progressive electrolyte degradation. The results from X-ray photoelectron spectroscopy peak fitting indicate more high binding energy species for SiGr-03 compared with SiGr-01. The Si 2p scan for SiGr-03 shows greater amounts of SixOFy, SiO2, and SiOx at respective binding energies of 104.8 eV, 103.2 eV and 101.9 eV.49 The C 1 s scan for SiGr-03 also shows greater concentrations of organic species corresponding to alkyl carbonates at respective binding energies of 289.2 eV, 287.4 eV and 286.0 eV.50 These results together indicate chemical passivation of the SiGr anode surface (SI Fig. 6). After 750 cycles of additional cycling, the top layer of the SEI contains more high binding energy species, including various chemical states of silicon oxide, and alkyl carbonates from decomposed electrolyte solvent. The greater chemical passivation of the anode surface after long-term cycling is also reflected by the high internal resistance measured by EIS (SI Fig. 7). These chemical changes that are observed in post mortem SEM, EDS and XPS indicate the enhanced silicon passivation of the long-term cycled cell (SiGr-03) compared with the cell cycled only 5 times (SiGr-01). The morphological non-uniformity and greater SEI degradation observed in SiGr-03 physically confirm the electrochemical events observed in dQ/dV analysis and the operando measurements taken with acoustic time-of-flight.
Half-cell studies
Post mortem electrochemical tests were conducted utilizing half-cells constructed from the disassembled anodes and cathodes of the full pouch cells. These tests helped establish a clearer connection between the acoustic behavior and long-term capacity fading. The two cells that were disassembled were SiGr-01, which had undergone 5 formation cycles at a current rate of C/50, and SiGr-03, which had undergone initial C/50 formation cycling as well as 750 cycles at a current rate of C/2.5. This allowed for a comparison between an uncycled formed cell and a long-term cycled cell after formation.
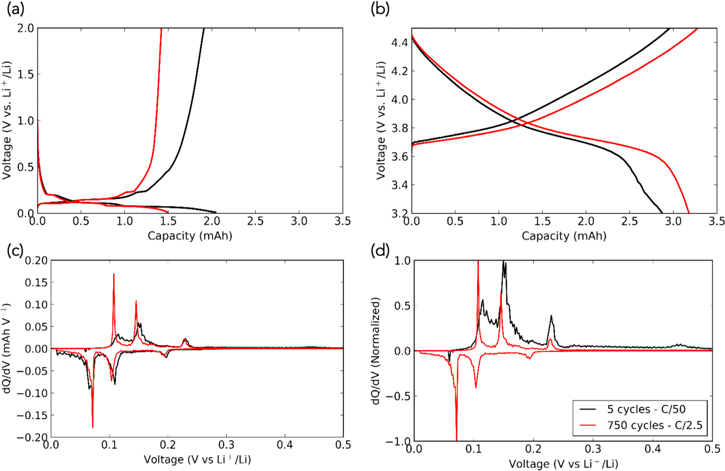
The anode half-cell capacities of SiGr-01 (5 formation cycles) and SiGr-03 (additional 750 cycles) were 1.78 mAh and 1.50 mAh, respectively (Fig. 6a). The cathode half-cell capacities of SiGr-01 and SiGr-03 were 2.87 mAh and 3.18 mAh, respectively (Fig. 6b). The anode shows a slight decline in the capacity, most likely due to the loss of electrical contact with the silicon particles, which no longer contribute to lithium storage. However, that does not by itself account for the capacity decline of the full cell. After 5 cycles at C/50, the capacity of the pouch cell was at 0.445 Ah. After 750 cycles at C/2.5, the cell displayed a capacity of 0.274 Ah at a current rate of C/50. The cathode shows minimal signs of degradation over the long-term cycling. In fact, the cathode from the long-term cycled battery displays a higher capacity than the one harvested after 5 cycles, verifying that degradation of the cathode cannot be the primary culprit behind the capacity loss observed over long-term cycling.51
Figure 6. (a) Charge/discharge curve of an anode half-cell, with the anode behind harvested from the full cell following 5 cycles at C/50 (black), and a further 750 cycles at C/2.5 (red). (b) Charge/discharge curve of a cathode half-cell following a similar procedure to (a). (c) dQ/dV plot of the anode half-cell from (a). (d) Normalized dQ/dV plot from (c).
Download figure:
Standard image High-resolution image
The capacity values from the half-cell electrochemical tests can also be extrapolated to the full cell area as a direct comparison, as shown in Table II. Provided the areal loading in Table I for each electrode and the nominal capacity of each electrode which has been calculated previously for the exact same electrode type fabricated at the same facility40 (only difference was in the extrapolation from 15 wt% to 30 wt% Si used in this study), the total capacity of the pouch cell used in this study can be calculated to be 0.533 Ah for the NMC 532 cathode and 0.762 Ah for the SiGr composite anode (based on the total surface area of the three double-sided cathodes). Therefore, the cells start off with an N/P ratio ∼1.43. However, this would quickly decline upon initial formation cycling due to rapid capacity loss of the anode. As shown in Fig. 2f, the initial low CE of 82% results in a high charge capacity but low discharge capacity, signaling that the cell is becoming anode-limited. At the end of 5 formation cycles, the pouch cells show a discharge capacity of 0.445 Ah.
Table II. Comparisons between full cells and half-cells.
| NMC 532 cathode | SiGr anode | ||
|---|---|---|---|
| a) | Loading (from Table I) | 12.5 mg cm−2 | 2.1 mg cm−2 |
| b) | Nominal Capacity40 | 150 mAh g−1 | 1277 mAh g−1 |
| c) | Calculated Areal Loading | 1.875 mAh cm−2 | 2.68 mAh cm−2 |
| d) | Calculated Total Capacity | 0.533 Ah | 0.762 Ah |
| e) | Half-cell Capacity (SiGr-01 ∣∣ SiGr-03) | 2.87 mAh ∣∣ 3.18 mAh | 1.78 mAh ∣∣ 1.50 mAh |
| f) | Extrapolated Full Cell Capacity (SiGr-01 ∣∣ SiGr-03) | 0.644 Ah ∣∣ 0.714 Ah | 0.399 Ah ∣∣ 0.337 Ah |
Extrapolation of the half-cell capacities resulted in total capacities of 0.644 Ah for NMC 532 and 0.399 Ah for SiGr-01 (electrodes harvested immediately after formation). The anode measurements in Table IIf) are consistent with the discharge capacity of the last formation cycling. Some capacity may be lost from cell disassembly, and from the half-cells not using FEC. The high capacity of the cathode suggests that there is practically no degradation after formation and also long-term cycling, which makes sense given the slow rates. The extrapolated values are higher because the cathode half-cell tests were conducted up to 4.5 V, rather than 4.2 V in the full cell tests.
Correlative dQ/dV plots were analyzed to further investigate the role of the anode in capacity degradation (Fig. 6c depicts raw data, Fig. 6d depicts normalized data for greater clarity). A notable feature of these plots is the two main graphite intercalation peaks around 0.1 V and 0.15 V on the charging step. SiGr-01 (5 cycles) has much broader peaks than SiGr-03 (long-term cycled). This is a sign of electrochemically active amorphous silicon, which is known to cause hysteresis in the lithiation/delithiation curves relative to pure graphite.52 Additionally, there is a minor peak at 0.45 V during delithiation on SiGr-01, which is not present in SiGr-03. This peak at 0.45 V is associated with silicon delithiation, and confirms that during long-term cycling, the silicon that is present in the anode ceases to contribute to the capacity of the battery. This mirrors the dQ/dV plot of the long-term cycling data displayed in Fig. 5b. The peak initially present at 3.3 V on the discharge quickly fades within the first 50 cycles. Since the discharge of a full cell involves silicon delithiation as one of the last steps, it implies the loss of capacity contribution due to silicon passivation. These peak changes also occur during half-cell cycling. After 25 cycles at a current rate of 0.1 mA, the peaks around 0.1 V and 0.15 V become sharper, while the 0.45 V peak disappears entirely (SI Fig. 8), thus showing that the composite material is slowly shifting towards graphitic lithium-ion storage behavior while the silicon is passivated. The disappearance of the peak at 0.45 V is consistent with dQ/dV measurements by Abraham et al.53 who also showed evidence of passivation. After 750 cycles, the dQ/dV peaks in a half-cell setting are very sharp, showing almost exclusive graphite behavior.
Conclusions
We have demonstrated, through a combination of electrochemical and ex situ analysis, an operando acoustic method of monitoring the SOH of NMC/SiGr pouch cells. The acoustic measurements first show the onset of gassing during the initial lithiation of the SiGr anode, which causes a temporary acoustic signal loss for the first 60% of the initial charge. Gas formation reaches its peak around 3.6 V. Following the initial charge, the ToF shift of the acoustic signal can be used to gauge the degree of lithiation of the SiGr anode, with a negative ToF shift with respect to the BOC implying a lithiated anode.
As the cells are cycled and more capacity losses are accrued, an upward trend in the ToF shift at the BOC is observed, indicating that the components of the cell have a lower Young's modulus. This is consistent with the known lower Young's modulus of lithiated and passivated silicon particles. As the cells are cycled further, an inverse correlation between the ToF shift at the BOC and the overall capacity is observed. As the capacity drops, the ToF shift at the BOC becomes greater. This is especially pronounced within the first 50 cycles of long-term cycling, and also correlated with the loss of two reduction peaks in the dQ/dV plot of the discharge. As the capacity losses plateau out, the ToF shift does as well, thus showing that acoustic measurements can track silicon passivation over long-term cycling. The increasing passivation of the SiGr anodes is verified with post mortem chemical analyses.
The ability to track silicon passivation over long-term cycling using the acoustic method demonstrated here is significant, as it provides researchers a simple operando method of tracking localized passivation via the portion of the cell directly in contact with the acoustic transducers. This brings a new dimension to characterizing localized degradation of commercial-scale SiGr cells, which traditional electrochemical measurements struggle with.
Acknowledgments
Princeton University: The authors acknowledge the use of Princeton's Imaging and Analysis Center, which is partially supported by the Princeton Center for Complex Materials, a National Science Foundation (NSF)-MRSEC program (DMR-1420541). Oak Ridge National Lab: This research was conducted at Oak Ridge National Laboratory, managed by UT Battelle, LLC, for the U.S. Department of Energy (DOE) under contract DE-AC05–00OR22725. The work was sponsored by the Office of Energy Efficiency and Renewable Energy (EERE) Vehicle Technologies Office (VTO). C.B. and W.C. led the project, wrote the manuscript, and conducted acoustic analysis. J.L. assembled pouch cells. S.B. aided with acoustic characterization. J.N. and D.S. supervised the project. D.S. is a founder of Feasible, which employs the ultrasonic technique (patent application #20160223498) used herein. Feasible did not fund the work nor participate in its execution.