
Abstract
The different contributions to the polarization of a  electrode are experimentally discriminated in this work. The electrode total resistance is dominated at high rate by the contribution of the electronic and the ionic wires, the former being more important in the case of electrodes with low compaction, while the latter being more important in the case of electrodes with high compaction. A porosity in the 35%–40% range allows to minimize the electrode polarization. At low rate, the electrode resistance is dominated by the resistance to lithium insertion into the active mass and follows the predictions of M. Gaberscek and J. Jamnik [ Solid State Ionics , 177 , 2647 (2006)] . We show here that the resistance to lithium insertion decreases with the increase of the specific current, a feature that suggests an increase of the active particle conductivity with rate. The easy-handling methodology described in this work should enable a more rational optimization of the electrode formulation and processing conditions for better electrochemical performance.
Export citation and abstract BibTeX RIS
After the demonstration of its electrochemical activity by Padhi et al. ten years ago,1  is now commercialized as the active material (AM) of new generation lithium-ion batteries positive electrodes. Its low cost, nontoxicity, and thermal stability have been the main
  assets of its fast and massive expansion. Minimization of the size2, 3 as well as conductive carbon coating of the
  particles4, 5 undertaken to overcome kinetic limitation in solid state transport processes enabled significant improvements of the electrochemical performance of
  -based electrodes. Recent studies have been carried out to free the materials from impurities,6 or to better understand the air/water exposure effects that are important for the processing of the
  electrode,7–13 especially for the design of binder formulations for an aqueous processing of the composite electrode.13, 14
To move further in the enhancement of energy and power performance, research now focuses on the optimization of the ionic and electronic wiring of the  particles within the composite electrode. Several recent works have demonstrated that rate limitations to discharge capacity of
  -based electrodes mainly come from the ionic and the electronic wires, i.e., restrictions of the lithium ions diffusion within the electrode porosity and of the electrons transport through the electrode architecture to the active particles.15–17 The electrode polarization is another very important issue in the performance of power oriented lithium ion batteries.18 The possible different contributions to the potential drop involve (i) the electronic wires [the contacts at the current collector/composite electrode interface, the conductive additive/binder (C/B) network, the contacts between the C/B network and the AM mass, and finally the carbon coating], (ii) the ionic wires (the network of pores filled by the liquid electrolyte in the composite electrode), (iii) the resistance due to the kinetics of the liquid-solid charge-transfer reaction, and finally (iv) the resistance to solid state transport limitations and to the phase nucleation within the AM particles.15, 18–21 Mathematical models can be used to estimate the different contributions,20 but their parameters are usually adjusted to get the experimental-model fits, which questions the confidence in them. To date, no easy-handling method has been proposed for a clear discrimination between the electronic and ionic wiring versus the active material contributions to the electrode polarization in
  composite electrodes.
In this work, we start from the Prosini's approach19 to define  and
and  , the resistances, respectively, independent and dependent of the insertion degree
  in
in  .
.  and
and  are studied as a function of discharge rate, electrode active mass loading, and porosity variations. It enables us to highlight and discriminate the different contributions to the polarization of the
  electrode.
Experimental
Materials
 was prepared by mechanochemistry using commercial
  and fresh iron (II) phosphate as the source of the main components, together with the electronic conductor additive precursor (sucrose for carbon coating). The powders were ball milled in a planetary mill (Retsch S1000) with agate vessels. The resulting product was then heat-treated at
  under nitrogen for
  to crystallize the final compound
  with the desired coating around the particles. This active material is mixed with several additives to form the electrode slurry. Carbon Super P (specific surface of
  , Timcal), hereafter named CB, chosen as conductive additive, was incorporated in aqueous slurries using a nonionic surfactant (Triton X-100 from Aldrich). Butadiene-acrylonitrile copolymer rubber latex (NBR from PolymerLatex) was used as the binder and CMC [0.7 carboxyl unit per molecule cellulose
  ,
,  , Aldrich] as the thickening agent.
Preparation of the composite electrode
Electrode slurries were prepared in deionized water at a solid fraction of  with a high-speed mixer used to shear the electrode slurry for
  . The slurry was then tape-casted by using an automatic doctor blade onto an aluminum current collector. The gap between the blade and the current collector was fixed from
  resulting in electrode loadings in the range of
  surface capacity. Drying is done at
  to remove water and electrodes are then densified to adjust their porosity. Before battery assembly, an additional drying at
  under dynamic vacuum is performed.
Battery assembly and characterization
 -based composite electrodes are assembled in electrochemical cells with lithium metal as counter electrode, Celgard film as a separator soaked in an electrolyte consisting of a
 solution in an ethylene carbonate-diethyl carbonate (EC-DEC 1/1) mixture. The assembly of the button cells is carried out in a dry glove box under argon atmosphere. Electrochemical experiments are performed at
  , monitored by an Arbin instrument, between 2.0 and
  versus
  .
.
Electrode electrical properties
The electronic resistance measurements were carried out by impedance spectroscopy on dry  electrode/current collector samples sandwiched in between two metallic plungers in a standard Swagelokcell. The value of
  , the dry electrode transverse electronic resistance, enables to determine
  , the apparent electronic resistivity of the electrode, via the equation
  , where
  and
and  are, respectively, the thickness and the surface of the electrode analyzed.
Results
Morphological/textural study
This part summarizes our previous observations.13, 14, 17  is in the form of primary particles, with a diameter in the
  range, that are agglomerated into secondary particles with a mean diameter of
  . The large
  agglomerates are well distributed within a homogeneous mixture of small
  and carbon black agglomerates. The binders form a thin continuous amorphous layer covering the surfaces of
  and carbon black particles and they bridge together
  and carbon black particles. There exist two types of pores within the composite electrode: mesopores of less than
  in size within the
  agglomerates and pores typically larger than
  in size within mixture of small
  and carbon black agglomerates. Mesopores are not affected by the pressure applied on the
  electrodes to adjust their density.
Methodology of the electrochemical study
Typical discharge curves of the  electrode are characterized by four distinct features commonly seen in the literature (Fig. 1a), namely: (i) a flat discharge curve for low rate at a potential of
  versus
  due to the co-existence of two phases during discharge, i.e.,
 and
and 
 ;22 (ii) a decrease in the plateau potential with increasing current density; (iii) a slope in the discharge curve at higher current density in the plateau region, with the slope increasing with current; and (iv) a drop in the utilization of the material with increasing current density.
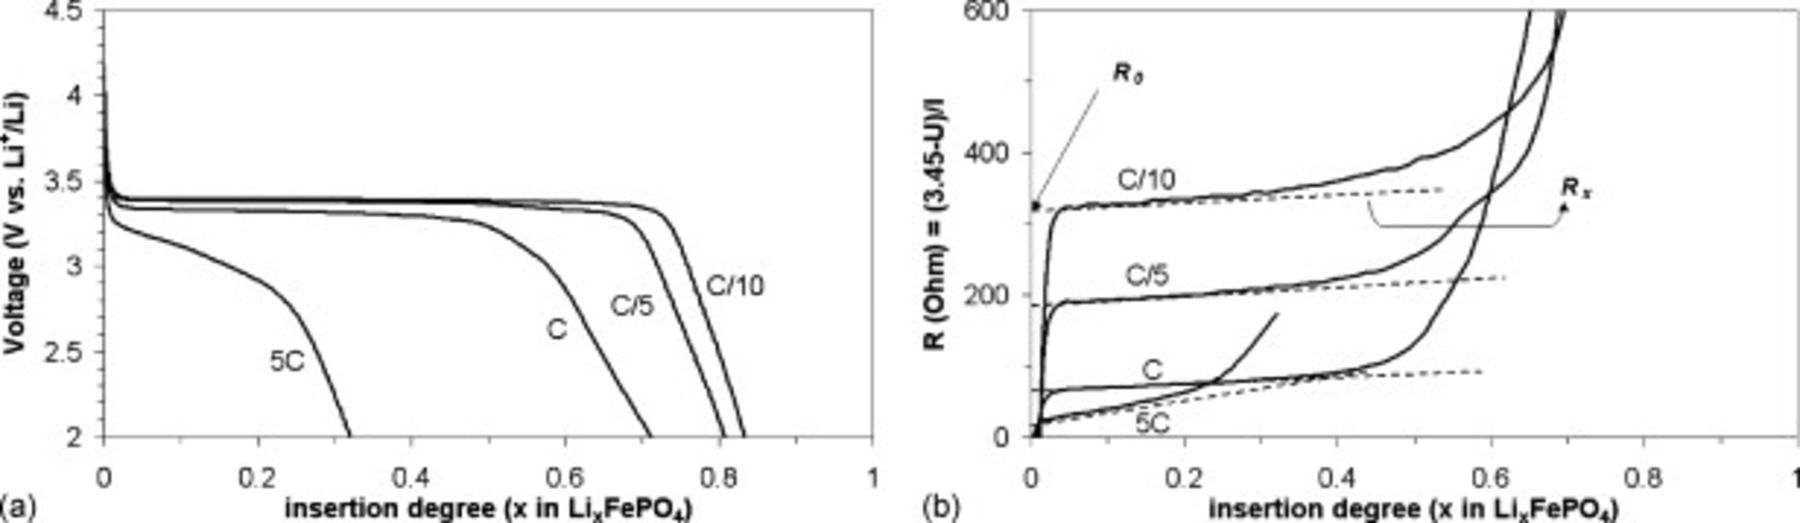
Figure 1. (a) Voltage as a function of the Li insertion degree for different discharge rate. (b) Voltage drop divided by the discharge current as a function of the insertion degree.  electrode: 87.5%
 porosity.
To analyze the role of the electrode formulation and parameters on the discharge behavior of  -based electrodes, we utilize several variables (see Table I) derived from the Prosini's approach.19
  ,
,  ,
,  , and
, and  are extracted from the discharge curves through two simple equations (Eq. 1 and 5 in Table I).
  is the equilibrium (very low rate) discharge capacity
  and
and  is the rate factor that takes into consideration the decrease of the discharge capacity
  with increasing specific currents
  and thus characterizes the system response in power. These two parameters were analyzed in our previous work,17 which is briefly summarized here:
  enables to quantify the fraction of AM grains
  (Eq. 2) that are truly electrochemically wired to both the electronic and ionic wires of the composite electrode. The rate factor
  can be written as the sum of the ionic,
  , and electronic,
  , power limitations (Eq. 3). A first order expression for
  (Eq. 4) shows that this parameter critically varies with the void volume fraction ε of the porous electrode filled with electrolyte and the pores' tortuosity that is quantified by the Bruggeman exponent α, equal to 3.8 in the case of the electrode studied here.17
  also depends on
  the composite electrode thickness and on the intrinsic diffusion coefficient of the liquid electrolyte
  .
.  varies like the electronic resistance of the electrode.
Table I. The parameters used to quantify the roles of the electrode formulation on the discharge behavior of  composite electrodes and their influencing factors. AM: active material. C: conductive additive. B: binder.
| Equations | Parameter | Definition | Influencing factors according to this work |
|---|---|---|---|
(1) 
 is the specific capacity is the specific capacity
 is the specific current is the specific current  (2) (2) 
|
 
| Equilibrium discharge capacity, extrapolated at very low specific current | — , theoretical specific capacity ( , theoretical specific capacity ( for for  ) —Impurities — ) —Impurities —
|

| Fraction of AM connected to both the electronic and ionic wires of the composite electrode | e.g., electrically insulating polymeric layers at the surface of AM grains or incomplete wetting of the composite electrode porosity decreases  . . | |

| Rate factor, quantify the specific capacity dependence on 
| — (dominates at high porosity in this work) — (dominates at high porosity in this work) — (dominates at low porosity in this work) (dominates at low porosity in this work) | |
(3)  (4) (4) 
|

| Contribution of electronic wires to the rate factor k | —Contact resistance at the current collector/electrode interface —C conductivity —B to C ratio —percolation of C/B network —contact resistances within C/B network and between C/B network and the AM particles —carbon coating conductivity |

| Contribution of ionic wires to the rate factor k | — , the composite electrode thickness — , the composite electrode thickness — , intrinsic diffusion coefficient of the liquid electrolyte, —ε, void volume fraction of the porous electrode filled with electrolyte, —α, Brueggemann exponent that depends on the pores tortuosity (3.8 in this work) , intrinsic diffusion coefficient of the liquid electrolyte, —ε, void volume fraction of the porous electrode filled with electrolyte, —α, Brueggemann exponent that depends on the pores tortuosity (3.8 in this work) | |
(5) 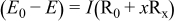
 is the theoretical voltage of the electrode ( is the theoretical voltage of the electrode ( for for ) ) is the operating voltage (V) is the operating voltage (V) is the current (A) is the current (A) is the insertion degree of Li in is the insertion degree of Li in   (6) (6) 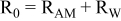 (7) (7) 
|
 
| Electrode resistance independent on x in  . . | — (dominates at low AM loading and low (dominates at low AM loading and low  ) — ) — (dominates at high AM loading and high (dominates at high AM loading and high  ) ) |
 
| Contribution of the AM to  See [28–31] for further details. See [28–31] for further details. | — , the AM mass (g) —β, a numerical prefactor that depends on the AM particle geometry ( , the AM mass (g) —β, a numerical prefactor that depends on the AM particle geometry ( for spheres) —ρ, the AM particle bulk density for spheres) —ρ, the AM particle bulk density  — — , the AM particle diameter — , the AM particle diameter — , the total conductivity of the AM particle , the total conductivity of the AM particle 
| |
 
| Contribution of the electronic wires to 
| — increases with an increase of L and decreases with a decrease of ε (in this work) — increases with an increase of L and decreases with a decrease of ε (in this work) — is independent on is independent on 
| |
 (Ω per Li)
| Electrode resistance dependent on x in  . . | Distribution of electronic and ionic wiring: —conducting paths lengths, —inter-particle contacts, —gradient concentration within the electrolyte. increases with an increase of L and shows a minimum for an optimal value of ε (in this work) increases with an increase of L and shows a minimum for an optimal value of ε (in this work) increases with an increase on increases with an increase on 
|
This paper will now focus on the variables  and
and  that are linked to the voltage drop according to Eq. 5.
  and
and  are, respectively, the resistances independent and dependent on the insertion degree
  . Thus, on a potential versus composition discharge curve,
  ,
,  is linked to the plateau of potential whereas
  is linked to the slope of this plateau. We plotted in (b) the voltage drop,
  , divided by the discharge current,
  , as a function of the insertion degree,
  , for an electrode at different discharge rates, which allows us to directly get
  and
and  .
.
In the following, after a literature survey, we identify the origins of  and
and  by studying their dependence with the electrode's active mass loading and porosity at different discharge rates. The surface capacity and the porosity of all the composite electrodes studied here are given in Table I of our previous paper.17
Literature survey
Prosini postulated that  is related to the electrolyte resistance and charge transfer resistance.19 In the framework of the core-shell type models,1, 19 Prosini and Roscher et al.19, 21 related
  to a progressive increase of the solid state transport limitations, but these core-shell models have been invalidated.23–26 According to Srinivasan and Newman,
  would be related to the contact resistance at the current collector/composite electrode interface and to the electronic and ionic matrix resistances.
  would be associated with a moving reaction front across the electrode in the case of a low matrix electronic conductivity; this way, during the insertion the electrons travel through more resistive paths at increasingly larger distances to access the un-intercalated grains of active material. However, in the interparticle contact model of Stephenson et al. ,27 the increase of the polarization with the state of charge
  is attributed to the distribution of electronic connectivities/resistances between AM particles and the C/B network. Less-well-connected particles require large overpotentials in order to charge or discharge in the required time interval. At high rate, the lithium ion depletion within the liquid electrolyte into the porosity of the composite electrode is expected to contribute to the rise in overpotential. In the experimental work of Yu et al. ,15 it can be clearly noticed that the value of the potential plateau (that depends on
  ) is (i) independent on an electrolyte modification and thus on ionic conductivity, but is (ii) significantly decreased (increase in
  ) by a lower packing density that induces poorer electronic contacts at the interface between the current collector and the electrode, in the C/B network, and between C particles and AM grains. On the other hand, it can also be noticed a modification of the potential plateau slope (designed by
  here) only with a modification of the electrolyte. A less conductive electrolyte induces a steeper slope (higher
  ). By following only these experimental facts,
  would then be linked to electronic transport toward the active particles and
  would then depend on the ionic transport within the liquid electrolyte. We found that
  can be expressed as the sum of two resistances (Eq. 6),
  that depends on the active mass contribution, and
  that mainly depends on the electronic wires contribution. The expression of
  (Eq. 7) was proposed by Gaberscek and co-workers.28–31 They distinguish two limiting cases, whether the solid state reaction is much slower (case 1) or much faster (case 2) than the transport outside of the active particles of the electrons and ions. In the first case, making the assumption that each of the particles is individually electronically and ionically perfectly wired, the electrode resistance can be calculated according to Eq. 7.28–31 There are two cases in which Eq. 7 applies: if the electronic conductivity of the AM particles is much less than the ionic one (i), the particles have to be carbon coated. If the ionic conductivity of the AM particles is much less than the electronic one (ii), the AM particles have to be wetted by the liquid electrolyte over the whole surface. Here Eq. 7 can be applied since we are studying a carbon-coated active material and secondary AM particles have open porosity.17 Inverse proportionality with mass of the electrode is expected when all AM particles are supposed to be perfectly wired in parallel to the current collector and the electrolyte, they thus feel the same potential.
In the second case, i.e., when the limitation comes from the electronic and ionic wiring of the particles, the electrode resistance is expected to increase proportionally with the electrode mass (or thickness), as the average path traveled by charges along the resistive path (across interparticle contacts, through the electrolyte, etc.) is most likely proportional to the electrode thickness. Because both pathways run in parallel, the overall rate of transport of the charges from the respective reservoirs to the given particle should always be determined by the slowest type of charge.
In the experimental trials of Gaberscek and co-workers to verify their equations, the electrode resistance was defined by the ratio between the polarization and the current at a given state (50%) of discharge.30 At low current, i.e., below  , where case 1 (insertion reaction limited) is expected, the electrode resistance showed inverse proportionality with mass (thickness), in good agreement with Eq. 7, and their hypothesis that the electrode resistance reflects mainly the insertion reaction. At higher currents, where case 2 (transport limited) is expected, the electrode resistance was observed to be almost independent of the electrode mass, in contradiction to their expectations. Moreover, for a given electrode, the resistance was observed to decrease with the increase of the discharge rate. Proportionality between the electrode resistance and the square of the AM particle size was also observed experimentally.31 After this literature survey, the experimental evolution of the resistances
  and
and  with different parameters of our electrodes will be analyzed separately.
Study of the resistance 

Figure 2a shows  for several discharge rates, from 0.1 to 2C as a function of the active mass (which is directly linked to the electrode thickness for a given calendaring pressure), and Figure 2b shows
  for different active masses as a function of the discharge rate. Figure 2a and 2b are in line with some of the Gaberscek and co-workers' studies as
  seems to show rough inverse proportionality with mass at low currents (C/10-C/5), meaning that
  is, at these low rates, dominated by the insertion reaction inside the AM grains, thus depending on the AM conductivity
  and particle size (see Eq. 7). At high rate (C/2-2C),
  increases linearly with the active mass, meaning that the limitations now would mostly come from the environment of the grains, i.e., the electronic and ionic wires whose lengths increase with the electrode thickness. Moreover, Figure 2a and 2b stress that the increase of the discharge rate for a given electrode mass induces a reduction of
  . This would suggest an increase of the active particle conductivity with rate (see Eq. 7) that is emphasized below.
Figure 2. (a)  as a function of the active mass
  for different discharge rates (◼: C/10, △: C/5, ◆: C/2, ○: C, ●: 2C), 30%–35% porosity and (b)
  as a function of the discharge rate for three different electrode thicknesses (◼:
  , ◇:
, ◇:  ▲:
▲:  ), 30%–35% porosity.
The quantity  being the active material mass (in g) is plotted as a function of the mass current in Figure 3a. One can see that all the curves can be vertically shifted into a master curve by subtracting a term
  that gathers the contribution of the environment of the active particles, i.e., the wires, as shown later. The master curve is plotted in Figure 3b. This one shows that, after subtraction of the contribution
  , the electrode resistance does vary inversely with the active mass
  whatever the rate, as the quantity
  is independent of
  . Similarly, it can be seen in Figure 4 for electrodes with varying porosities that the
  versus specific current curves can also be vertically shifted into a master curve by subtracting a constant term
  . The obtained master curves are shown in Figure 4a and 4b, while raw data are shown as inset figures. A small discrepancy can be seen for the higher porosity 62%–63%.
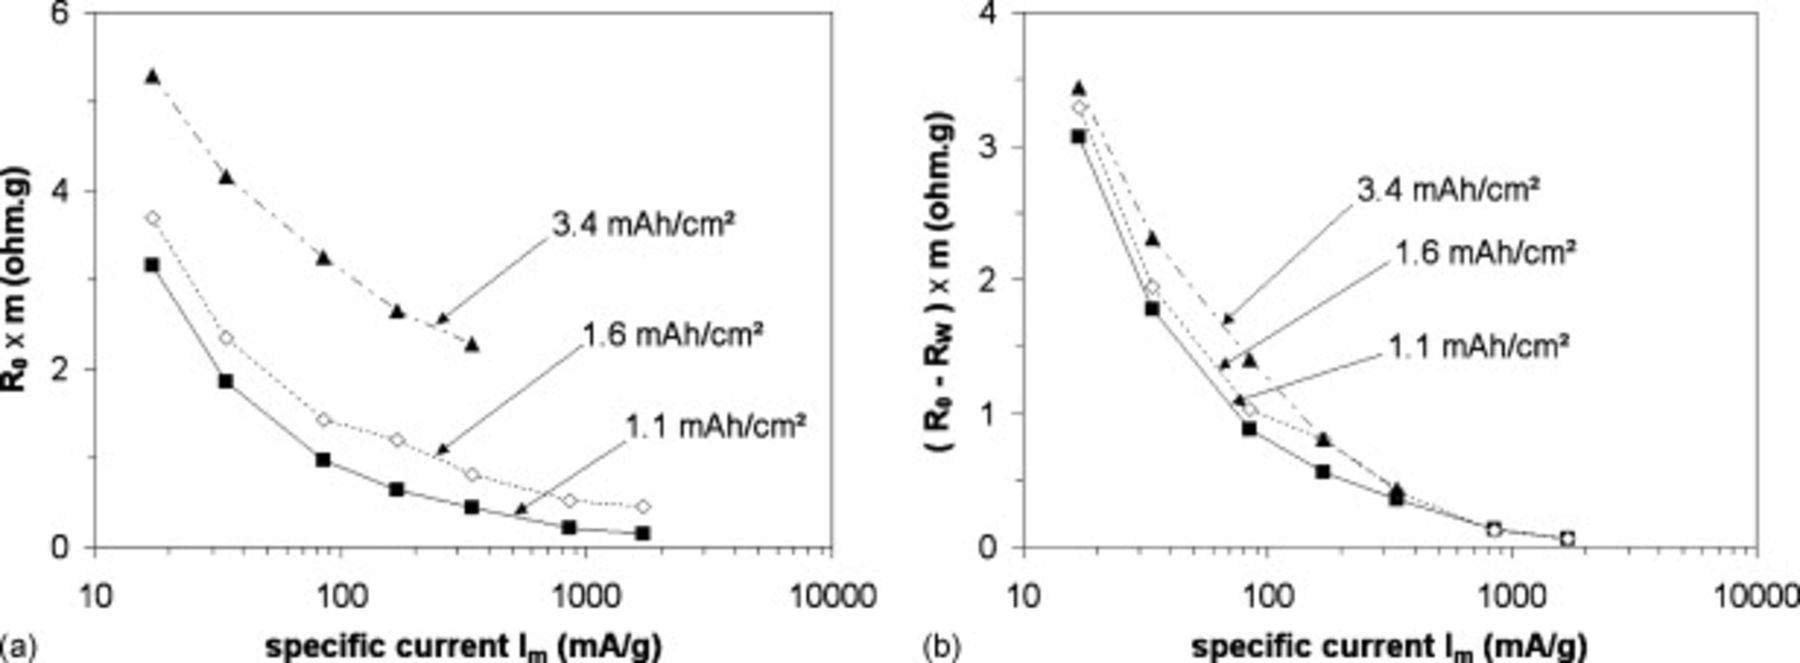
Figure 3. (a) Normalized resistances:  mass m (in g) and (b) normalized resistances vertically shifted by
  , as a function of the specific current for three different electrode thicknesses (◼:
  , ◇:
, ◇:  , ▲:
, ▲:  ), 30%–35% porosity.
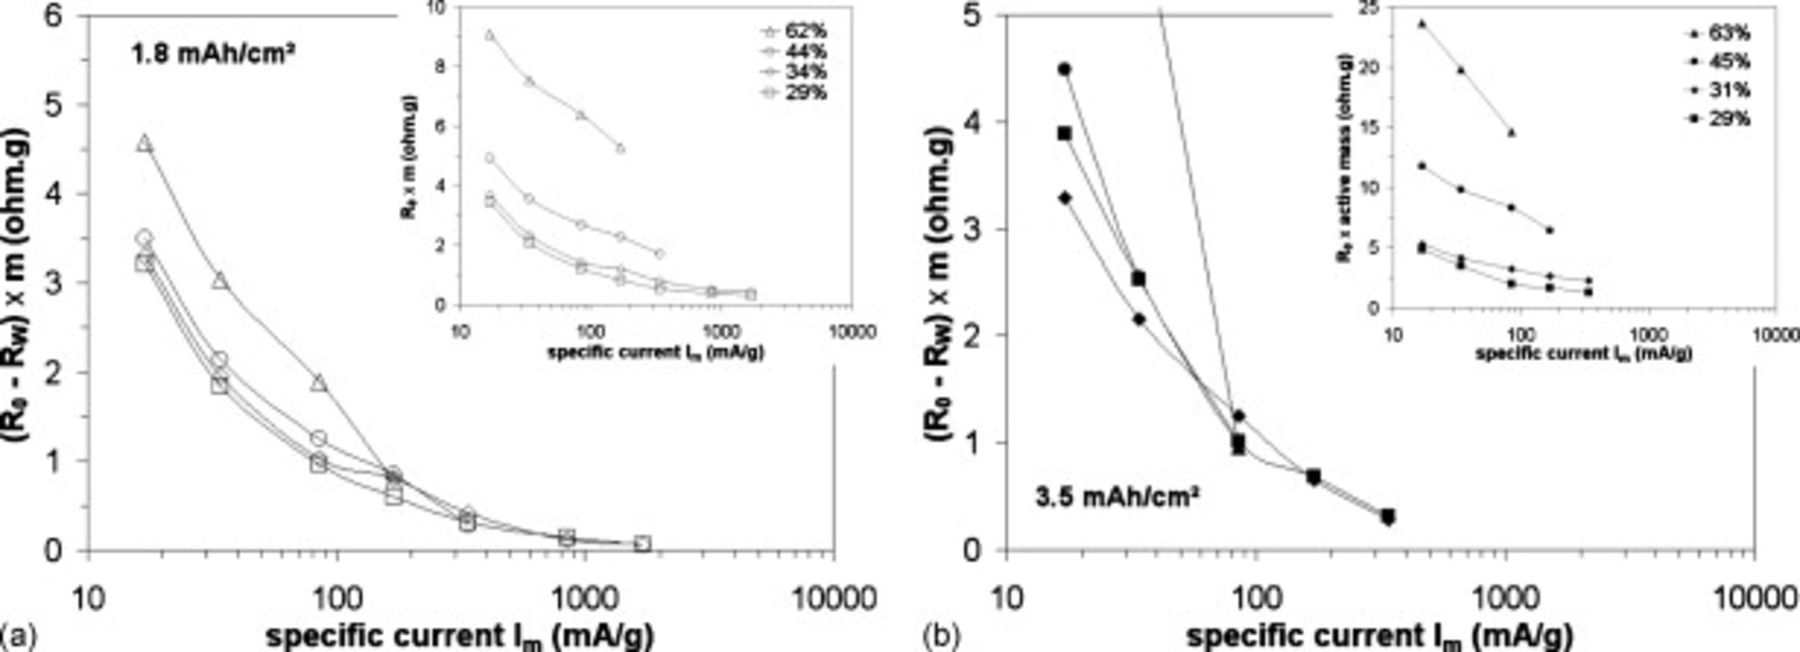
Figure 4. Normalized resistances shifted by  ×
×  , as a function of the specific current for different
  electrode porosities (▲-△: 63%–62%, ●-○: 45%–44%, ◆-◇: 31%–34%, ◼-◻: 29%) and for different electrode loadings (a):
  , (b):
  .
.
In all cases, a decrease of  with the specific current is observed which clearly suggests (see Eq. 7) an increase of the particle conductivity with an increase of the specific current (rate). The total conductivity of the active particles was calculated for several electrodes thanks to Eq. 7, substituting
  by
by  and taking into account the following values for the parameters ρ and
  :
:  and
and  . The total conductivity of the active particles is plotted as a function of the specific current in Figure 5. A linear increase of the total conductivity of the active particles is observed for rates from C/10 to 10C rate. The total conductivity of the active particles increases by almost a factor of 100, and values between
  and
and  are found for particles undergoing the insertion reaction. In their recent paper Zaghib et al. measure a value of
  for the bulk (dc measurements) electronic conductivity of
  .33
.33
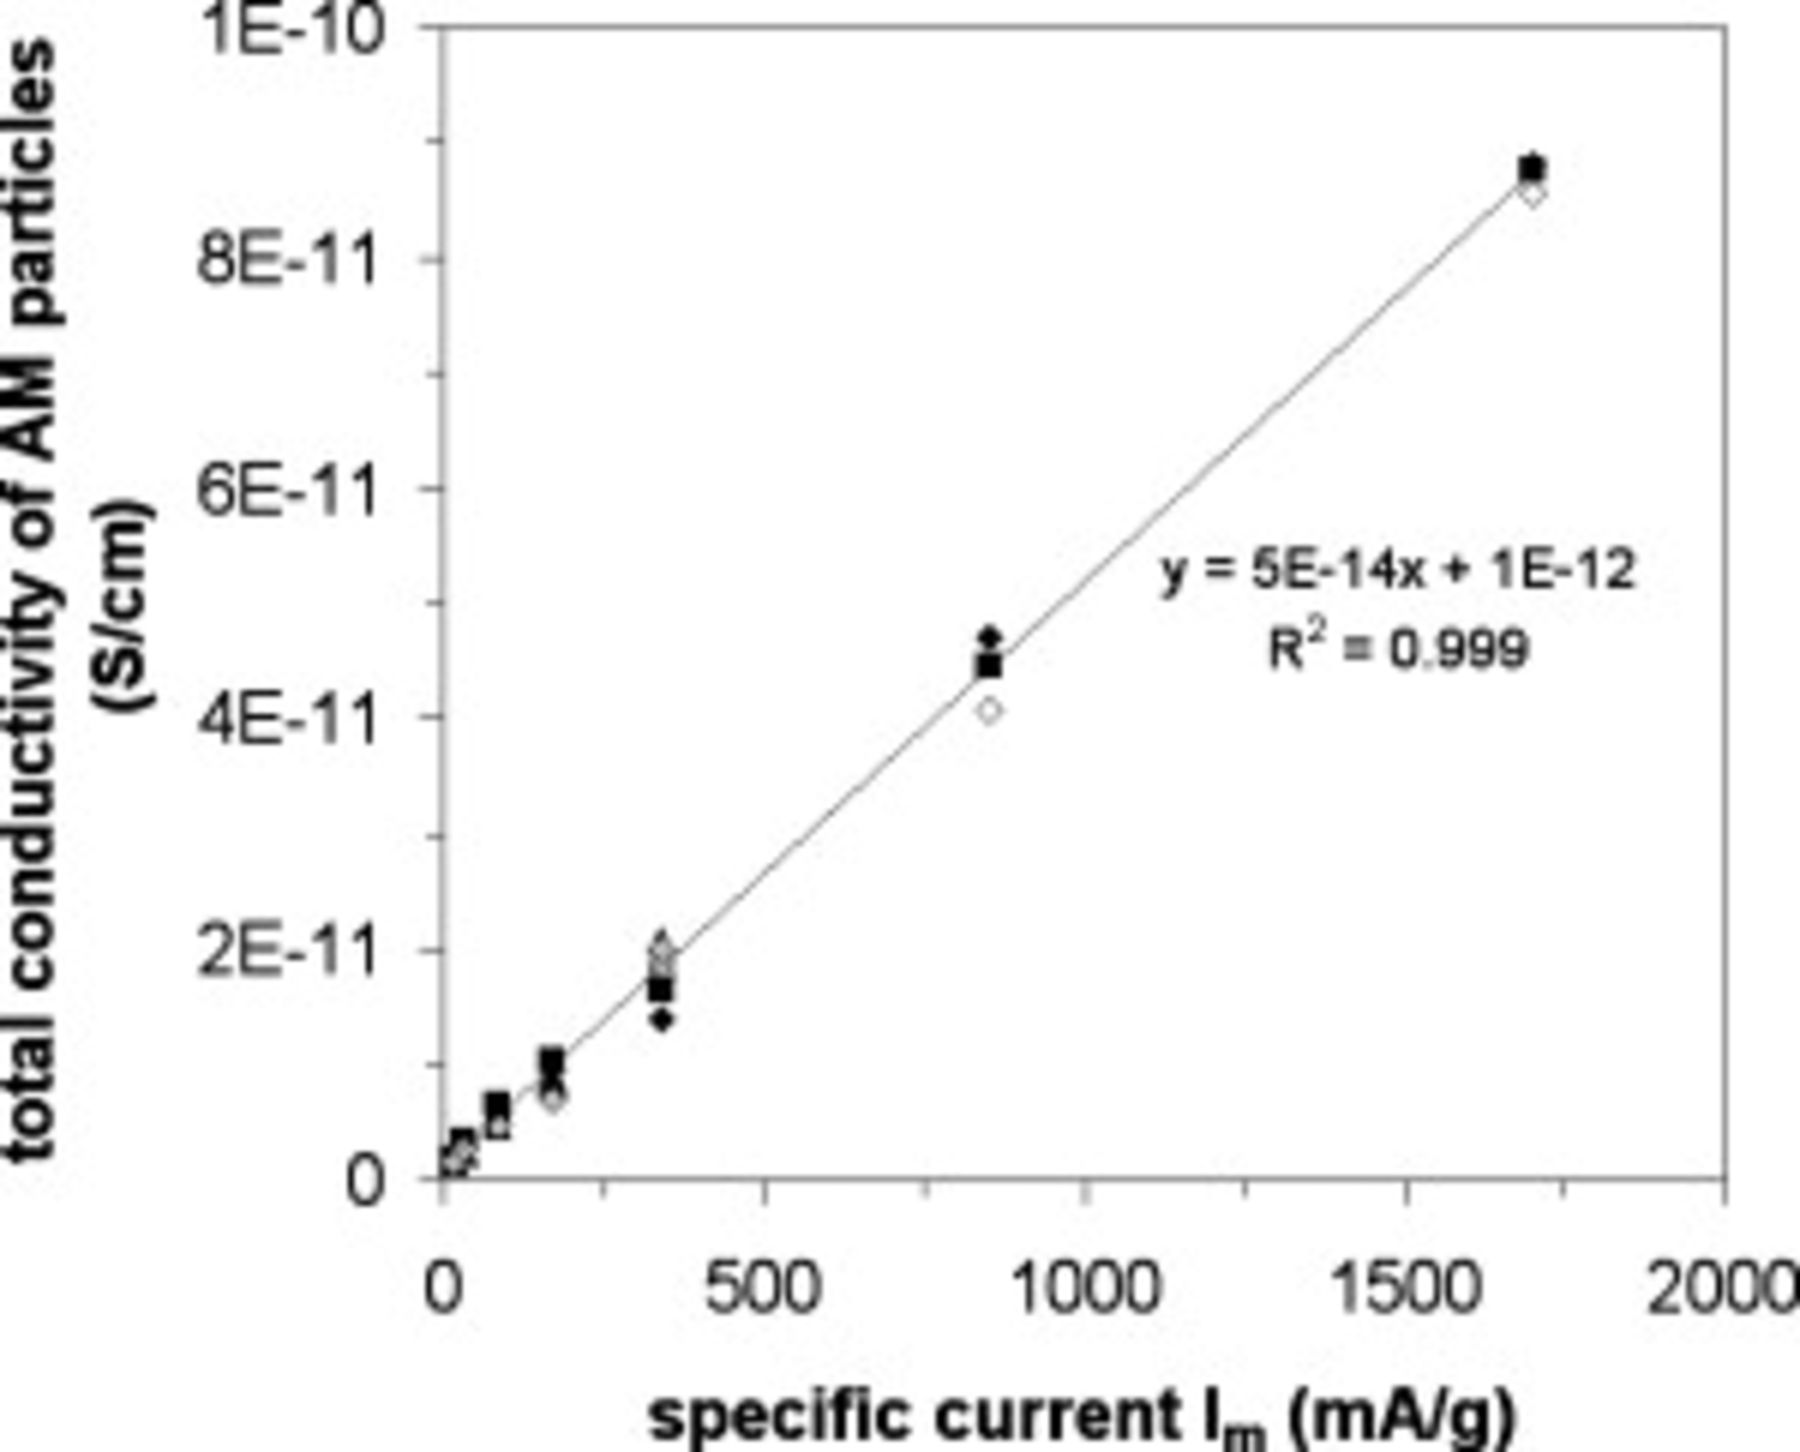
Figure 5. Total conductivity of the active particles (see Eq. 7 in Table I) as a function of the specific current for different  electrode loadings (▲:
  , ◆:
, ◆:  , ◼:
, ◼:  ) and for various porosities (open white symbols: 29%, full black symbols: 31%–34%, full gray symbols: 44%).
The fundamental interpretation of Fig. 5 is out of the scope of this paper. However, we would like to bring some ideas to discussion. The electronic conductivity of  is higher than the ionic conductivity.32 Electronic transport in
  is a small-polaron process and the electronic conductivity is of the form
  , with c the concentration of polarons.33 As c is small,
  and the variation of the electronic conductivity with the polarons concentration is linear. There is an interplay between ionic and electronic motion.34, 35 The improvement of the electronic conductivity enhances simultaneously the ionic conductivity.32, 36 When the rate is increased, the instantaneous concentration of charges injected in a given laps of time increases, thus increasing the polarons concentration and thus favoring the insertion reaction overall kinetics.
The quantity  is now studied by being presented as a function of the electrode loading and compared to the dry electrode resistance
  , or as a function of the electrode porosity and compared to the dry electrode resistivity
  and the wet electrode ionic conductivity
  [Figure 6a and 6b].
  and
and  were determined with a two point probe measurement.
  was calculated with the well known formula
  ,37 with
  the liquid electrolyte conductivity
  ,38 ε is the void volume fraction of the porous electrode filled with electrolyte, and α is the Bruggeman exponent, equal to 3.8 in the case of the electrodes studied here.17 Following the experimental study of Yu et al.15 we can prone the hypothesis that the parameter
  likely represents the contribution of the electronic wires. In Figure 6a, one can see that
  increases with the electrode loading as the electronic resistance of the electrode
  does. The latter is not expected to be equal to
  , because the electronic wires are constituted of the contact resistance at the current collector/electrode interface,39 the C/B percolation network,40 the contact resistances between this C/B network and the AM particles that depends on the electrode processing,14, 41–44 and finally the carbon coating;45 while the dry electrode resistance, as measured here (see Experimental section), is mostly influenced by the contact resistance at the current collector/electrode interface and the C/B percolation network that short circuits the contacts between this network and the AM particles.46 In Figure 6b, an increase of
  with an increase of the porosity can be seen as expected if
  captures the contribution of the electronic wires. Actually, the measured electronic resistivity of the electrode increases when the porosity increases while a decrease of the ionic resistivity of the electrode is calculated, in agreement with existing literature.47
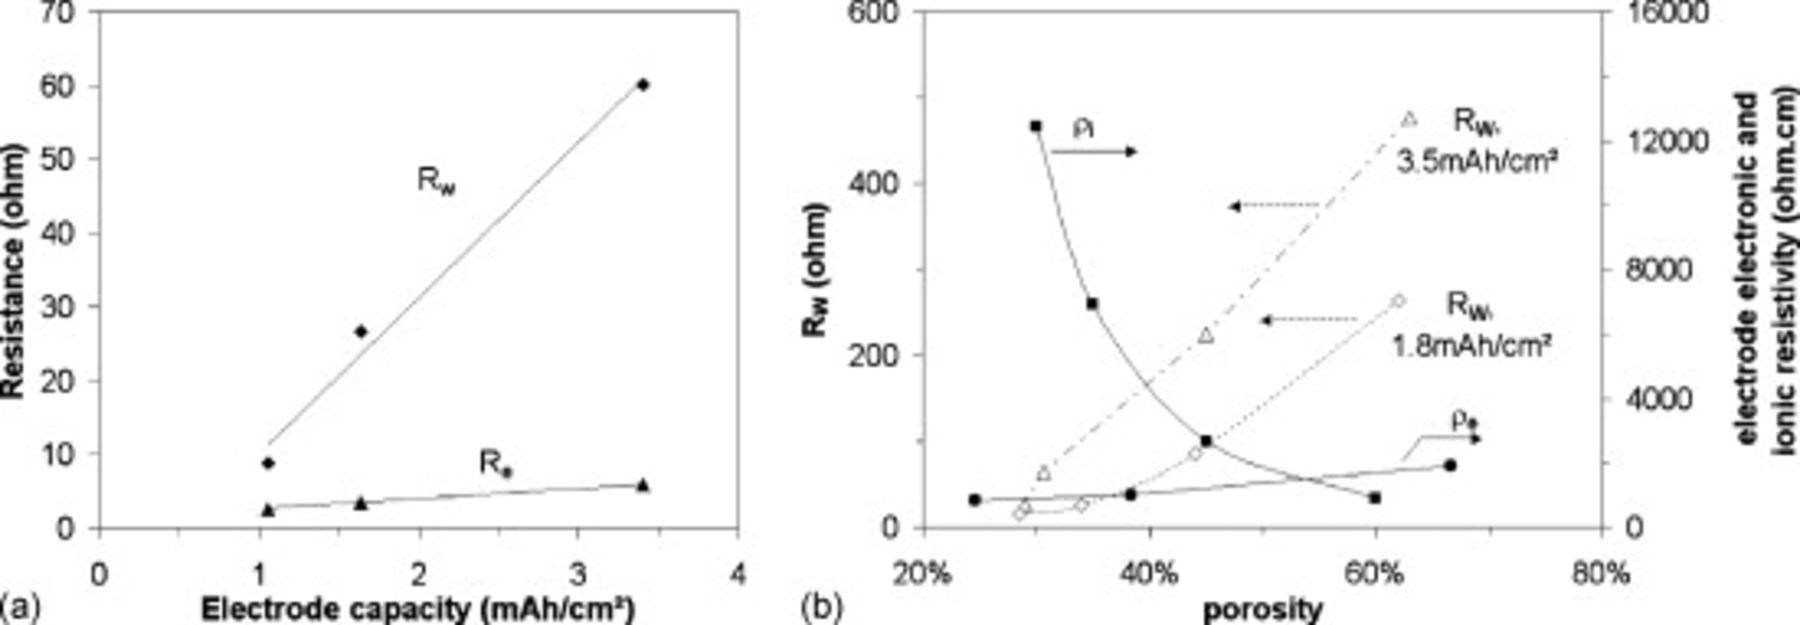
Figure 6. (a)  , the shift resistance, as a function of the
  electrode loading compared to
  , the electrode electronic resistance and (b)
  as a function of the electrode porosity for different electrode loadings (◇:
  , △:
, △:  ) compared to the electronic (●) and ionic (◼) resistivities.
Note that  comes from the extrapolation of the plateau in potential at insertion degree
  in
in  [Fig. 1b]. Thus, any variation in the electronic and ionic conductivity of the particles with
  would not be collected in this parameter.
Study of the resistance

Figure 7 shows that  does not vary as
  does with the electrode thickness; the trends observed are even opposed.
  is independent of the electrode thickness (i.e., electrode mass) at low current whereas it strongly increases at higher currents in a proportional way with the thickness [Figure 7a] or the AM loading [Figure 7b]. This suggests
  reflects a contribution of the matrix, as a variation of
  is observed only at high currents where the transport of the charges outside of the AM grains becomes rate-limiting. The increase of
  with the electrode thickness is in agreement with the idea of a distribution wiring, i.e., various conducting paths lengths.
  is also observed to strongly depend on the electrode's porosity [Figure 8a and 8b], which confirms that it depicts a contribution of the matrix.
  is minimal for porosities in the 30%–40% range. This interval of porosity corresponds to the best compromise between optimal electronic and ionic wirings.17 As highlighted in Figure 6b, lowering the porosity strongly increases the ionic resistivity of the composite electrode. Conversely, high porosity electrodes suffer from electronic limitations characterized by an increase of the electronic resistivity with an increase of the porosity [Figure 6b].
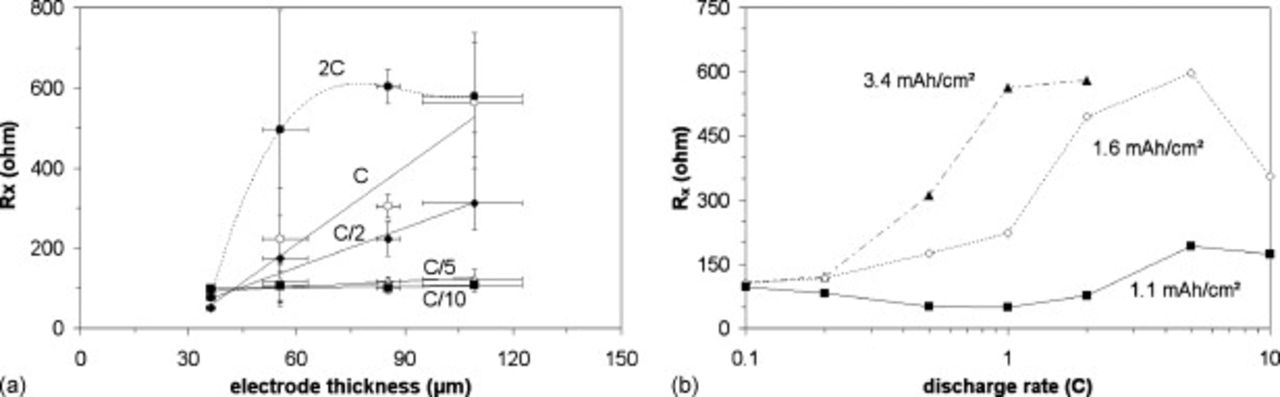
Figure 7. (a)  as a function of the
  electrode thickness for different discharge rates (◼: C/10, △: C/5, ◆: C/2, ○: C, ●: 2C) 30%–35% porosity and (b)
  as a function of the discharge rate for three different
  electrode thicknesses (◼:
  , ◇:
, ◇:  ▲:
▲:  ), 30%–35% porosity.
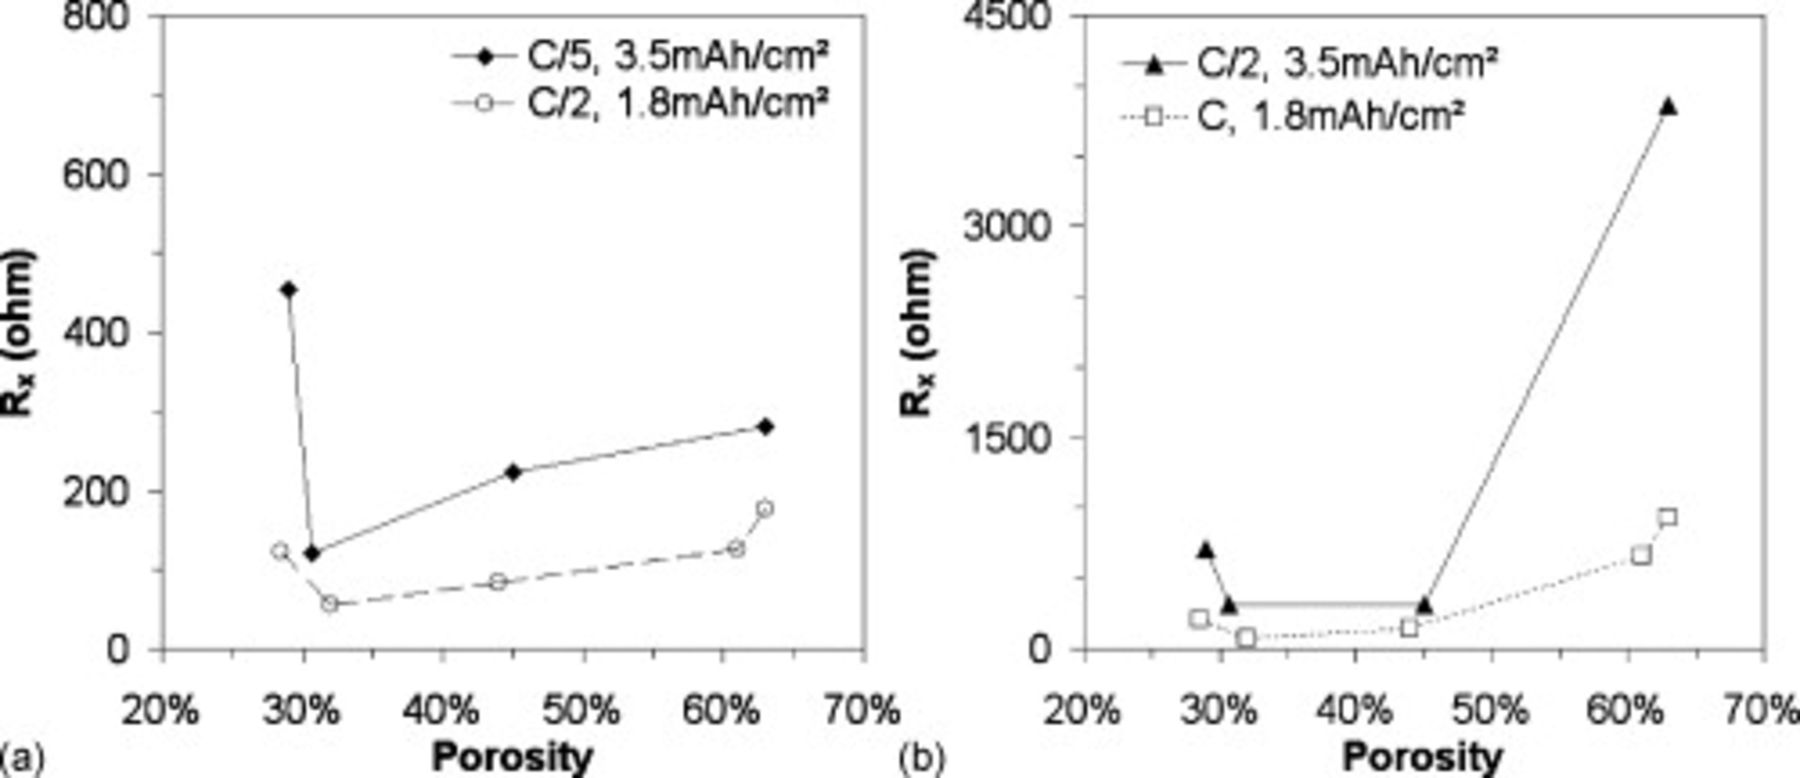
Figure 8.
 as a function of the porosity for different electrode loadings (
 ,
,  ) at (a) low and (b) higher discharge rates
For the very high currents (2C), the leveling of  with the electrode thickness [Figure 7a] or the decrease of
  with the current rate
  [Figure 7b] may reveal a Joule self-heating effect leading to an increase of the ionic conductivity of the liquid electrolyte.21 The increase of
  with the discharge current at a given electrode mass could be explained as follows: when discharge proceeds at a high current rate, the
  charge transfer exceeds the
  transport within the liquid electrolyte, which leads to a decrease of the
  salt concentration and thus to a decrease of the ionic conductivity leading to an increase of
  .16 This effect happens at low rates for thicker electrodes due to more rapid depletion of
  concentration in some remote parts of the electrode far from the electrolyte reservoir.
Conclusion
The different contributions to the polarization of a  electrode have been discriminated experimentally in this work. The electrode resistance can be decomposed in two terms,
  and
and  , the latter quantifying the increase of
  with the insertion degree.19
We showed that  can be expressed as the sum of the active mass contribution and the electronic wires one, the latter denoted as
  . The term in
  associated with the lithium insertion reaction in the active material particles follows the predictions of Gaberscek and co-workers.28–31 We showed here that the resistance to lithium insertion decreases with increasing of the specific current, a feature that suggests an increase of the active particle conductivity with rate.
  captures the combination of the contact resistance at the current collector/electrode interface, the resistance of the conductive additive/binder network, the contact resistances between this network and the active mass, and the resistance of the carbon coating. At low rate,
  is dominated by the resistance to lithium intercalation into the active material, while at high rate, the active material conductivity being higher,
  is now dominated by the contribution of the electronic wires.
 , which is very sensitive to the electrode porosity, seems to be mainly dominated by the resistances of the electronic and the ionic wires, the former being more important in the case of electrodes with low compaction, while the latter being more important in the case of electrodes with high compaction. A porosity in the 35%–40% range allows to optimize
  .
.
We believe that our new methodology to decompose the different contributions to the polarization of a  electrode will enable a more rational optimization of the electrode formulation and processing conditions, which otherwise must be optimized by "try and see" experiments. Moreover, it provides, among others, a unique way to discriminate the controversial role of doping, as a conductive impurity would be reflected in
  and not in the resistance term associated with the lithium insertion.
Acknowledgments
C. F. gratefully acknowledges ADEME (Agence De l'Environnement et de la Maîtrise de l'Energie) and CEA/INSTN (Commissariat à l'Energie Atomique et aux Energies Alternatives/Institut National des Sciences & Techniques Nucléaires) for financial support of her Ph.D.
Centre National de la Recherche Scientifique assisted in meeting the publication costs of this article.