
Abstract
A set of lithium-ion cells containing a  -based positive electrode and a graphite negative electrode were cycled nonintrusively at high power (5C rate) and elevated temperature
  . The aged cells were characterized at prescribed cycle numbers (up to 5250 cycles) by a three-electrode cell, capacity measurement, and electrochemical impedance spectroscopy (EIS). Excellent cyclability of these cells under typical hybrid-electric vehicle conditions is demonstrated by 18% capacity fade after 5250 cycles, and the discharge capacity shows a mainly parabolic behavior with the cycle number
  (dependent on
  ) in the initial stage and a linear behavior (dependent on
  ) for subsequent cycles. Using a lithium reference electrode further reveals that the capacity fade during cycling is primarily caused by the positive electrode, where discharge capacity may be limited by a decrease in active lithium intercalation sites in the oxide particles. The increase in full-cell impedance with cycling is evident from the increase in midfrequency arc width
  , composed of charge-transfer kinetic resistance
  and
and  transport resistance through the solid electrolyte interphase (SEI),
  . More specifically, the cell-impedance rise comes mainly from the rising
  and
and  of the positive electrode. Based on individual electrode EIS spectra and equivalent-circuit analysis, it is found that the
  rise in the positive electrode is far more influential than the change in
  . Therefore, property modification and thickening of the SEI layer of the positive electrode during cycling appear to be dominant factors in cell-impedance rise and power fade.
Export citation and abstract BibTeX RIS
High energy and power, along with high safety, excellent cycle life, and low cost, are required for the commercialization of lithium-ion batteries for electric vehicles (EVs) and hybrid EVs (HEVs). Substantial research has been carried out on both the chemical stability of various cell materials and the electrode–electrolyte interface, which is critical to the cycle life and calendar life of lithium-ion batteries.1, 2 Unfortunately, capacity fade and impedance rise over cycle life is still a major barrier to automotive application. Capacity fade of lithium-ion batteries is generally associated with structural and chemical changes in electrode materials (e.g., volume change, phase transition, and dissolution). Electrolyte decomposition occurs as well as the formation and growth of passivation layers on the electrode–electrolyte interface such as the solid electrode interphase (SEI). Corrosion of current collectors, loss of electronic contact between active particles and with current collectors, and lithium plating at low temperature or overcharge conditions also contribute to capacity fade.3–6 These processes lead to the decrease in cyclable lithium, loss of active materials, and rise of cell impedance.7, 8 On the other hand, power fade is directly related to cell-impedance rise.3, 6 The influence of cell-impedance rise on power fade is presented in a follow-up publication.
This work encompasses two primary objectives. The first is to understand the chief mechanisms of degradation in lithium-ion batteries using a  -based positive electrode (LNCAO) and a graphite negative electrode that are cycled under typical HEV conditions (high rate and deep depth of discharge, especially for plug-in HEVs). The second goal is to document a quantitative database of capacity fade and impedance rise with cycle number through accelerated testing for extensive cycles representative of HEV application. These data will enable high fidelity, model-based cycle-life prediction under dynamic HEV conditions. Presently, a quantitative database for lithium-ion cell aging that is suitable for the validation of fundamental life models5, 7, 8 is absent in the literature.9 There is a lack of systematic experimental data for automotive lithium-ion cells designed and operated under HEV conditions, aged over the many thousands of deep cycles characteristic of HEV applications. Moreover, a detailed diagnosis is required by using a reference electrode such that positive- and negative-electrode contributions to both performance and degradation can be separately delineated.
 oxides under consideration in this work have become attractive positive-electrode materials with high capacity and good cycling stability.1, 2, 10–15 They are a completely solid solution of lithium nickel oxide
  and lithium cobalt oxide
  , but circumvent their individual disadvantages while they all have the same rhombohedral layered structure as the
  structure.14, 16, 17 The theoretical capacity of
  is 274 mAh/g, but only 50% of lithium
  can be reversibly deintercalated because deep lithium extraction beyond 0.5 per formula unit brings structural instability. This results from cobalt dissolution18 or oxygen loss19 with overcharge above 4.2 V vs
  . In contrast to the high cost and toxicity of cobalt in
  ,
,  is cheaper and has higher capacity, but its reversible hexagonal–monoclinic phase transitions lead to poor cycling stability.13–15 Co substitution in
  significantly improves the structural stability and cyclability.17, 20–24 Additional aluminum doping further stabilizes the structural properties as well as inhibits the cell-impedance growth and enhances capacity/power retention and thermal stability.2, 15, 25–27 Accordingly, a
  -type material (
 ,
,  ) holds great promise for commercial use in batteries for EV and HEV applications.
The SEI layer formation at the electrode–electrolyte interface plays a critical role in the capacity and power fade of a Li-ion cell; specifically it slows down the  transport to the electrochemical active sites, thus leading to the increase in interfacial impedance.28–30 The growth of the SEI layer and its changes in composition, thickness, and properties (e.g., porosity, diffusivity, and conductivity) further increase the interfacial impedance and ensuing power fade. For example, the surface layer on
  particles was
  thick after 43% power fade, while the surface layer was only
  thick at zero power fade.30 Simultaneously, the impedance rise reduces cell capacity by lowering the operating voltage range, and isolation or obstruction of the electrode surface by the SEI layer may reduce the accessible active surface area, resulting in capacity fade.3, 5, 8 Effects of SEI layer and ensuing interfacial impedance are characterized in detail in the present work using electrochemical impedance spectroscopy (EIS)31–35 along with a three-electrode cell equipped with a reference electrode to separate the negative from the positive-electrode contributions.36–42
Experimental
Lithium-ion cells in 18650 cylindrical configurations were fabricated using LNCAO, a graphite negative electrode, and an electrolyte of  in ethyl carbonate–ethyl methyl carbonate mixture. The cells underwent five formation cycles (at 0.25C rate and four 1C rates). Then six identical cells were selected with less than 2% difference in capacity and impedance before cycling tests. The cells have a nominal capacity of 0.8 Ah, namely, 159 mAh/g LNCAO.
With one cell serving as a fresh cell, the other five cells were first conditioned by five cycles of charge/discharge at 1C rate (0.8 A) in the voltage range of 3.0–4.1 V at  before accelerated cycling at 5C rate between 3.0 and 4.2 V at
  . The conditioning at
  and cycling at
  both started after 4 h of rest at each temperature for the cell interior to reach thermal equilibrium. Five cells aged to five different cycle numbers plus one fresh cell were thus obtained. These cells at fully discharged state (discharge to 2.7 V at 1C rate) were subsequently opened and assembled into a three-electrode cell holder with a lithium-metal reference electrode. A copper wire with one end flattened was fitted in polyethylene tubing, and a lithium-metal foil was cold-welded to the flat surface to form a lithium reference electrode. The other end of the copper wire provided electrical contact. The lithium reference electrode was then inserted into the fitting in a cell holder as shown in Fig. 1. Next, the cell holder was filled with the same electrolyte as the cell. Both the opening of the cells and the assembly of the three-electrode cells were completed in an argon-filled glove box (MBraun Labmaster100), where oxygen and moisture levels were less than 1 ppm.
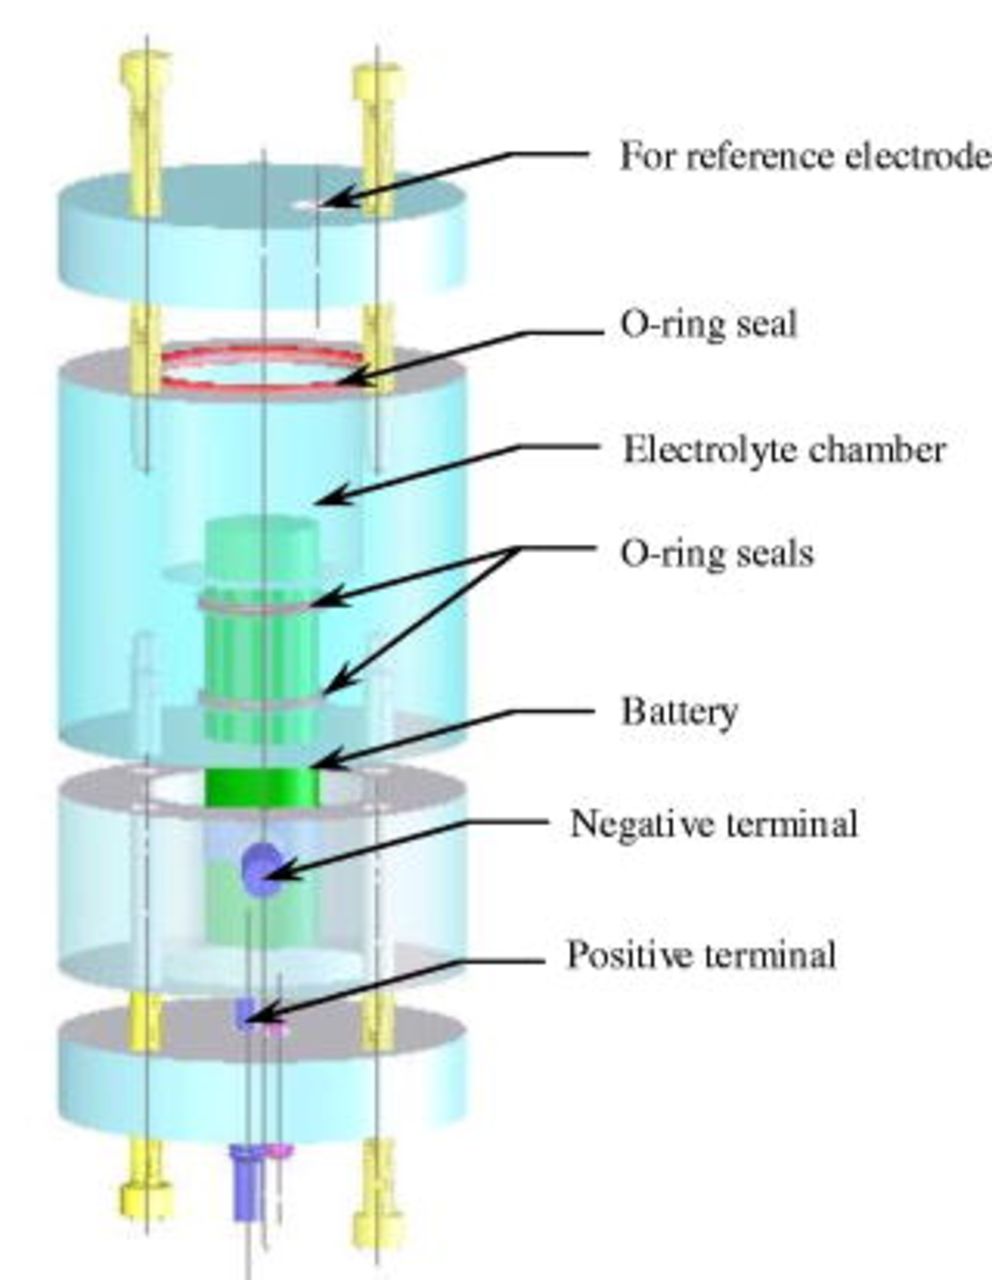
Figure 1. Structure and components of cell holder for a three-electrode cell with a lithium-metal reference electrode.
Capacity characterization and EIS were carried out at temperatures of 50, 25, 0, and  on six three-electrode cells (one fresh cell and five aged cells cycled at different cycle numbers). The constant-temperature environment was maintained by a Tenney Environmental Chamber (Series 942) for all tests. Before testing at each temperature except at
  , the cells were rested 4 h to reach thermal equilibrium. Before the tests at
  , the cells were rested for at least 1 h. An Arbin BT-2000 battery cycler was employed for cycling and capacity measurement. Capacity tests were performed by a constant current (CC)–constant voltage charge and CC discharge protocol. In this way, the cell was charged at 1C rate (0.8 A) to 4.1 V and held at 4.1 V until the current dropped to C/40 (0.02 A) followed by 10–40 min rest and discharging at 1C rate until a cell cutoff voltage of 3.0 V. The rest time between charging and discharging was 10 min at 50 and
  , 20 min at
  , and 40 min at
  for the cell to come close to a diffusion equilibrium state. A Solartron SI 1287 electrochemical interface coupled with a Solartron SI 1255B frequency response analyzer was used for EIS measurement after the cell was discharged from a fully charged state at 1C rate to 3.90 V [
 state of charge (SOC)] and then held at the voltage for 1 h. The impedance spectra were obtained with an ac amplitude of 5 mV over the frequency range from 50 kHz to 0.005 Hz.
Results and Discussion
Capacity fade
Discharge curves for full-cell voltage vs discharge capacity, as shown in Fig. 2a, were measured on the three-electrode cells at 1C rate and  in the 3.0–4.1 V range. A distinct capacity fade is seen, with cycling of up to 18% after 5250 cycles, in comparison with the initial capacity of 0.776 Ah, or 155 mAh/g LNCAO for a fresh cell after formation cycles. Nonetheless, this retention capacity of 127 mAh/g LNCAO after 5250 cycles demonstrates excellent cyclability of these cells.
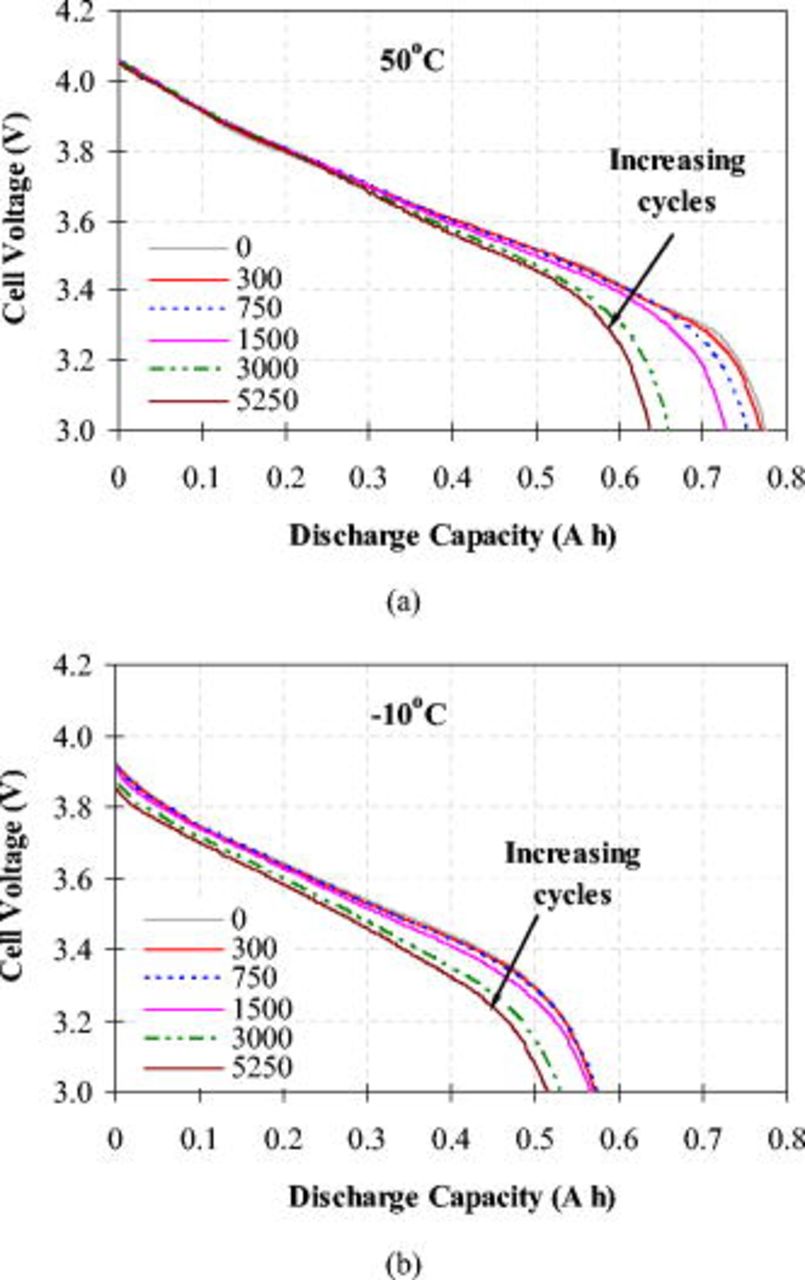
Figure 2. Discharge curves from 4.1 to 3.0 V at 1C rate: (a) Measured at  and (b) measured at
  after various cycles.
At  , predominant cell degradation is evident in the low cell voltage region with high depth of discharge (DOD), and the discharge curves show a slight difference in the low DOD region (cell voltage greater than 3.7 V) from 0 to 5250 aging cycles. In contrast, the discharge curves at
  , shown in Fig. 2b, demonstrate some voltage loss in the low DOD region with increasing cycles. The increase in cell impedance upon cycling at
  is thought to be mainly responsible for the voltage loss in the low DOD region. In comparison, there is a slight impedance rise with cycling at
  as there is negligible voltage loss in the low DOD region. As such, the strong temperature dependence of discharge voltage can be seen in Fig. 3 for a fresh cell, where the discharge capacity is reduced by 7.5, 19.5, and 26.4%, respectively, at 25, 0, and
  with respect to
  .
.

Figure 3. Discharge curves of a fresh cell from 4.1 to 3.0 V at 1C rate measured at different temperatures.
Figure 4a plots the positive- and negative-electrode potentials measured from the three-electrode cells, and it is indicated that capacity fade over cycling comes primarily from the LNCAO positive electrode. The change in the positive-electrode potential vs the lithium reference electrode,  (pos.–ref.), is greater than 1.0 V when the full cell discharges from 4.1 to 3.0 V at 1C rate, whereas the potential change on the negative electrode is less than 0.1 V. Furthermore, the positive-electrode potential drops quickly near the end of discharge and the onset of the quick potential drop occurs earlier after 5250 cycles than seen in the fresh cell. However, the negative electrode is able to readily provide sufficient current (0.8 A) with low polarization (less than 0.1 V) even after 5250 cycles. Thus it follows that capacity fade of the full cell is controlled primarily by the positive electrode. While this observation confirms the earlier conclusion on Li-ion cells containing
  cathode and graphite anode,10, 11, 43 the present work provides experimental evidence up to 5250 cycles, far more than most cycling data available in the literature (for instance, 1000 cycles in Ref. 10). The discharge curves in Fig. 4b show that the full-cell voltage is consistent with the difference of two electrode potentials [
 (pos.–ref.)–
 (neg.–ref.)] with a discrepancy of less than 5 mV. This demonstrates that the installation of the lithium reference electrode did not interfere with cell operation.
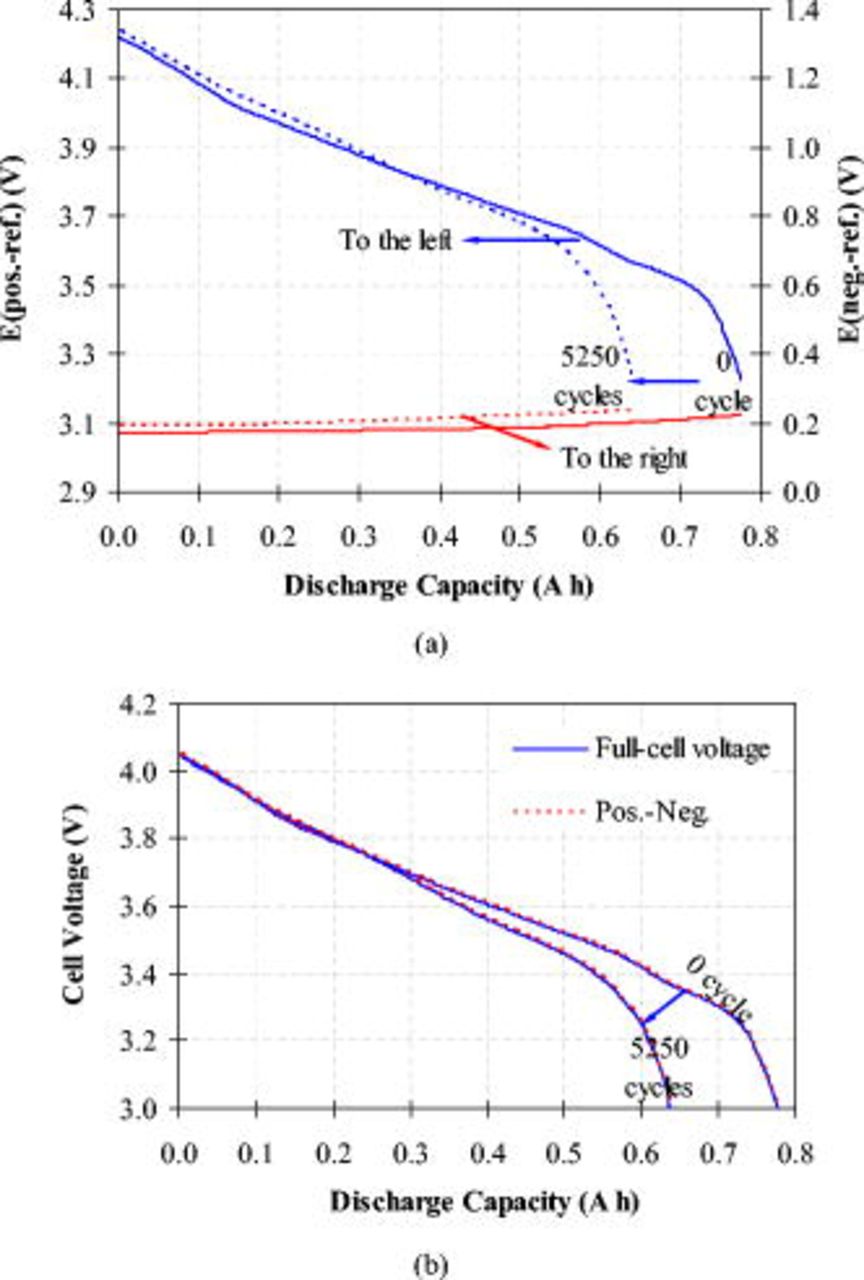
Figure 4. Discharge curves measured at  after 0 and 5250 cycles: (a) Comparing
  (pos.–ref.) and
  (neg.–ref.), i.e., electrode potential vs lithium reference electrode, respectively, on positive and negative electrodes; and (b) comparing full-cell voltage and the difference of
  (pos.–ref.) and
  (neg.–ref.).
The rapid voltage drop seen near the end of discharge in Fig. 2a for full-cell voltage is similar to that shown in Fig. 4a for the positive-electrode potential. This rapid voltage drop results from the strong polarization on the positive electrode at the end of discharge due to intercalation difficulty and low ionic conductivity with the depletion of available intercalation sites in oxide particles.17, 21 Consequently, the capacity fade with cycles is mainly ascribed to the reduction in the available sites for lithium intercalation, which becomes a limiting factor at the end of discharge. This may be caused by structural conversion (including increase in crystalline defects) or dissolution of the oxide particles and isolation or blockage of solid-phase precipitation on the active particle surfaces.3–6, 8, 10 Another reason for the loss of lithium intercalation sites may be the formation of inactive Ni ions disabling Li intercalation, as claimed most recently.11 Lower temperatures further exacerbate the capability of lithium intercalation because before lithium intercalation, fewer lithium ions are extracted from oxide particles when fully charged to 4.1 V, due to higher impedance at lower temperature.
The discharge capacity at different temperatures is plotted in Fig. 5 as a function of cycle number  . Nonlinear regression was performed to fit the capacity fade curves and it is shown that there exists a paralinear behavior with cycle number that is a mainly parabolic behavior (dependent on
  ) in the initial stage, followed by a gradual transition to linear behavior (dependent on
  ) for the later cycles.44 The paralinear behavior can be described by a correlation
  , where
  is the capacity of the fresh cell, and
  and
and  are the parabolic constant and the linear constant, respectively. The values of the constants (
 ,
,  , and
, and  ) and the regression coefficient
  are given in Table I. The values of
  are greater than 0.93 at all four temperatures, indicating that the application of the paralinear equation provides a good fit of the experimental capacity fade with aging cycles. The cycle number
  at which the capacity shifts from mainly parabolic to linear behavior depends on the relative magnitude of the parabolic and linear constants (i.e.,
  ). If one defines
  , it is easily seen that the major contribution to the capacity comes from the parabolic portion when
  , whereas it comes mainly from the linear portion when
  . At
. At  ,
,  , and consequently, the capacity appears to primarily obey a parabolic dependence below 2681 cycles. At the lower temperatures,
  is much lower than that at
  (see Table I). The parabolic constant,
  , increases with decreasing temperature and is even positive at 0 and
  when the capacity slightly increases through certain initial
  cycles. However, the linear constant,
  , is nearly the same within the experimental error for all temperatures.
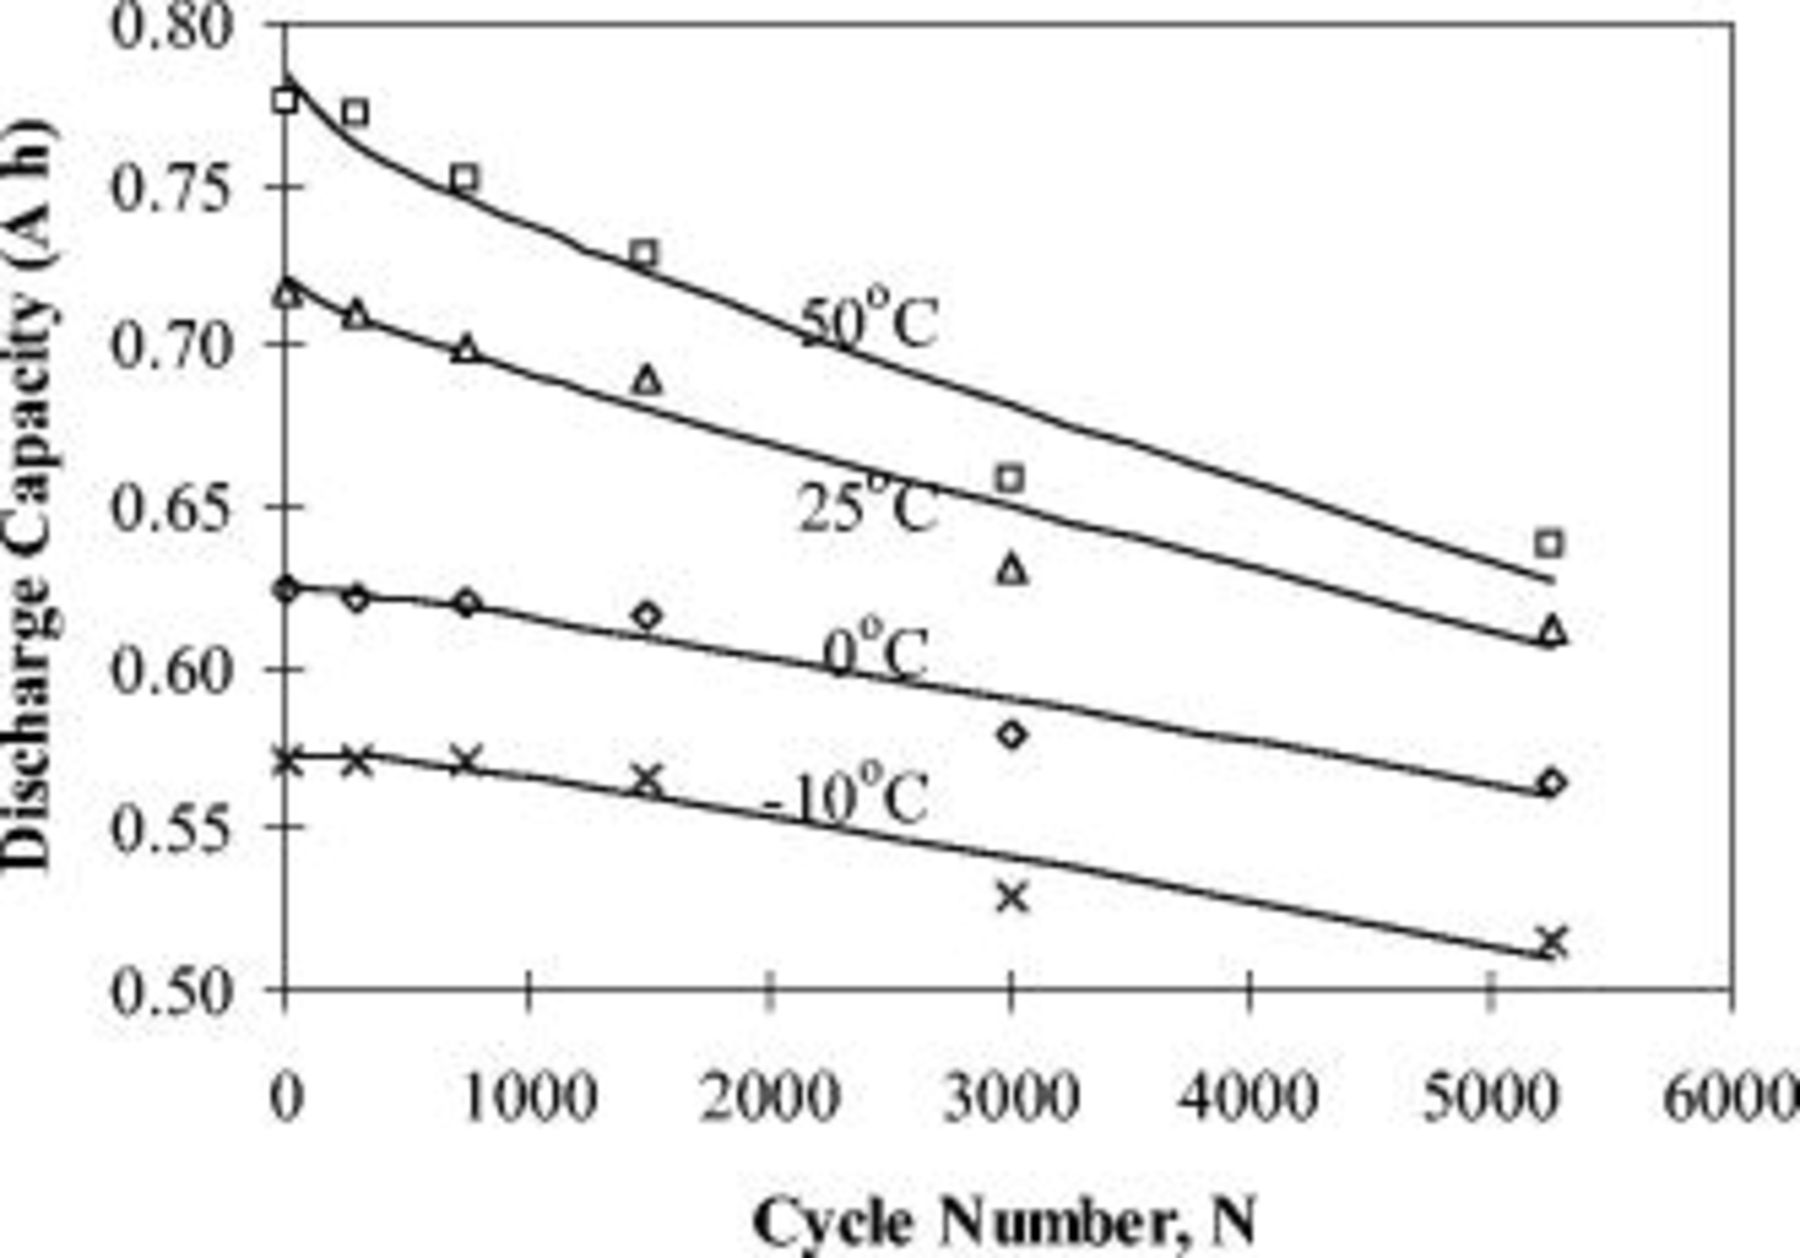
Figure 5. Discharge capacity at different temperatures as a function of cycle number  .
.
Table I. Values of the constants ( ,
,  , and
, and  ) and the regression coefficient
  fitted for discharge capacity in Fig. 5 as a function of cycle number
  .
.
Temperature |
 (Ah) (Ah) |
 (Ah) (Ah) |
 (Ah) (Ah) |
 |
 |
|---|---|---|---|---|---|
| 50 | 0.783 |
 |
 | 0.950 | 2681 |
| 25 | 0.721 |
 |
 | 0.948 | 716 |
| 0 | 0.625 |
 |
 | 0.945 | 89 |
| −10 | 0.572 |
 |
 | 0.934 | 339 |
Table II. Fitting parameter values for the impedance spectra of positive electrode measured at  with cycling in Fig. 14a.
| Cycle no. | 300 | 750 | 1500 | 3000 | 5250 |
  | 1.03 | 1.03 | 1.08 | 1.12 | 1.12 |
  | 39.8 | 41.3 | 44.6 | 44.4 | 44.2 |
  | 3.76 | 3.16 | 3.18 | 2.82 | 2.60 |
  | 19.7 | 22.1 | 24.8 | 32.1 | 38.1 |
  | 0.41 | 0.43 | 0.69 | 0.82 | 0.35 |
  | 5.3 | 4.5 | 6.6 | 6.3 | 9.4 |
σ  | 3.23 | 3.69 | 4.33 | 4.69 | 4.67 |
 | 0.67 | 0.64 | 0.62 | 0.61 | 0.61 |
Table III. Fitting parameter values for the impedance spectra of positive electrode measured at  with cycling in Fig. 14b.
| Cycle no. | 300 | 750 | 1500 | 3000 | 5250 |
  | 1.07 | 1.06 | 1.06 | 1.09 | 1.09 |
  | 45.5 | 45.8 | 46.1 | 46.4 | 45.5 |
  | 2.62 | 2.33 | 2.67 | 2.54 | 2.30 |
  | 60.9 | 68.3 | 68.9 | 87.1 | 103.0 |
  | 0.37 | 0.42 | 0.42 | 0.41 | 0.31 |
  | 19.7 | 22.3 | 26.9 | 30.2 | 32.3 |
σ  | 6.57 | 7.71 | 8.28 | 9.11 | 9.86 |
 | 0.57 | 0.54 | 0.53 | 0.52 | 0.50 |
As shown in Fig. 6, discharge capacity decreases exponentially with the reciprocal of temperature  following the Arrhenius equation,
  , where
  represents discharge capacity,
  is a constant,
  is the activation energy,
  is the gas constant, and
  is the absolute temperature. The activation energy
  can be obtained from the curves shown in Fig. 6 and is seen to decrease from 3.6 kJ/mol at 0 cycle to 2.4 kJ/mol after 5250 cycles. This level of activation energy is lower than the activation barrier for lithium-ion diffusion in the lithiated form of
  or
or  (about 0.30 eV or
  ).45 The decreasing activation energy of cell capacity with cycling implies that the degraded cathode becomes less sensitive to temperature.

Figure 6. Discharge capacity varies with the reciprocal temperature  in the form of the Arrhenius equation.
Impedance rise
The series of impedance spectra after various cycle numbers, measured on the three-electrode cells at 50, 25, 0, and  , are shown in Fig. 7 and 8, respectively. They all present different regions along the frequency range: A high frequency inductive region, a depressed semicircular arc at middle frequency, and a sloped diffusion tail at low frequency.
The high frequency inductive effect may be induced by jelly-roll and porous electrode structure in the cell or connecting leads of the measurement instrument.31, 39, 40 The high frequency intercept on the real axis  includes the electrolyte resistance, electronic resistance of active particles and with current collectors,46 as well as the connection resistance between the leads of the measurement instrument and the cell terminals through the cell holder. The variation in high frequency intercept in the impedance spectra is due to the slightly capricious connection resistance, and does not indicate a change in electrolyte resistance nor electronic resistance with cycling or temperature. The middle frequency arc is accounted for by two constituent processes present at the electrode–electrolyte interface: Charge-transfer resistance
  in parallel with double-layer capacitance
  , and resistance
  coupled with the capacitance
  of the SEI layer.
The low frequency sloped behavior is associated with Warburg impedance corresponding to semi-infinite diffusion, followed by a nearly vertical spike below 0.01 Hz indicative of finite-length diffusion47, 48 in Fig. 7a at  and in Fig. 7b at
  . The transition frequency
  from semi-infinite diffusion to finite-length diffusion can be used to estimate the diffusion coefficient, given a known average particle radius, because the diffusion coefficient is given by
  , where
  is the finite diffusion length and approximates the average radius of particles.47 However, the transition from semi-infinite to finite diffusion is not observed in Fig. 8a and 8b at 0 and
  , because the diffusion coefficient drops at low temperatures so that the transition frequency falls below the lowest frequency (0.005 Hz) used in the measurements. The low frequency sloped lines with cycles appear parallel with a displacement along the real axis
  , which demonstrates that the diffusion-related impedance inside the active particles does not greatly contribute to the impedance rise with cycling.
Figure 7. Nyquist plots at a cell voltage of 3.90 V after various cycles, measured at different temperatures of (a) 50 and (b)  .
.

Figure 8. Nyquist plots at a cell voltage of 3.90 V after various cycles, measured at different temperatures of (a) 0 and (b)  .
.
The impedance spectra at 0 and  (in Fig. 8a and 8b) show that the middle frequency arcs consist of two distinguishable semicircles, implying the contribution of charge-transfer kinetics and
  transport through the SEI layer. However, at 50 and
  (Fig. 7a and 7b), the two processes cannot be distinguished in the middle frequency arcs, due perhaps to a very small
  . The midfrequency arc width
  acquired from the impedance spectra at different temperatures tends to increase with cycles. As seen from the linear dependence in Fig. 9 with the square root (SQRT) of the cycle number
  , the constants
  and
and  can be employed to examine the effects of temperature and cycling. The constant
  is the fitted resistance for
  , and largely increases from
  at
at  to
to  at
at  ,
,  at
at  , and
, and  at
at  . The constant
  is the increasing rate with
  and jumps 116 times between 50 and
  : From
  at
at  to
to  at
at  ,
,  at
at  , and
, and  at
at  .
.
Figure 9. Midfrequency arc width  increases linearly with the SQRT of the cycle number
  .
.
The temperature dependence of the conductance,  , can be analyzed by the Arrhenius equation describing the change of thermally activated property as a function of the reciprocal temperature
  . The
. The  vs
vs  plots in Fig. 10 follow a linear relationship in the studied temperature range, which is compatible to the Arrhenius equation, and from the linear slope the activation energy is computed to be 52–56 kJ/mol for different cycles. These values are essentially the same with cycling in the range of experimental uncertainties, suggesting that the nature of the thermal activation process, such as
  transport through the SEI layer or charge-transfer kinetics, changes little during cycling. These values are comparable to the literature data (63.5 kJ/mol) for interfacial impedance, with the positive electrode being a mixed oxide of
  and
and  .35
.35
Figure 10. Linear relationship of  with
with  for different cycles.
Three-electrode impedance
Three-electrode impedance spectra were attempted to probe the individual contributions of the positive and negative electrodes to the full-cell impedance at a cell voltage of 3.90 V  . As seen from Fig. 11a, the impedance of the negative electrode is evidently much lower than that of the positive electrode at 0 and
  , and thus the latter contributes dominantly to the full-cell impedance. The sum of the impedance spectra of positive and negative electrodes is produced by adding the values of their real and imaginary components, respectively, at each frequency. The sum is closely comparable to the directly measured full-cell impedance spectra, as can be seen from Fig. 11b. The discrepancy at
  between the sum and the directly measured full-cell impedance spectra possibly results from experimental uncertainties and a slight instability of impedance during the measurement period. Nevertheless, it appears that the impedance spectra for the positive and negative electrodes follow an addition rule to match the full-cell impedance spectra.37–40 The addition rule also applies to those impedance spectra measured at 50 and
  , as shown in Fig. 12b, but the impedance spectra of the positive electrode (Fig. 12a) appear to be abnormal, presenting a midfrequency inductive arc followed by a sloped line. A plausible explanation for the abnormality is the overturning influence of the location of the lithium reference electrode outside of the cell on the small midfrequency capacitive arc of the positive electrode at 50 and
  . A theoretical examination36 has concluded that although the exterior reference electrode introduces significant errors to the impedance measurement, it nevertheless provides a viable tool to track changes in impedance. Consequently, the impedance analyses below focus on the changes and comparison of impedance with cycling or temperature.
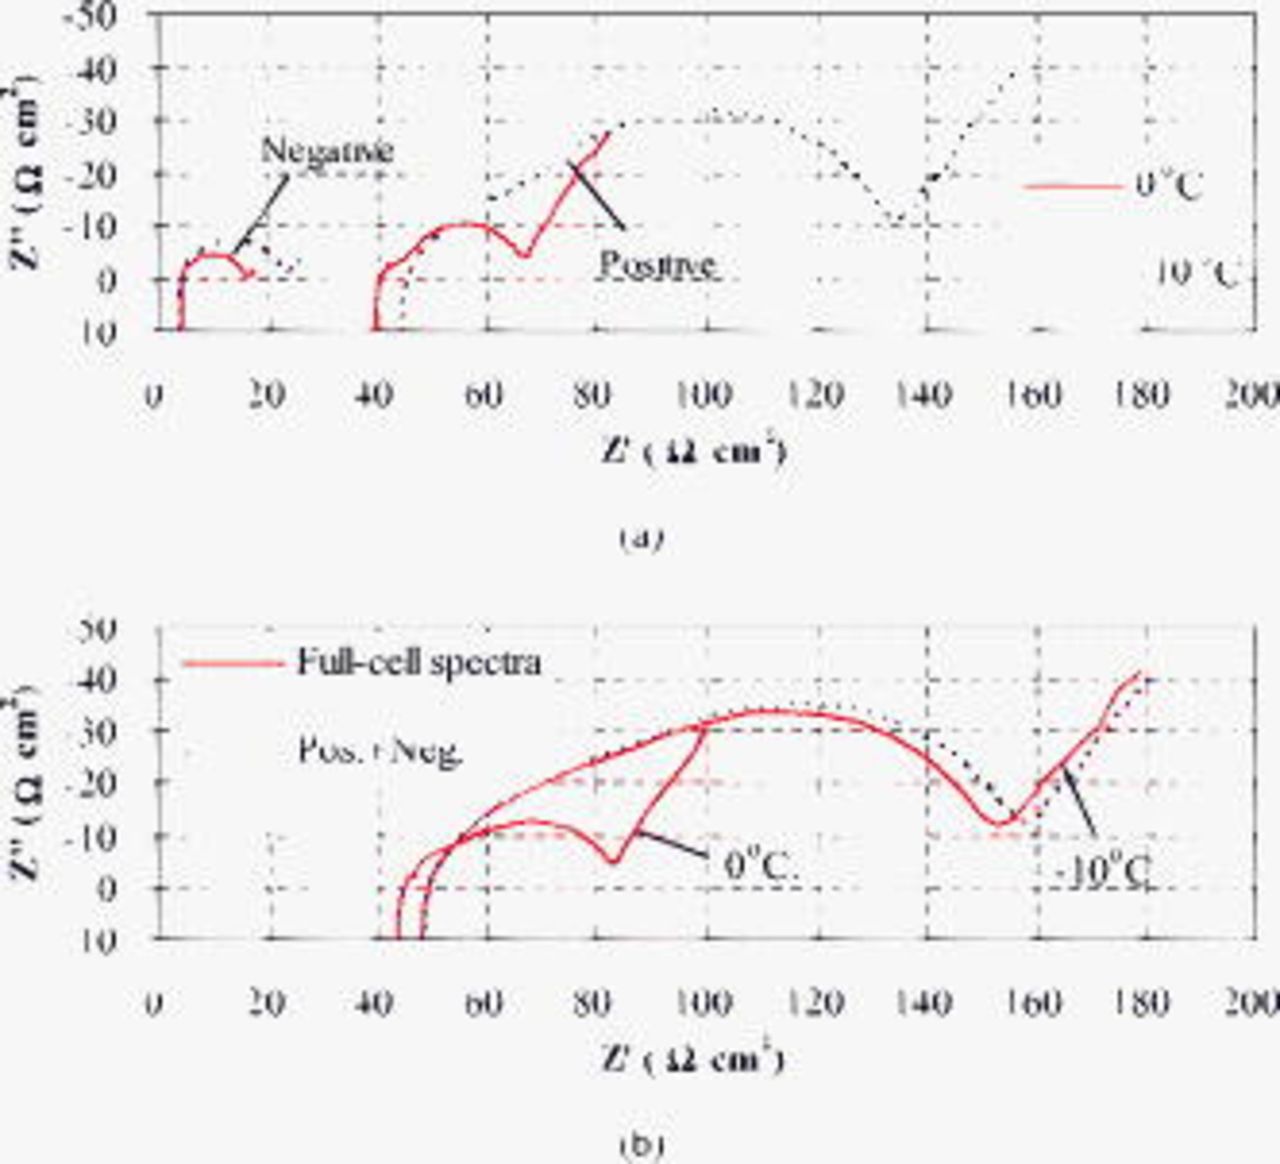
Figure 11. Nyquist plots at a cell voltage of 3.90 V after 300 cycles: (a) Impedance spectra of positive and negative electrodes measured at 0 and  , and (b) the sum of the impedance spectra of positive and negative electrodes in comparison with the full-cell spectra.
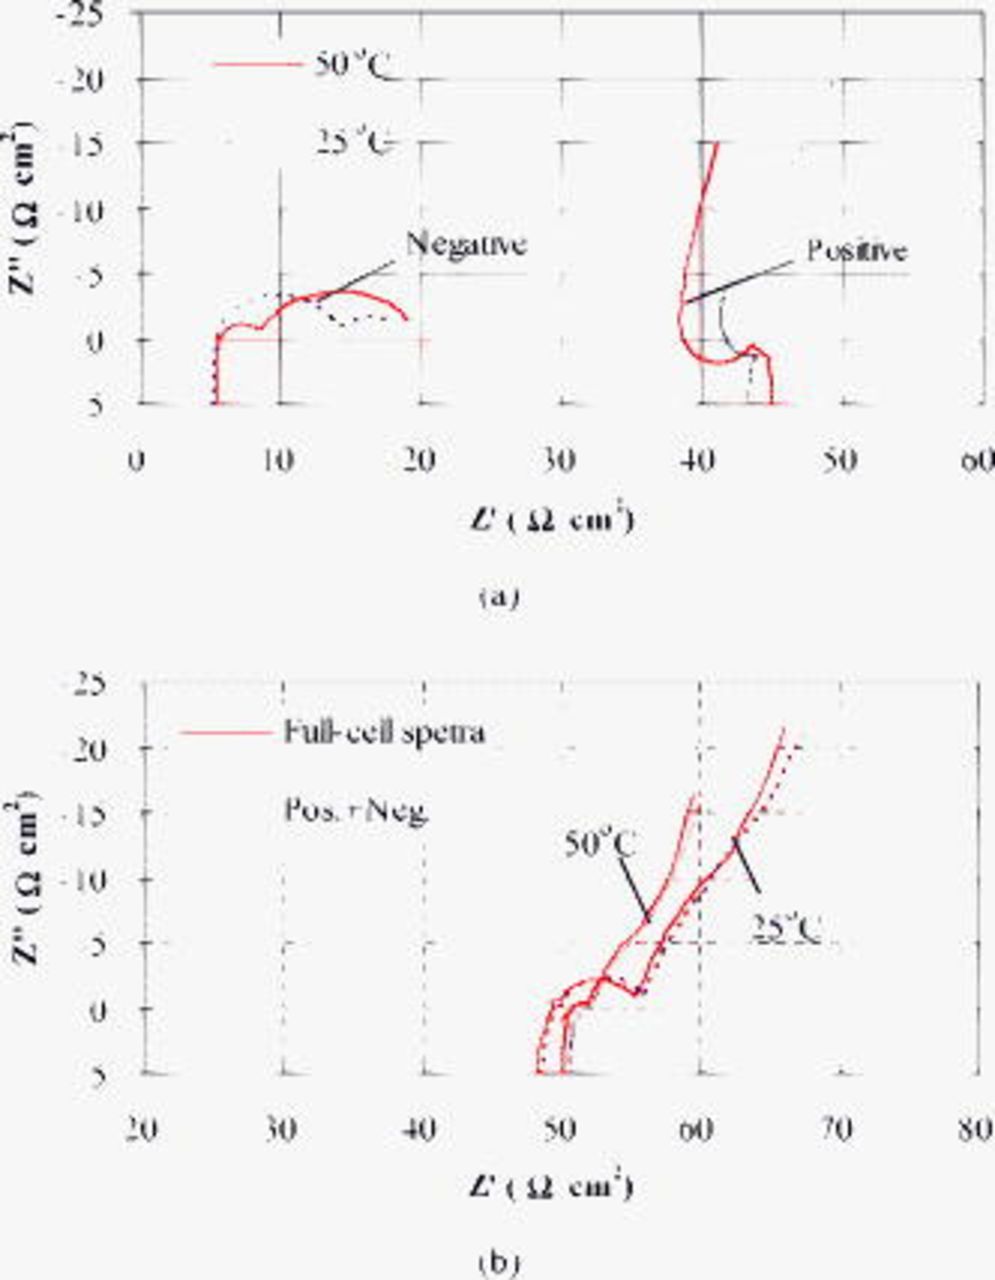
Figure 12. Nyquist plots at a cell voltage of 3.90 V after 300 cycles: (a) Impedance spectra of positive and negative electrodes measured at 50 and  , and (b) the sum of the impedance spectra of positive and negative electrodes in comparison with the full-cell spectra.
The impedance spectra of the negative electrode (Fig. 12a) display two semicircles at 50 and  , with that on the left representing the midfrequency interfacial impedance and that on the right (at lower frequency than 5 Hz) for finite-length diffusion impedance. The semicircle on the right occurs when the radius or half-thickness
  of the active particles is comparable to the diffusion length, i.e.,
  , where
  is the lithium-ion diffusion coefficient,
  is the time, and
  is the frequency. In Fig. 12a, the impedance spectra of the negative electrode displays as a semicircle at low frequency, while in Fig. 7a and 7b, the impedance spectra of the full cell displays as a nearly vertical line below 0.01 Hz, corresponding to two different types of finite-length diffusion.48 One type infers that the diffusion layer contains sufficient electroactive ions
  at the boundary of the graphite particles, which further implies rapid
  transport to the graphite surface through the SEI layer. In contrast, the other type suggests that the diffusion boundary supplies a limited amount of electroactive species, thus exhibiting a capacitive behavior48 that is more likely to derive from the positive electrode.
The impedance spectra of the negative electrode measured at 0 and  in Fig. 13 do not show a rising trend with cycles. This might be due to the formation and dissolution of the SEI layer instead of a continuous growth in thickness and density on the graphite surface.25, 49 Accordingly, the negative electrode contributes little to the impedance rise of the full cell with aging. In contrast, the impedance spectra of the positive electrode measured at 0 and
  (Fig. 14) present wider and wider midfrequency arc with cycles, clearly presenting a combination of two semicircles. Thus it can be seen that the impedance rise of the full cell upon cycling is primarily ascribed to the increase in midfrequency arc width
  on the positive electrode.

Figure 13. Nyquist plots of a negative electrode at a cell voltage of 3.90 V after different cycles: (a) Measured at  and (b) measured at
  .
.
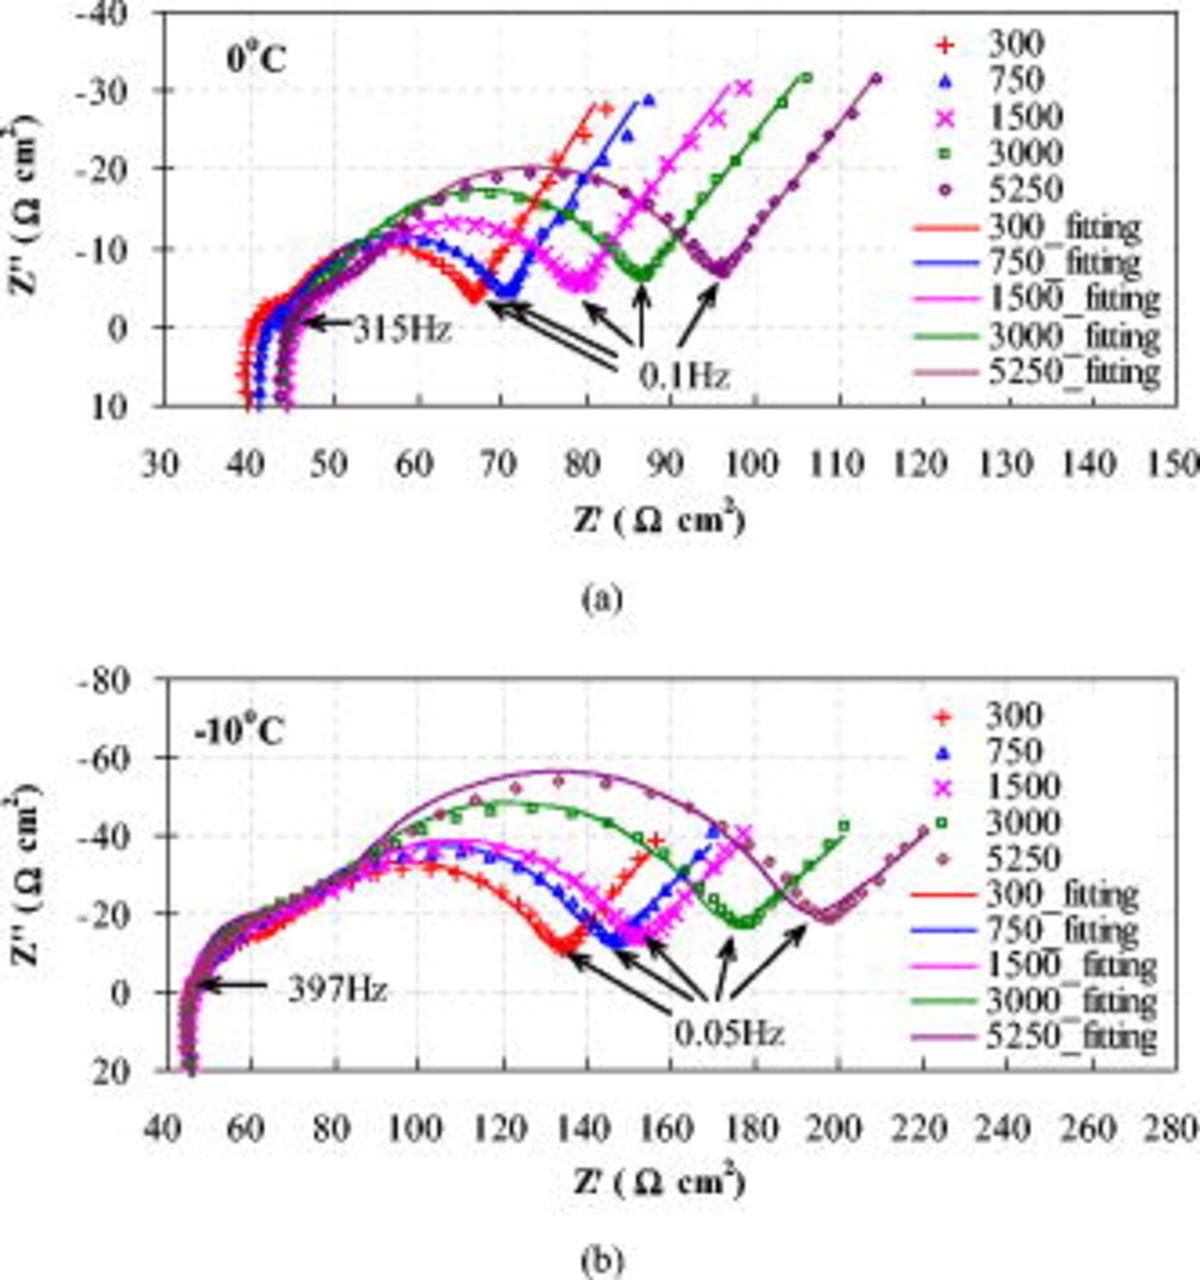
Figure 14. Nyquist plots of positive electrode at a cell voltage of 3.90 V after different cycles: (a) Measured at  and (b) measured at
  . The symbols represent experimental data, while the solid lines are the fitting results.
The impedance spectra of the positive electrode measured at 0 and  were fitted using an equivalent circuit (Fig. 15) that takes into consideration the pattern of the impedance spectra and the physical structure of the positive electrode.42 The Warburg diffusion impedance
  was fitted taking advantage of a constant-phase element:
  , where
  is the complex number, ω is the angular frequency, and
  is the Warburg coefficient σ.42, 50 The exponent
  is equal to 0.5 corresponding to a 45° slope line at low frequency in the impedance spectrum, but may deviate from 0.5 owing to the complexity of different size particles and porous jelly-roll structure in the cell.
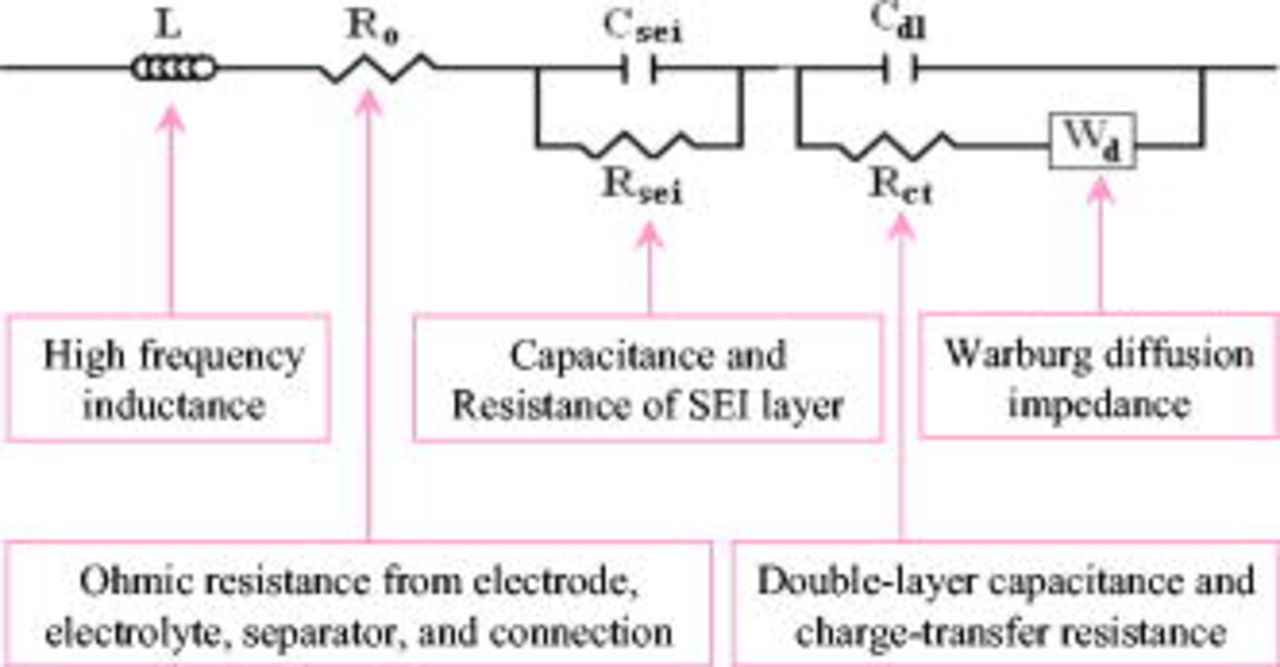
Figure 15. An equivalent circuit used for fitting the impedance spectra of a positive electrode measured at 0 and  .
.
The fitting parameter values at 0 and  are summarized in Tables II and III. The experimental impedance spectra of the positive electrode and the fitted ones show good agreement for all cycles at 0 and
  , as illustrated in Fig. 14. Figure 16 shows that the ohmic resistance
  does not vary greatly between 0 and
  , and does not greatly change with cycles at both temperatures, although it plays a significant part in the total impedance. The resistance of the SEI layer
  greatly increases (about three times) from 0 to
  as well as with cycles, which is attributed to the growth of the SEI layer and its property changes (e.g., porosity, diffusivity, and conductivity). Also,
  exhibits a linear relationship with the SQRT of the cycle number
  , proving that the
  is controlled by
  diffusion through the SEI layer.51–53 Charge-transfer resistance
  increases three to five times from 0 to
  . However, at both temperatures,
  remains much smaller than
  and
and  , and its increase rate with
  is only 22%
  or 30%
  of that of
  . This may be benefitted from aluminum doping in the positive-electrode material (LNCAO) that is able to effectively suppress the rise of charge-transfer impedance.25 Nevertheless, the increase in
  on the positive electrode reflects the decreasing kinetic rate of lithium intercalation reaction in the oxide particles and might be due to the decrease in active surface area in the positive electrode upon cycling.
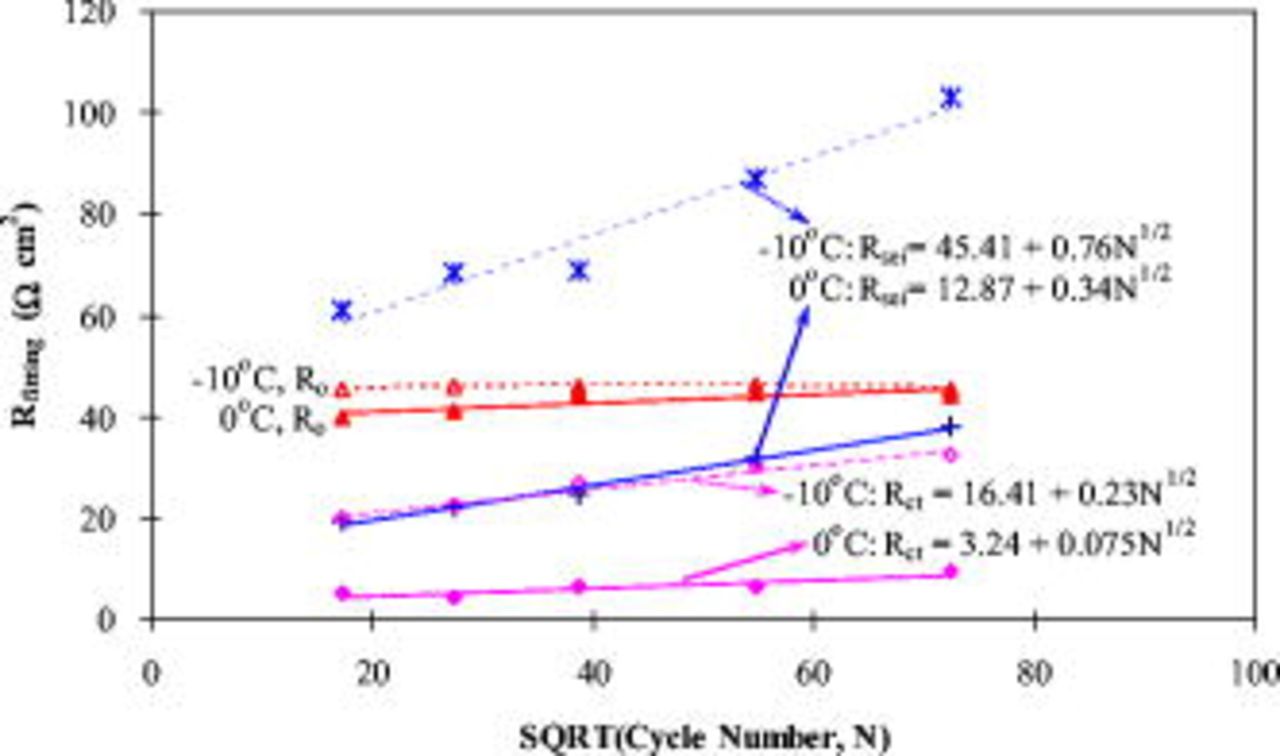
Figure 16. The values of  ,
,  , and
, and  obtained from the impedance fitting of a positive electrode as a function of the SQRT of the cycle number.
Conclusions
Capacity fade and impedance rise in accelerated cycle-life testing for extensive charge–discharge cycles under typical HEV conditions (high power at 5C rate and elevated temperature at  ) were examined on 18650 lithium-ion cells with LNCAO positive electrode. The cells exhibit excellent cycling stability with a discharge capacity of 127 mAh/g LNCAO after 5250 aging cycles, equivalent to 18% capacity fade with respect to a fresh cell after formation. The discharge capacity shows a paralinear behavior that is mainly parabolic behavior (dependent on
  ) at the initial stage, followed by a gradual transition to linear behavior (dependent on
  ) for the succeeding cycles. The use of an external lithium reference electrode reveals that the capacity fade upon cycling is primarily caused by the positive electrode, where discharge capacity might be limited by the decrease in available lithium intercalation sites (accessible active surface area) in the oxide particles. This work provides the most extensive cycling data of automotive Li-ion batteries in comparison to the earlier literature that has not exceeded 1000 deep cycles.8, 10, 11
The impedance of the negative electrode does not show a rising trend with aging cycles. The increase in full-cell impedance with cycling is essentially ascribed to the increase in midfrequency arc width  that is contributed from charge-transfer kinetic resistance
  and
and  transport resistance through the SEI layer
  , and more specifically, from the rising
  and
and  on the positive electrode. It is found that on the positive electrode, the
  rise is far more influential than the change in
  . Accordingly, thickening and property modification of the SEI layer on the positive electrode during cycling appear to be dominant factors in the impedance rise and power fade.
The experimental data detailed herein of capacity fade upon deep cycling, impedance rise, and EIS spectra of the full cell as well as individual electrodes are useful for validating fundamental degradation models to predict automotive lithium-ion battery life.
Acknowledgments
The authors thank Dr. Richard Steinberger for designing the cell holder for three-electrode cells and ECEC industrial sponsors for financial support of this work.
The Pennsylvania State University assisted in meeting the publication costs of this article.