
Abstract
Stabilization of high-specific-capacity  has been demonstrated more than a decade ago by simple modification of the synthesis protocol. However, the stabilization mechanism has remained unclear. In order to identify the origin of such stabilization,
  materials were fabricated through three different synthesis routines in this study. All samples provided high specific capacity
  , but only the best sample maintained good cycling stability. Utilizing extensive physical and electrochemical characterization, the improvement was directly correlated to the modification of the chemistry of the surface rather than the bulk. In particular, high-resolution transmission electron microscopy revealed the thermodynamic growth of distinct phases at the surface of the best material. Such an approach enabled a one-step synthesis process, leading to a uniform surface coating from intrinsic constituents as opposed to more complex synthesis techniques required for the extrinsically deposited surface coatings.
Export citation and abstract BibTeX RIS
 has been the dominant positive electrode material for commercial lithium-ion batteries for the past two decades. Although
  has been the object of extensive research, questions still remain unanswered regarding its stability at large degrees of delithiation. It is well known that although the theoretical specific capacity of
  is
is  , it cannot retain this level of delithiation for a large number of cycles. As such, for over a decade,
  was limited to the removal of approximately 0.5
  , resulting in a practical specific capacity of only
  in order to maintain long cycle life.1 It was initially believed that full delithiation destroys the crystal of
  due to strong repulsion between the adjacent
  layers when the lithium is fully deintercalated. It was later shown that full delithiation leads to the shearing of the
  sheets and the stabilization of a distinct (O1)
  phase.2 Despite this intrinsic stabilization, it is still unclear why delithiation beyond the traditional
  phase is difficult. Some theories proposed the monoclinic distortion which results from the ordering process at
  3, 4 to be destructive. Although some work has been dedicated to the elimination of the transition, others have distinctly discounted this as an origin of the capacity failure and rather pointed to the large change in lattice volume as lithium is deintercalated beyond
  . In situ X-ray diffraction (XRD) clearly revealed a sharp decrease in the
  lattice parameter in this deintercalation region.3, 4, 2 Cobalt dissolution has also been suggested as a symptom but not necessarily a cause of the specific capacity fade observed during cycling at high levels of delithiation.5 Others have correlated phenomena involving the surface, such as its interaction with the electrolyte, to the failure of the material. As a result, more attention has been focused on the surface of intercalation materials. One approach consists of minimizing the detrimental interactions with the electrolyte by placing a passivation film on the surface of
  to stabilize high specific capacities. This area of research is still expanding with the use of a wide variety of coating materials, including metal oxides (
 ,6–10 MgO,7, 11
  ,12, 10, 13
  ,9
,9  ,7
,7  ,10, 14
  ,15 and
  16), metal phosphates (
 ,17, 18
  ,18
,18  ,18
,18  ,18
,18  19), and metal fluorides
  20), through the use of different coating techniques. Finally, others have focused on a striking correlation between postfabrication heat-treatment and cycling stability.22–24 It has been shown that both directions, surface passivation and post heat-treatments, can bring stable cycling to
  at
at  . Some of the present authors25, 21 were involved in early work that enabled stabilization of the cycling stability
  of
of  at high degrees of delithiation of
  through various thermal treatments at very high temperatures. A distinct difference was noted among those materials which were slow cooled or quenched in their fabrication. However, no conclusion to the basis of this improvement was found despite an extensive look at bulk crystal chemistry. The goal of this study is to understand these observations and identify whether a thermodynamically induced surface phase transformation could be the origin of the observed stabilization.
Experimental
Materials fabrication
The  powders were fabricated by solid-state synthesis from stoichiometric mixtures of lithium carbonate (
 ,
,  , Aldrich) and cobalt oxide (
 , 99.7%, AlfaAesar). Homogeneous mixtures were obtained by mixing the precursors in acetone using a commercial blender. The resulting slurries were dried overnight in an explosion-resistant drying oven at
  . The dried powders were then heat-treated in air following three different protocols.
The first anneal is a relatively standard synthesis protocol involving the firing of the precursors at a temperature of  for a period of
  . In the case of the first synthesis routine, this first step is followed by a cooling ramp of
  . This sample will be referred to as the
  -standard sample. In the second synthesis protocol, the
  synthesis step is followed by a
  ramp to a
  anneal at
  and quenched through the use of a drop floor box furnace (the
  -quench sample). The temperature of
  was chosen based on previous results25 that showed the thermodynamic decomposition of
  is already initiated at
  and loss of lithium oxide occurs, thereby resulting in the formation of an off-stoichiometric solid solution of
  . Such solid solution phase stability can only occur at such high temperatures based on established phase diagrams of this material.26–29 Finally, the third protocol is identical to the second, except it contains a third anneal at
  for
for  following the
  anneal (the
  sample). The sample was then submitted to a
  cooling ramp. The
  anneal temperature will allow the reoxidation of the
  and phase separation to accommodate the lithium loss. The latter is dictated by the established phase diagrams of
  , which clearly show that the solid solution range is drastically reduced at
  compared to
  .
.
Physical characterization
The materials were characterized at high magnification using a Leo-Zeiss Gemini 982 field emission scanning electron microscope. The Brunauer–Emmet–Teller (BET) surface area analyses were performed on a Micromeritics ASAP 2010 instrument utilizing krypton adsorption. Thermogravimetric analyses (TGA) were carried out under flowing dry air at  using a Hi-Res TGA 2950 thermogravimetric analyzer from TA Instruments with platinum pans.
The X-ray photoelectron spectroscopy (XPS) measurements were carried out in a Kratos XSAM 800 surface analysis system. In our study, the Li, C, O, and Co XPS core-level spectra were obtained using Mg  radiation
  . For XPS analysis, the samples were prepared simply by dispersing the powder on a sticky carbon tape. Characterization was performed before and after sputtering at
  and
and  for
for  , which should result in the removal of a few monolayers.
The as-fabricated and annealed material structures were identified by XRD using silicon ( mesh powder, Johnson Matthey) as the internal standard in a X2 Scintag diffractometer with Cu
  as a radiation source. A least-squares fit determined a coefficient for a second-order polynomial used to correct all the observed peaks of the spectrum before lattice parameter calculation. Unless stated otherwise in the text,
  step scans were performed for
  angles ranging from 15 to 72°.
The material microstructure was analyzed by combined transmission electron microscopy (TEM), selected area electron diffraction (SAED), and nanoprobe electron diffraction. Standard TEM as well as high-resolution TEM (HRTEM) images were obtained using a Topcon 002B microscope operating at  . In addition to imaging, SAED patterns were obtained from various areas to determine the structure of the phases present. The TEM samples were prepared by dispersing the powder in trichlorotrifluoroethane and releasing a few drops of the liquid on a "lacey" carbon film supported on a copper mesh. Image processing and fast Fourier transformed (FFT) images were obtained using the Gatan Digitalmicrograph suite of software. Finally, the nanoprobe diffraction patterns were obtained using a
  probe size of convergence semiangle
  . Simulations using the kinematical approximation of the nanoprobe diffraction patterns were performed using the JEMS program.30
Electrochemical characterization
Plastic electrodes were fabricated according to the Bellcore developed process.31 The active materials were mixed in acetone with poly(vinylidene fluoride-co-hexafluoropropylene) (Kynar 2801, Elf Atochem), carbon black (Super P, MMM), and dibutyl phthalate (Aldrich). Tapes were cast, dried at room temperature, and finally rinsed in 99.8% anhydrous ether (Aldrich) to extract the dibutyl phthalate plasticizer. After extraction, the electrodes typically consisted of 57% active material  and 12% carbon black. Low concentration of active material was utilized to isolate the electrochemical properties of the studied
  from any mitigating effects induced by the electrode matrix. Two-electrode coin cells (Hohsen, CR2032,
  diam and
  thick) were assembled in a He-filled dry box using a lithium foil counter electrode and glass fiber separators (GF/D, Whatman) saturated with
 in ethylene carbonate:propylene carbonate:ethyl-methyl carbonate:diethyl carbonate (30:5:35:30 in vol) electrolyte.
Results
Physical characterization
The scanning electron microscopy (SEM) images of the as-synthesized powders are shown in Fig. 1. As can be seen, the materials synthesized under the standard  anneal conditions are morphologically templated to the
  precursor with remnant definitions of the cubic (111) evident. In contrast, the materials synthesized at
  exhibit a spherical morphology induced by the coalescence of the aggregates obtained during the
  anneal. Within this sphere, domains of hexagonal platelets, which are more defined in the
  sample, can be identified. Very little morphological or textural difference is observed between the two
  samples. BET surface area measurements (Table I) support these observations, as the two
  samples have a very similar BET surface area close to
  , while the
  standard sample has a higher surface area of
  . This is consistent with the grain growth and densification observed to occur at the
  anneal.
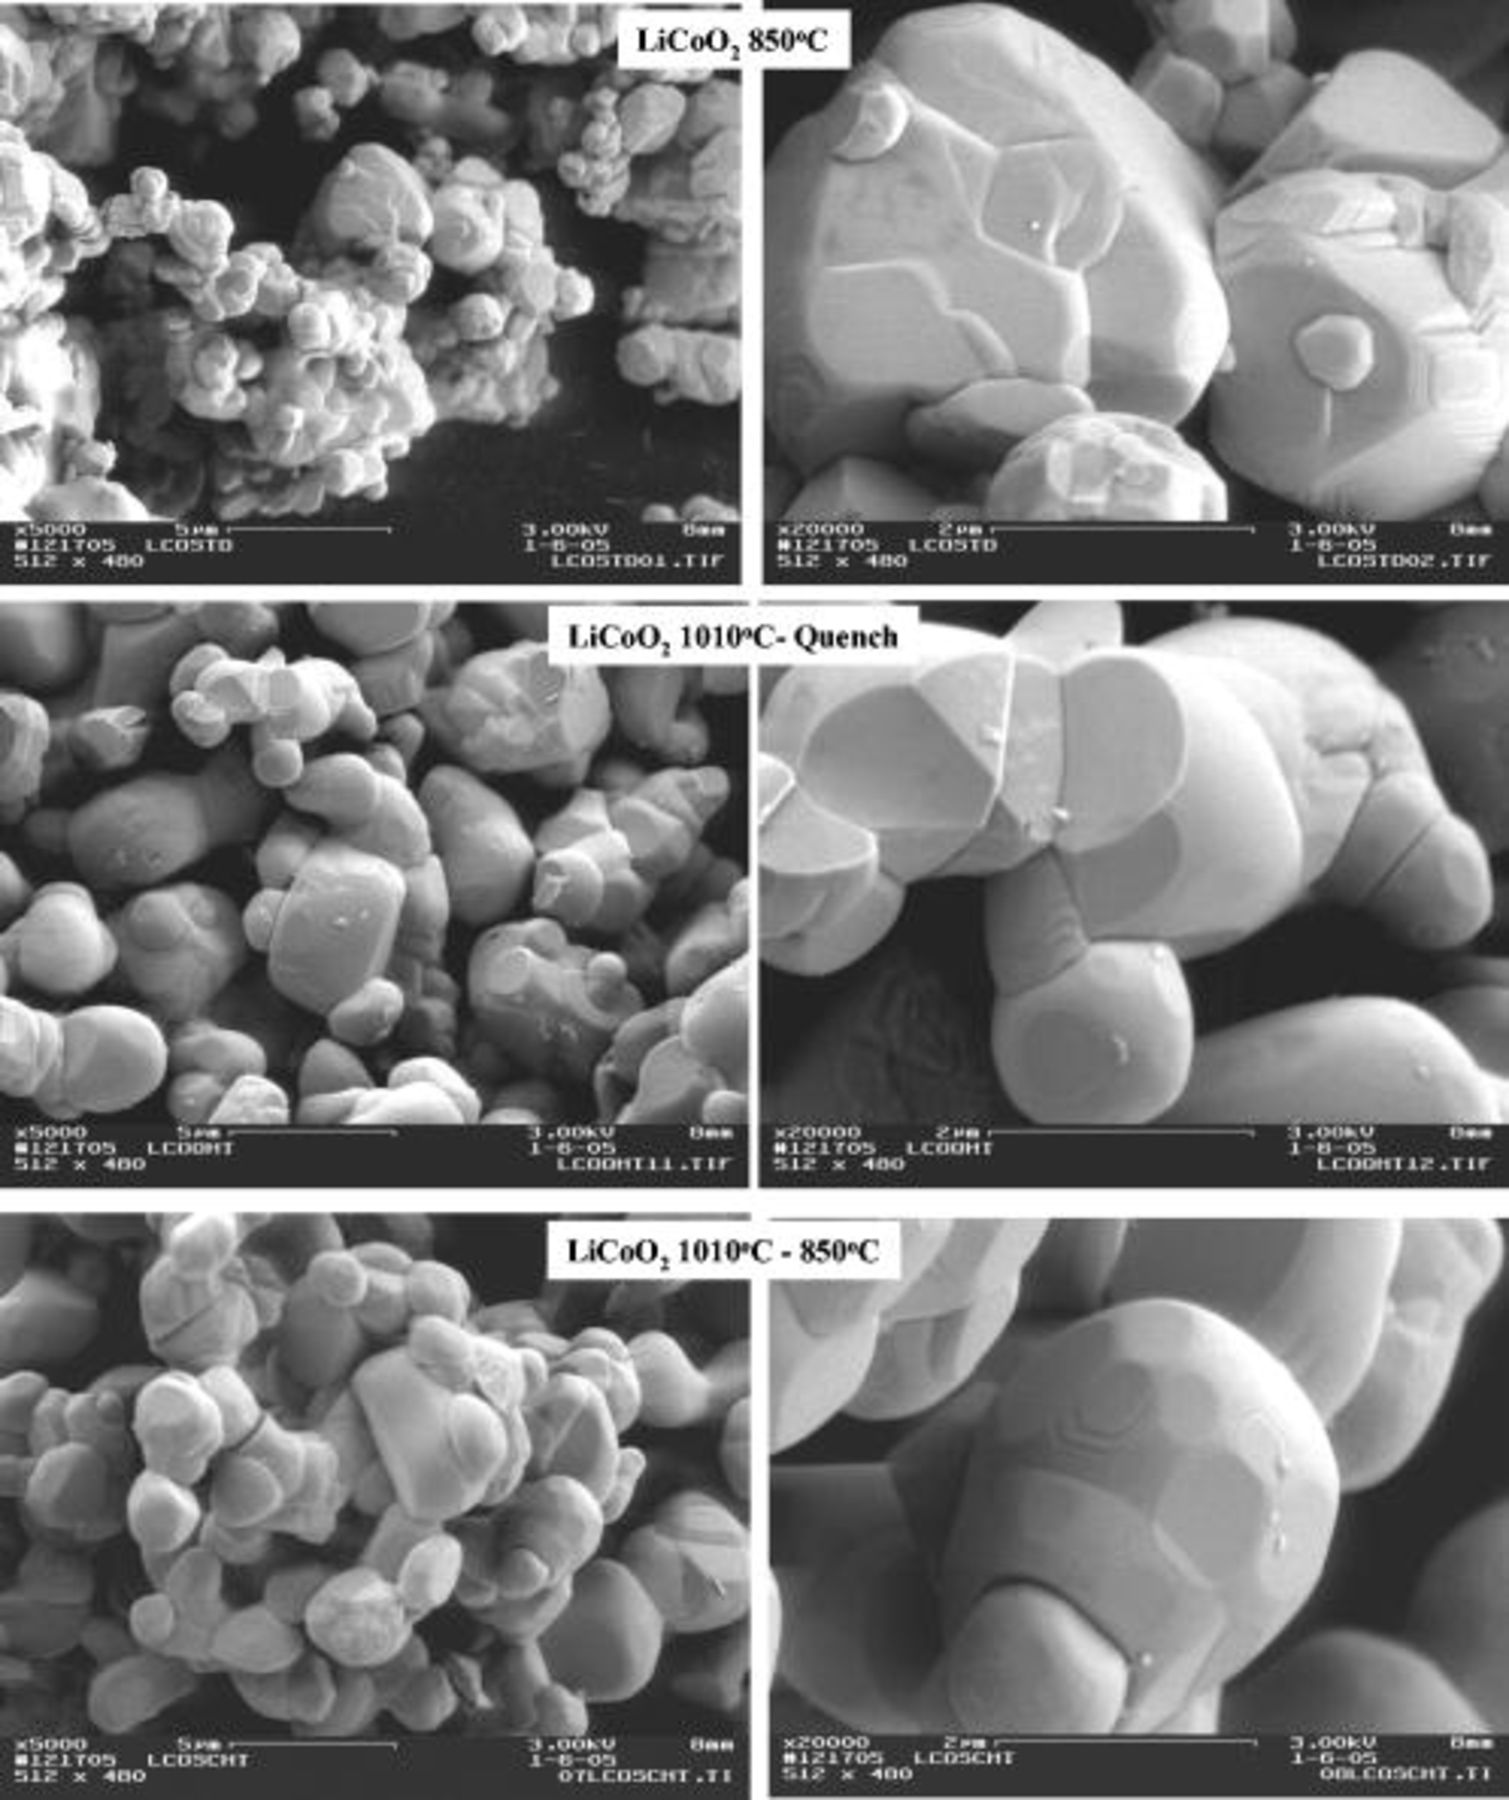
Figure 1. SEM images of the  -standard, the
  -quench, and the
 samples.
Table I. BET surface area and XRD lattice parameters of the  -standard, the
  , and the
  -quench
  materials.
| Sample | BET S.A.
|
 Lattice parameter (Å) Lattice parameter (Å) |
 Lattice parameter (Å) Lattice parameter (Å) |
 ratio ratio |
|---|---|---|---|---|

| 0.40 |
|
| 1.35 |

| 0.32 |
|
| 1.34 |
 -quench -quench | 0.31 |
|
| 1.25 |
All samples consisted of  crystallizing in the
  trigonal structure as shown by XRD in Fig. 2. The XRD patterns show no evidence of secondary phases in any of the three materials, even at very slow scan rates. These results are consistent with TGA demonstrated to be a valuable tool for the detection of
  and
and  secondary phases.25, 32 The magnified TGA plot of Fig. 3 reveals no clear weight change, except for the gradual weight loss above
  associated with
  decomposition. As expected, the quenched sample exhibited the lowest weight loss upon decomposition, as some lithium and oxygen was lost during the
  synthesis step. In comparison, the larger weight loss of the
  sample suggests partial reoxidation occurs during the
  annealing step following the
  process. Finally, the standard sample exhibited the highest weight loss associated to the
  decomposition.
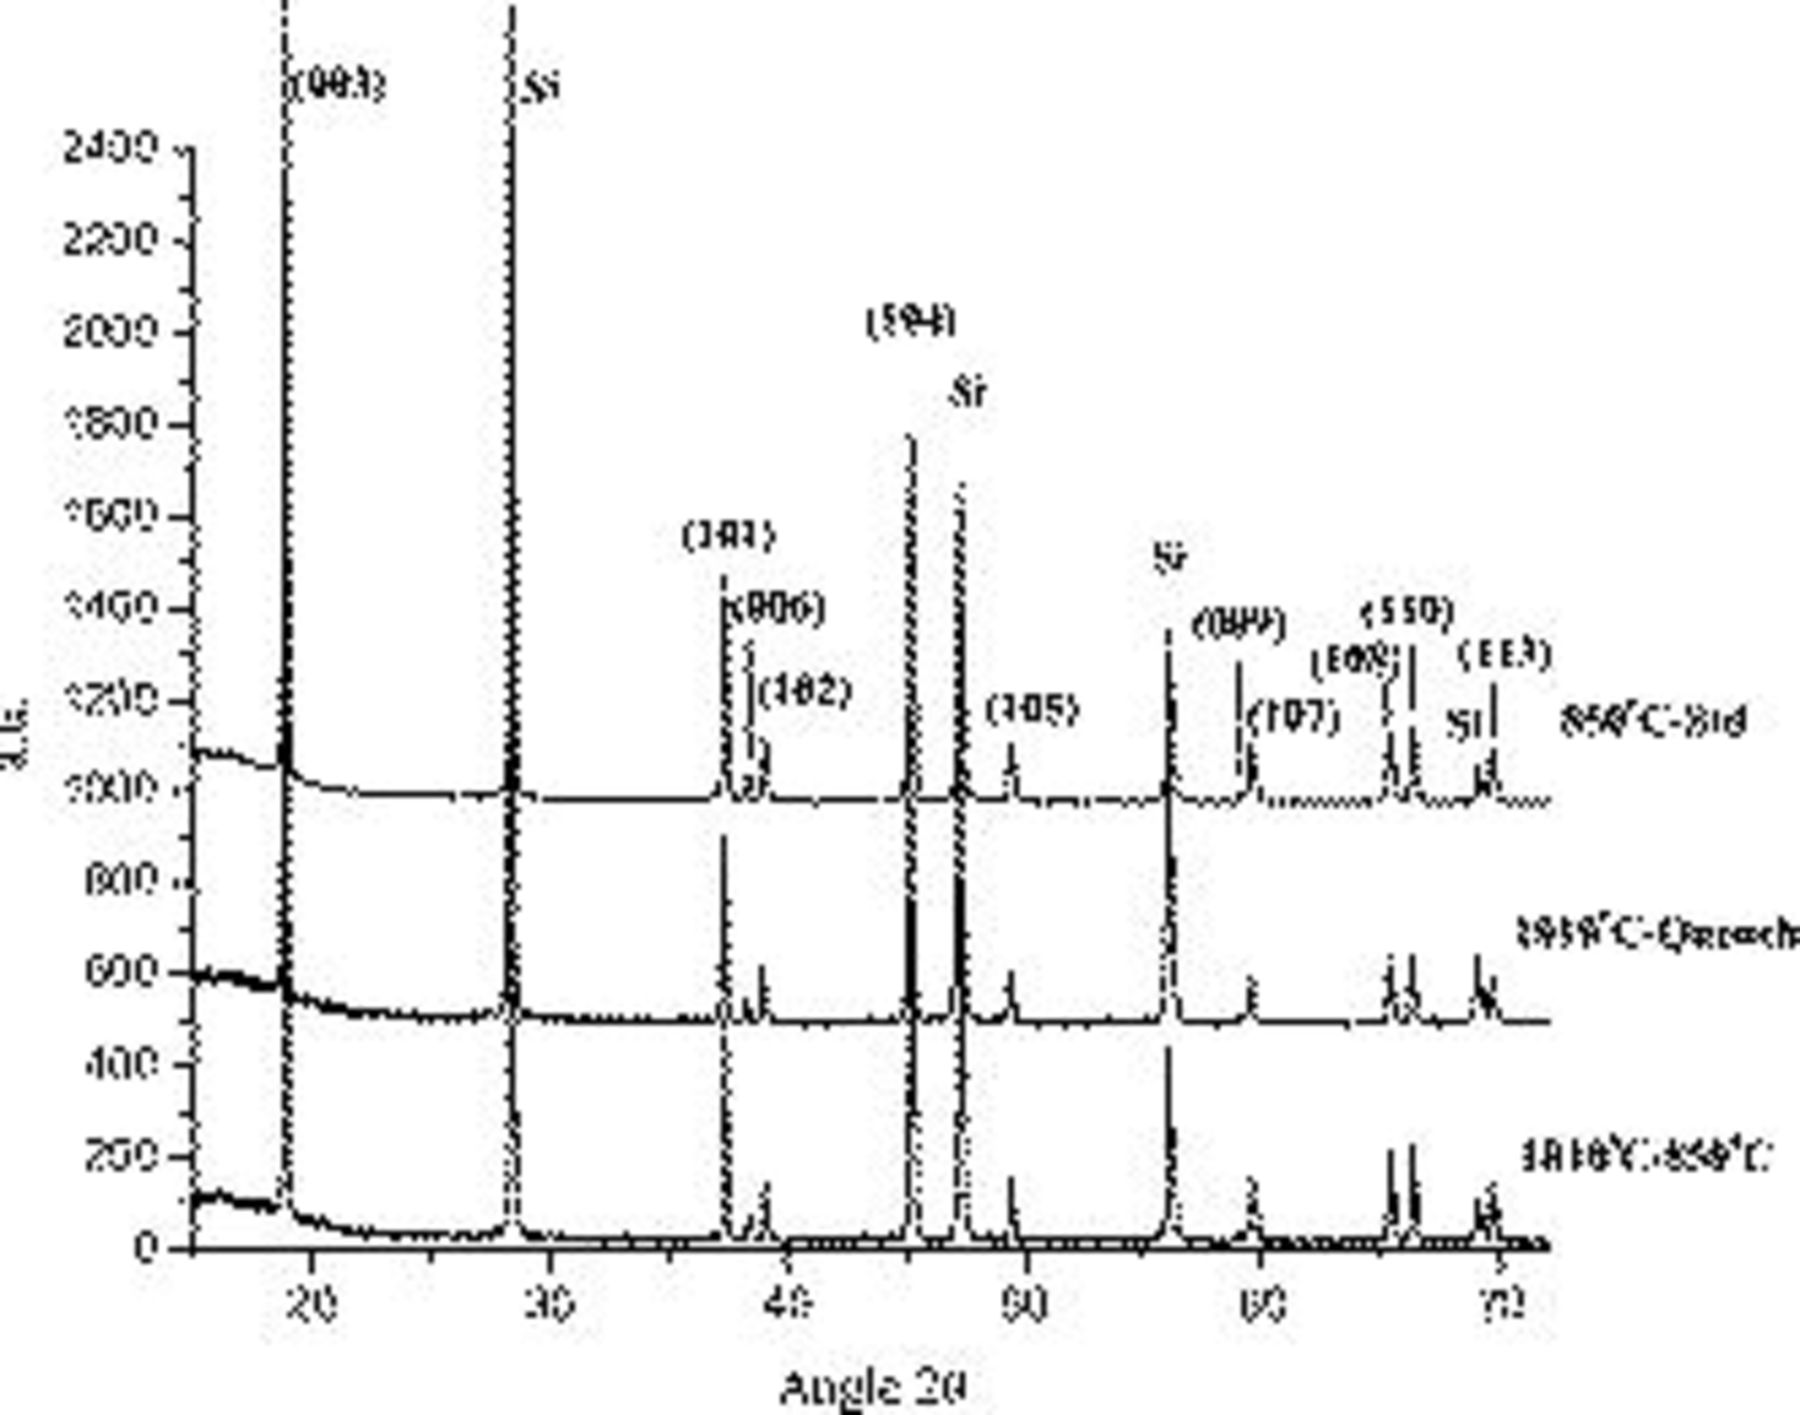
Figure 2. XRD patterns of the  -standard, the
  -quench, and the
 samples.
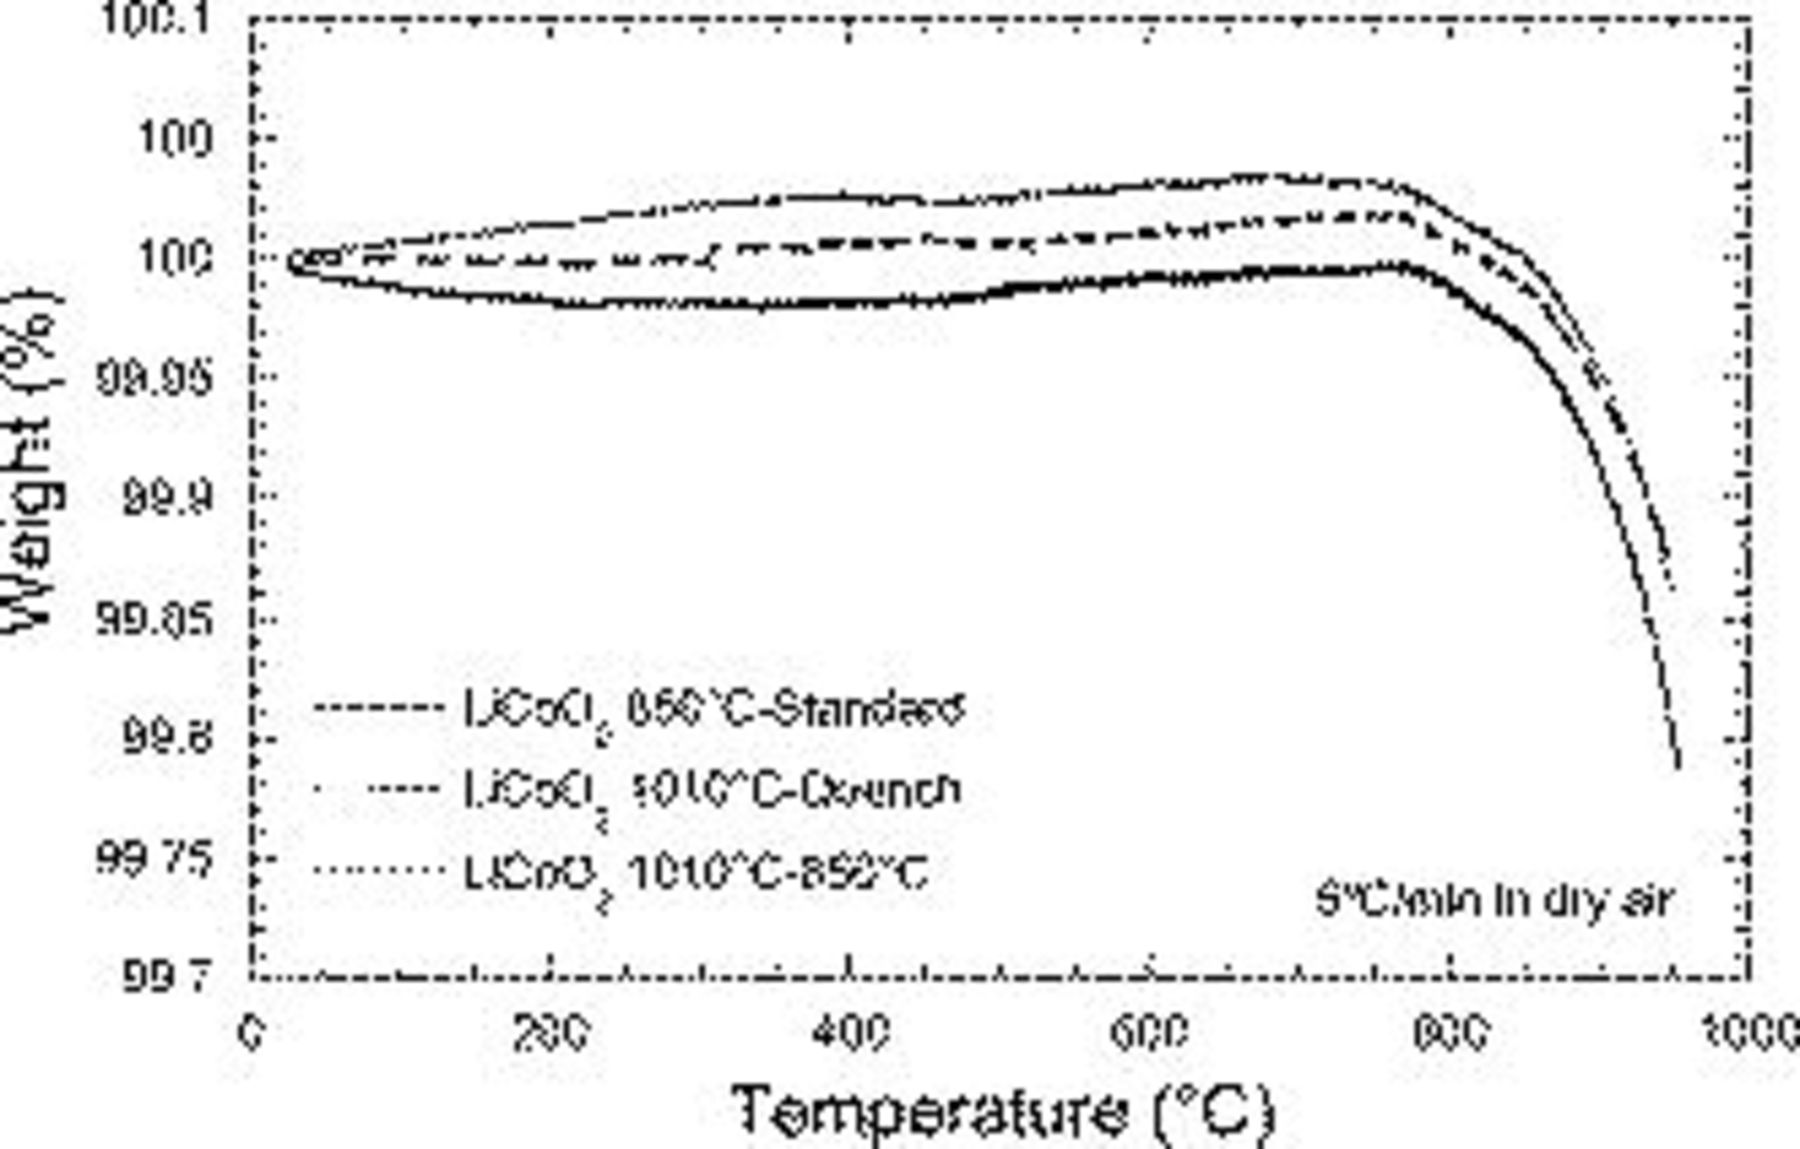
Figure 3. TGA spectra for the  -standard, the
  -quench, and the
 samples.
In addition, the results listed in Table I show very little statistical change in lattice parameter. Numerous XRD analysis runs were performed on each sample to confirm this result. Finally, very little difference was observed in the  ratio between the
  standard sample and the
  sample. As expected, the quenched sample exhibited a smaller
  ratio, which indicates a very small degree of cation mixing with the presence of Co in the Li plane.33
Electrochemical characterization
Duplicate or triplicate cells were fabricated vs Li metal for all three samples. The cells were cycled at  of active material. The first
  were cycled at the traditionally stable
  cycling protocol followed by the more extreme
  cycling protocol. All three samples show a significant increase in specific capacity from approximately
  to a value of
  upon increase of the cutoff voltage from
  (Fig. 4). While all samples exhibited very similar capacities, a very striking and reproducible difference occurred in the cycling stability. As expected, the
  fabricated through the standard methodology exhibited poor cycling stability at the extreme depths of delithiation. The sample annealed at
  followed by quenching cycled similarly to the standard
  . However a striking increase in stability was observed for the
  which was annealed at
  and then followed by a second anneal at
  . The similarity of the initial voltage profiles (Fig. 5) with all samples exhibiting the monoclinic transition is consistent with materials of similar bulk chemistry as demonstrated by XRD.
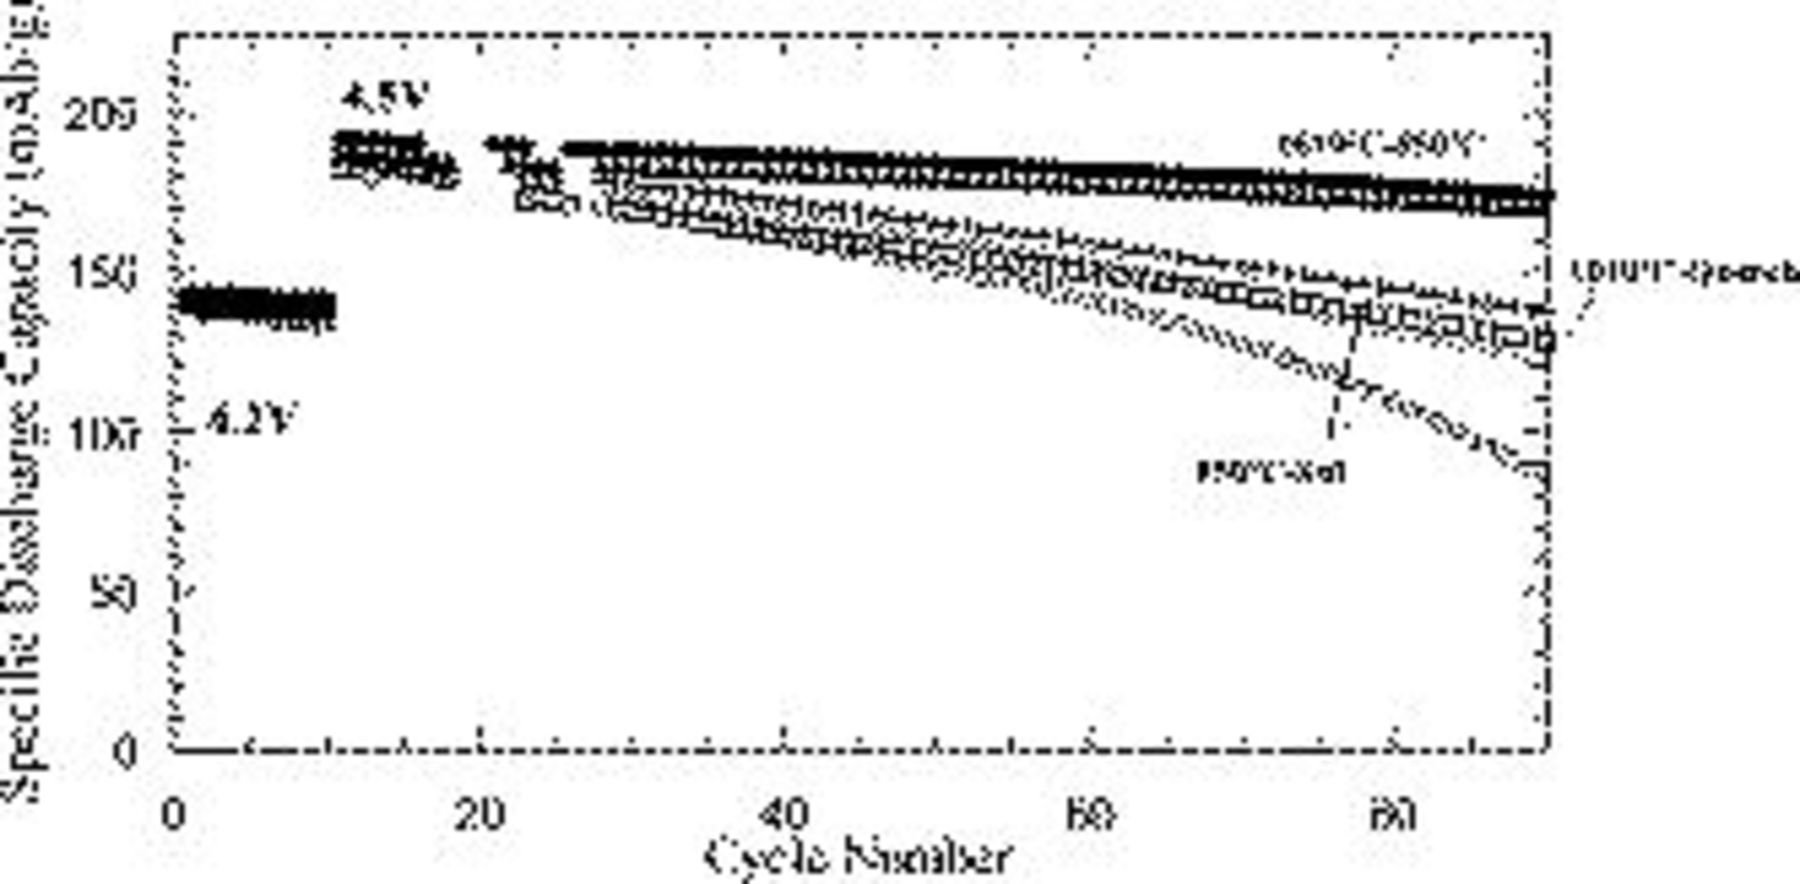
Figure 4. Specific capacity as a function of cycle number of the  standard, the
  -quench, and
  samples cycled vs lithium. The samples were charged up to
  in the first
  and up to
  thereafter.
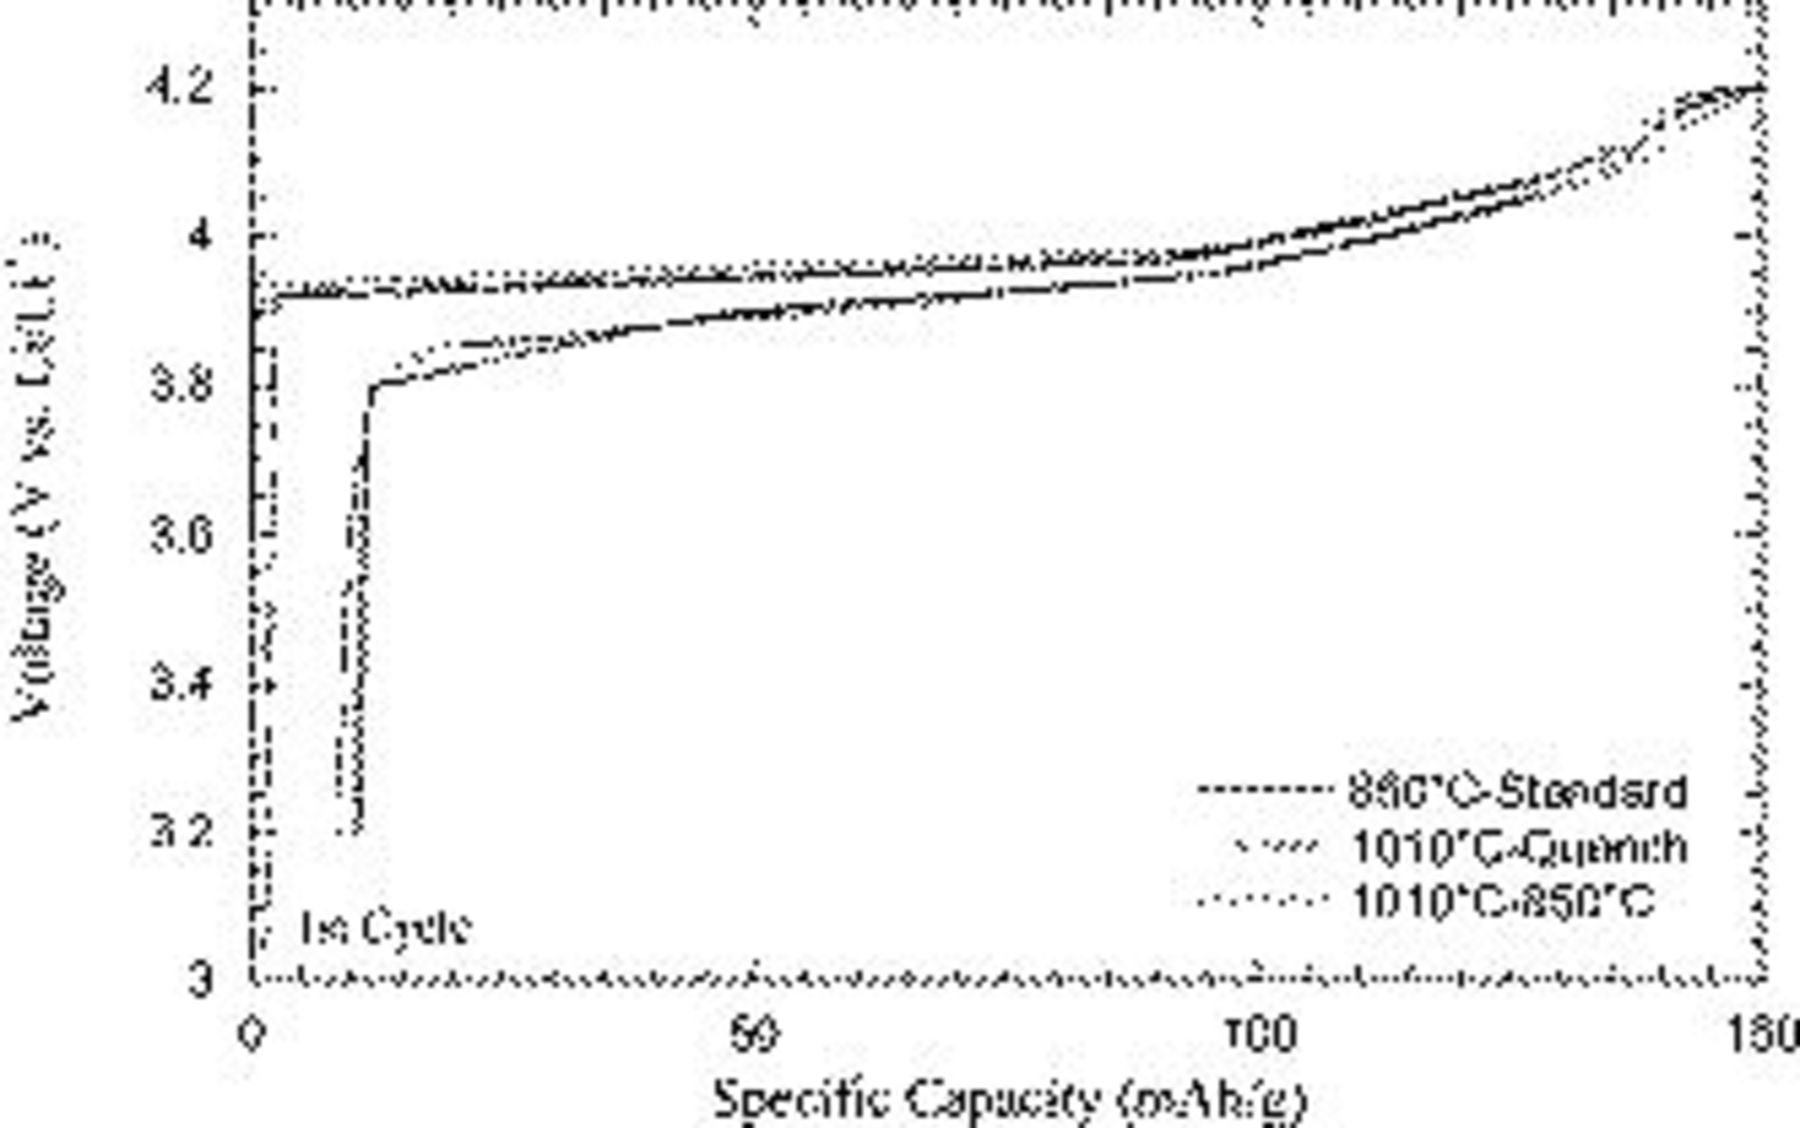
Figure 5. First cycle voltage profile of the  standard, the
  -quench, and
  samples cycled vs lithium.
HRTEM, FFT, and nanoprobe analysis
We have shown that the two samples annealed at  mimic each other in the physical and structural characterization studies performed. As a result, there is no apparent physical or structural basis to support the drastic difference in their electrochemical stability. In order to identify the origin of the observed stabilization, the two
  -annealed samples were submitted to additional characterization studies to make a finer analysis of the surface chemistry and morphology.
The  -quench sample

HRTEM was performed on the samples to ascertain the surface and near-surface structure in order to identify any structural or morphological changes occurring at the surface. A representative HRTEM image of the  -quench sample is shown in Fig. 6a with the corresponding FFT pattern in Fig. 6b. This HRTEM image is representative of a number of images that were taken. The lattice resolution in the HRTEM image of the
  -quench sample shows that the lattice fringes of the lithium cobaltite extend to the edge of the particle, with no evidence of any secondary surface phase marked by a discontinuity of the lattice fringes. However, despite SAED (not shown here) and XRD patterns indicating bulk
 , the FFT pattern of the lattice image in Fig. 6b is consistent with a cubic phase in a [011] zone axis orientation with two coplanar {111} reflections. This result was further confirmed by nanoprobe electron diffraction taken
  from the edge and at the edge of the particles. The nanoprobe diffraction pattern obtained from the edge of the powder shown in Fig. 7a has a twofold rotation axis and could be indexed as a cubic spinel of space group
  in a [011] zone axis orientation, as demonstrated with its good agreement with the kinematical simulation presented in Fig. 7b. The experimental nanoprobe pattern also contains visible {200} reflections which are forbidden in the
  space group but which may appear through double diffraction. {022} reflections may also be formed by double diffraction; however, occupancy of a fraction of the tetrahedral sites by
  could be the origin of the stronger {022} reflections. Nanoprobe diffraction taken
  from the edge toward the core of the particle (Fig. 7c) revealed the superposition of the trigonal matrix phase in a [241] zone axis orientation with the cubic "surface" phase in a [011] axis orientation. Because the kinematical simulations of the cubic and trigonal phases in Fig. 7b and 7d, respectively, show the reflections of the trigonal phase overlap of the cubic phase, it is reasonable to suggest that the trigonal phase is also present to some degree at the surface of the particle and that a relatively smooth gradient of transition takes place between the two phases. This hypothesis is further supported by the continuity of the lattice fringes from the core to the edge of the particles. The presence of a small degree of
  phase is consistent with the slight decrease of the
  peak ratio identified in the bulk XRD characterization.
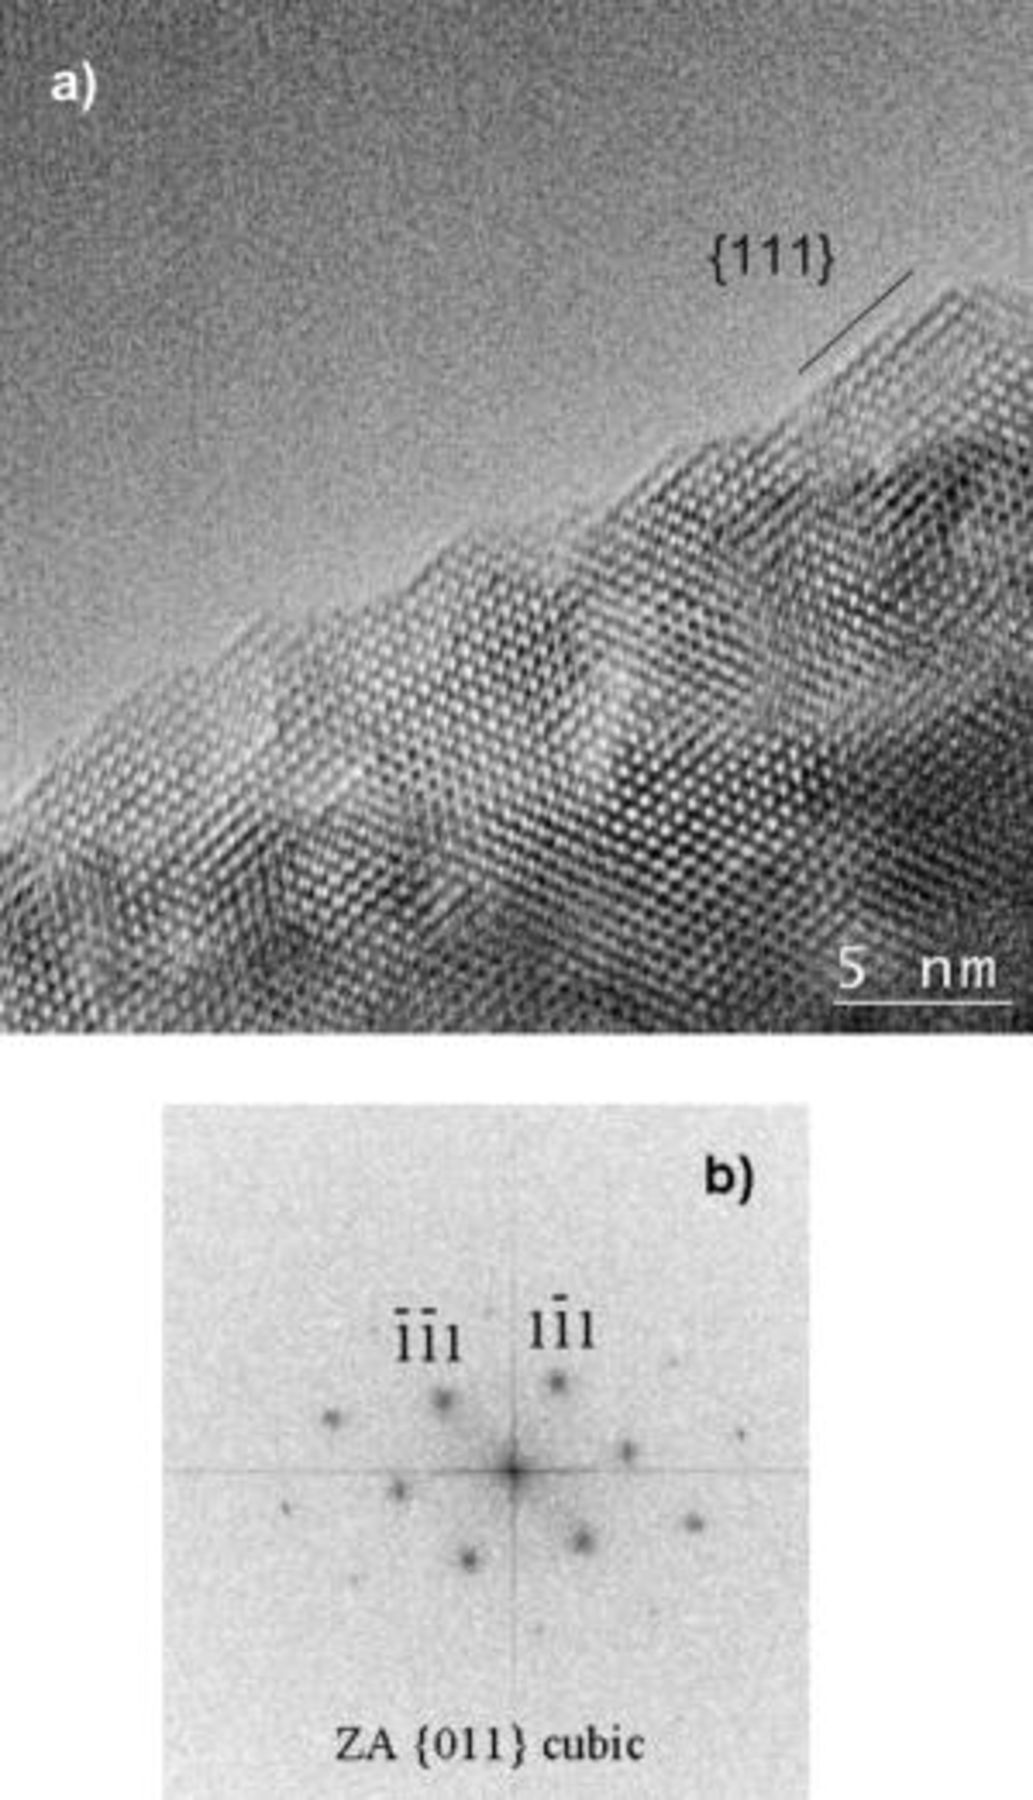
Figure 6. HRTEM image of the  -quench sample (a) and its corresponding FFT pattern (b).
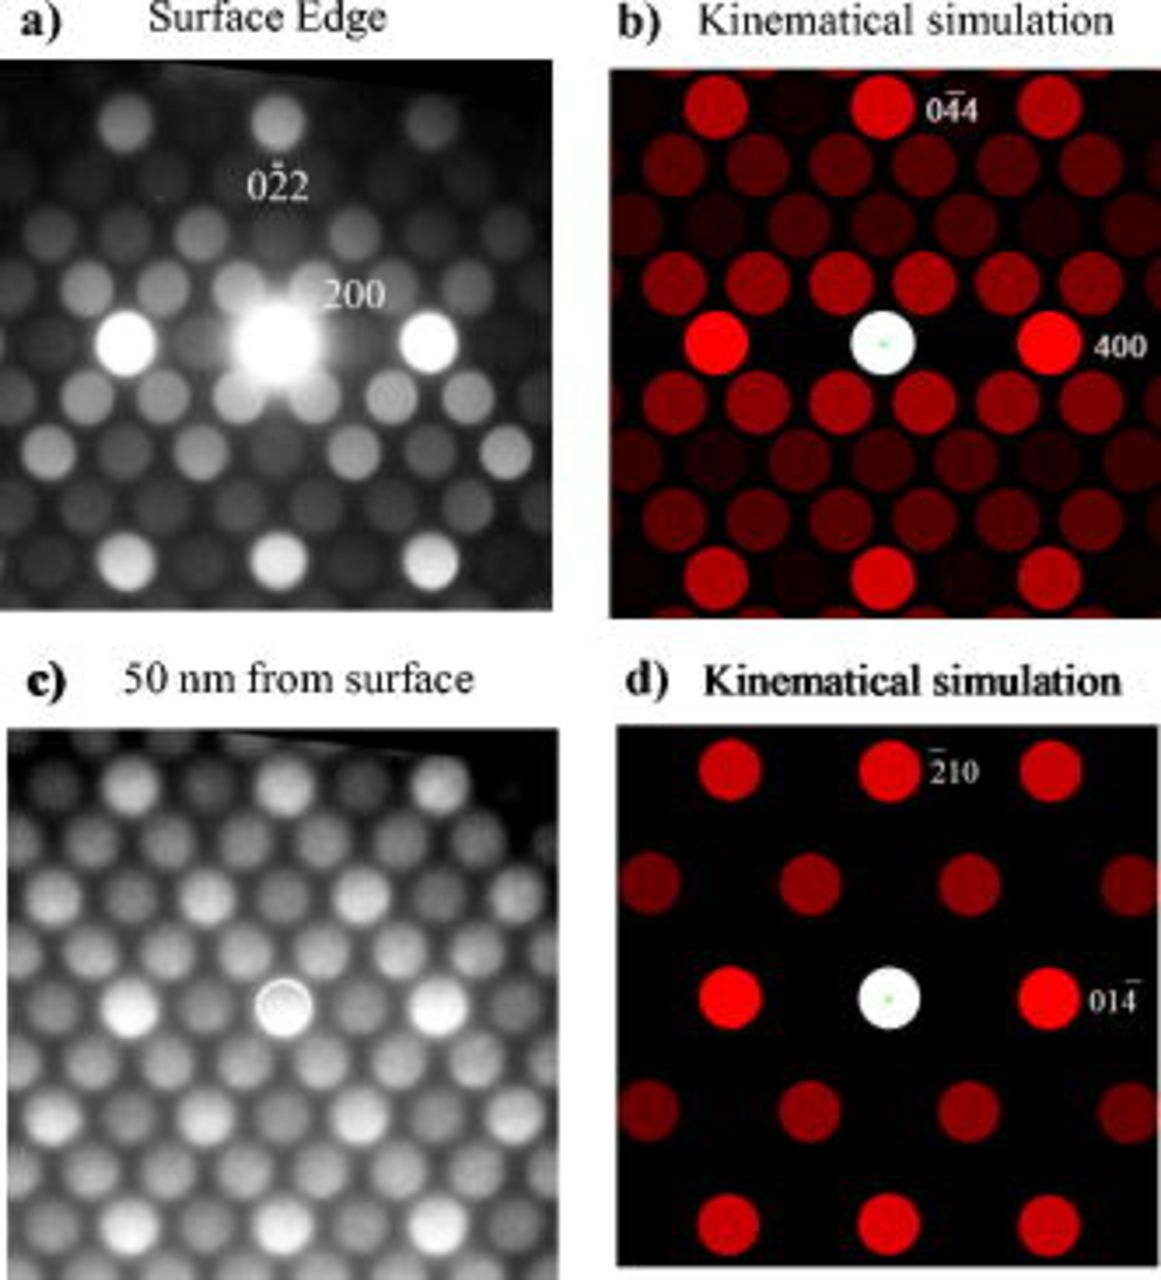
Figure 7. Nanoprobe diffraction pattern taken at the edge of the  -quench sample (a) and the kinematical simulation of a cubic spinel
 phase in a [011] zone axis orientation (b). Nanoprobe diffraction pattern taken
  from the surface edge (c) and the kinematical simulation of a trigonal
 phase in a [241] zone axis orientation (d).
The sample
In sharp contrast to the quenched sample, the  sample reveals the presence of at least one but possibly two distinct secondary phases on the surface as shown in Fig. 8 for two different particles. These secondary surface phases, which are about
  thick, are visually distinct and exist either as a continuous phase (Fig. 8a) or as discreet nodules protruding from the surface (Fig. 8b). The HRTEM images taken from a nodule and in between nodules are shown in Fig. 9 along with their FFT patterns. The discontinuity in the lattice fringes of the nodule (Fig. 9a) is a clear indication of the distinct surface phase. In the case of the continuous surface phase, the discontinuity of the lattice fringes within a few nanometers from the edge is less distinct but is associated to a minor change in contrast, as observed in Fig. 9d. The FFT pattern of Fig. 9b corresponding to the HRTEM image of a surface nodule of Fig. 9a could be indexed as a cubic phase in a [101] zone axis orientation, as demonstrated with its good agreement with the simulated pattern of Fig. 8c. The growth of the cubic surface nodules is epitaxial with a small misfit compared to the trigonal matrix. The epitaxial orientation relationship is
  and
and  . These results recall similar results we previously obtained with a different lithium cobalt oxide material also exhibiting surface nodules (but not the thin surface layer). In this material, the nodules were identified as cubic spinel
  .
.
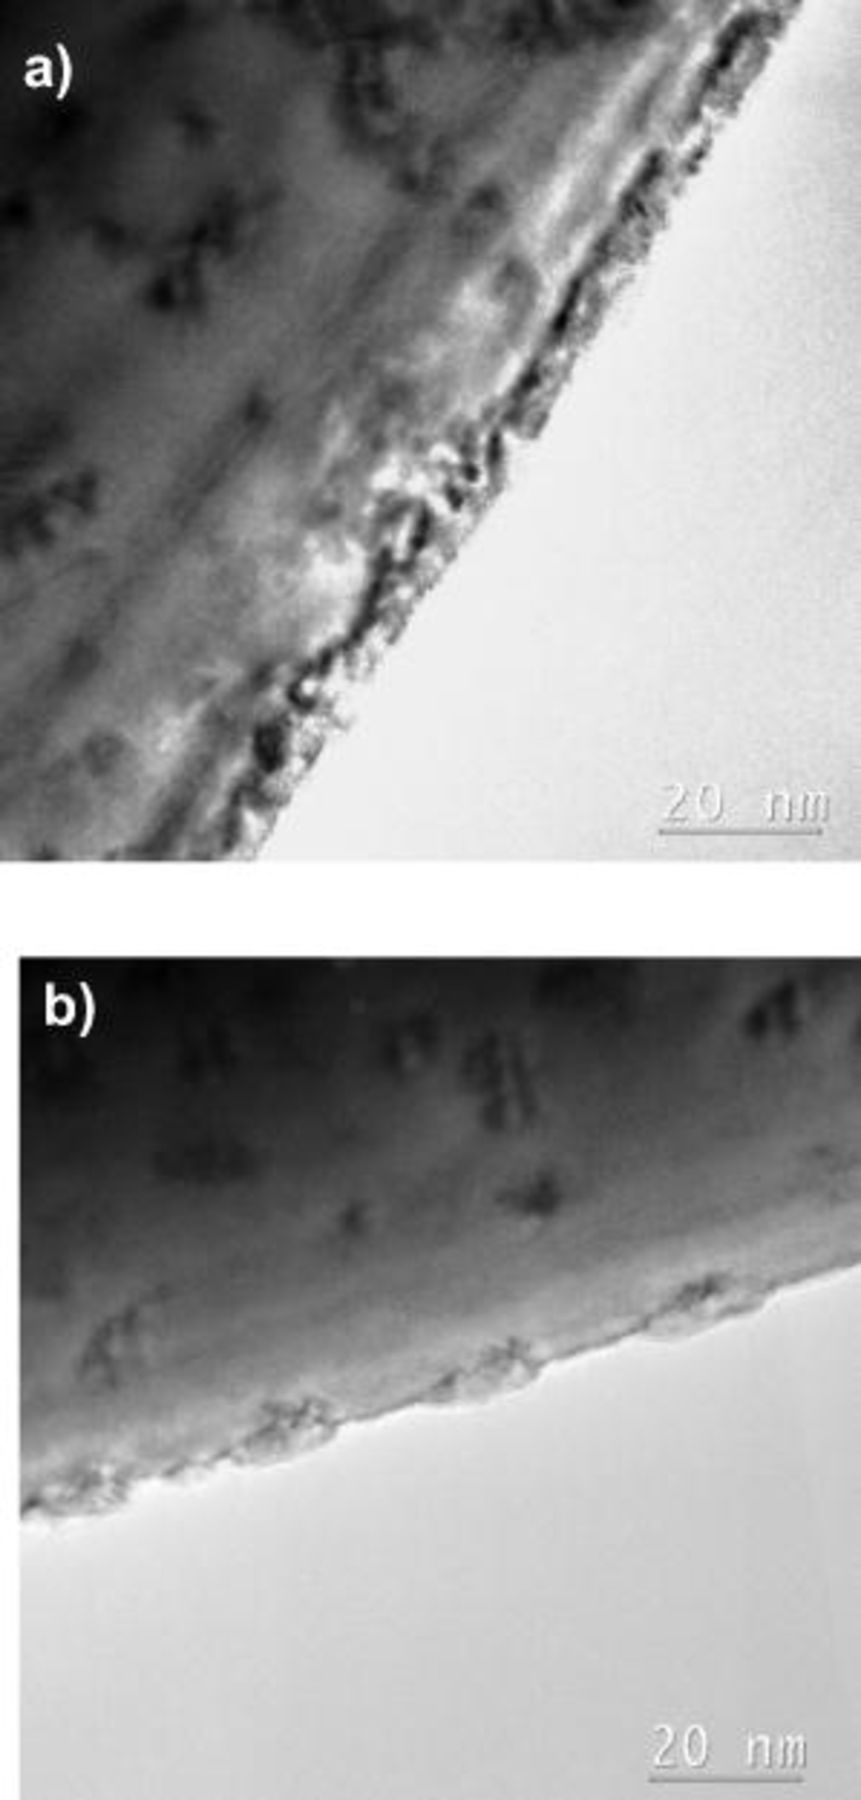
Figure 8. TEM images of two different particles of the  sample.
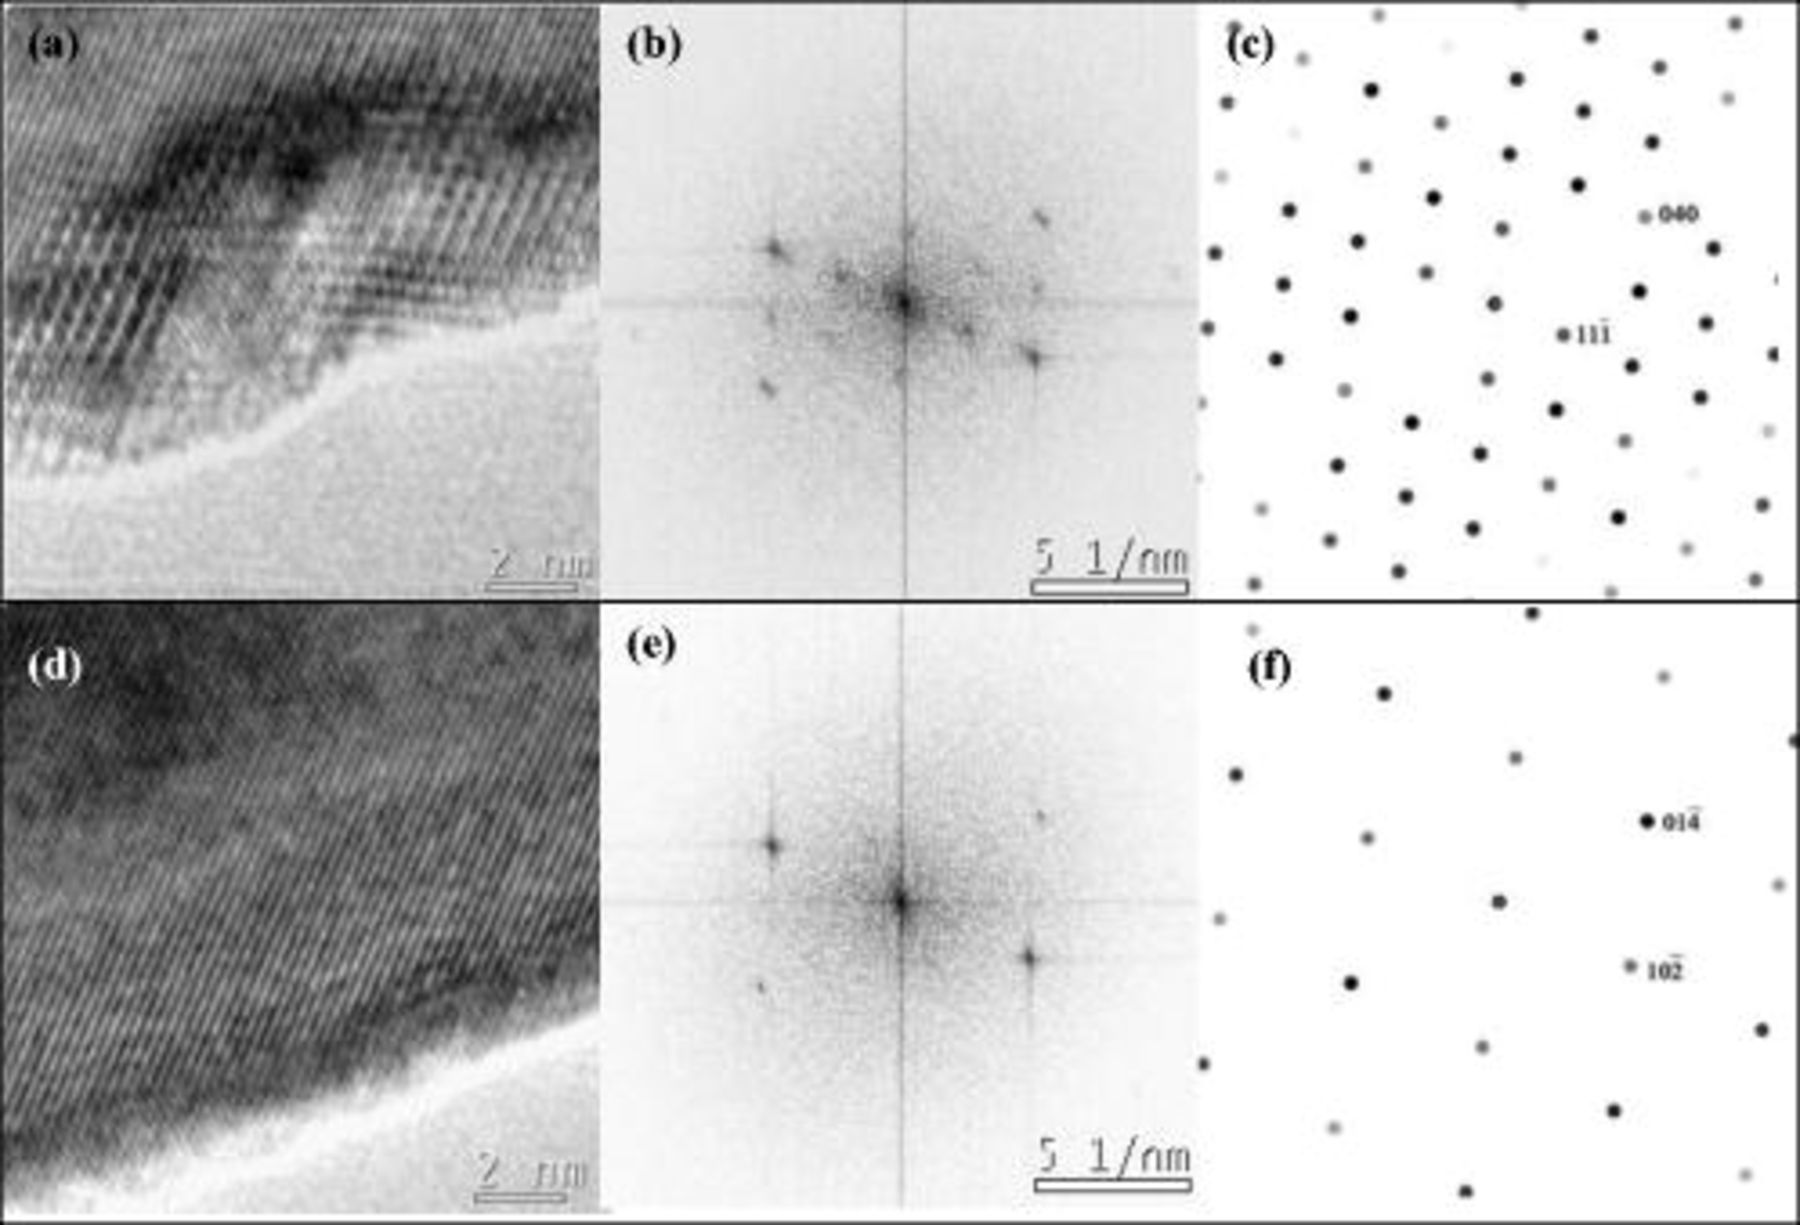
Figure 9. HRTEM image of a nodule of the  sample (a) with the corresponding FFT (b) and the simulated pattern of a cubic phase in a [101] zone axis orientation (c). HRTEM image of the matrix next to the nodule (d) with the corresponding FFT (e) and the simulated pattern of a trigonal phase in a [241] zone axis orientation (f).
In accordance with the XRD results presented above, the core of the  sample was identified as trigonal
  in a [241] orientation, as shown with the FFT pattern (Fig. 9e) and its simulation pattern (Fig. 9f) as well as from the SAED pattern shown in Fig. 10a. Nanodiffraction patterns were taken at the edge of the particle next to the nodule in order to determine if a different phase covers the surface in-between nodules. A representative pattern (Fig. 10b) reveals the presence of strong trigonal reflections from a [241] zone axis orientation diffraction pattern along with reflections of less intensity, possibly from a surface phase. This surface phase could be indexed as a cubic phase in a [101] orientation similar to the one formed within the quenched sample (Fig. 7b). The absence of {200} and {022} reflections, that may arise from double diffraction, could be an indication of a much thinner surface phase, perhaps just one or two atomic layers in thickness.
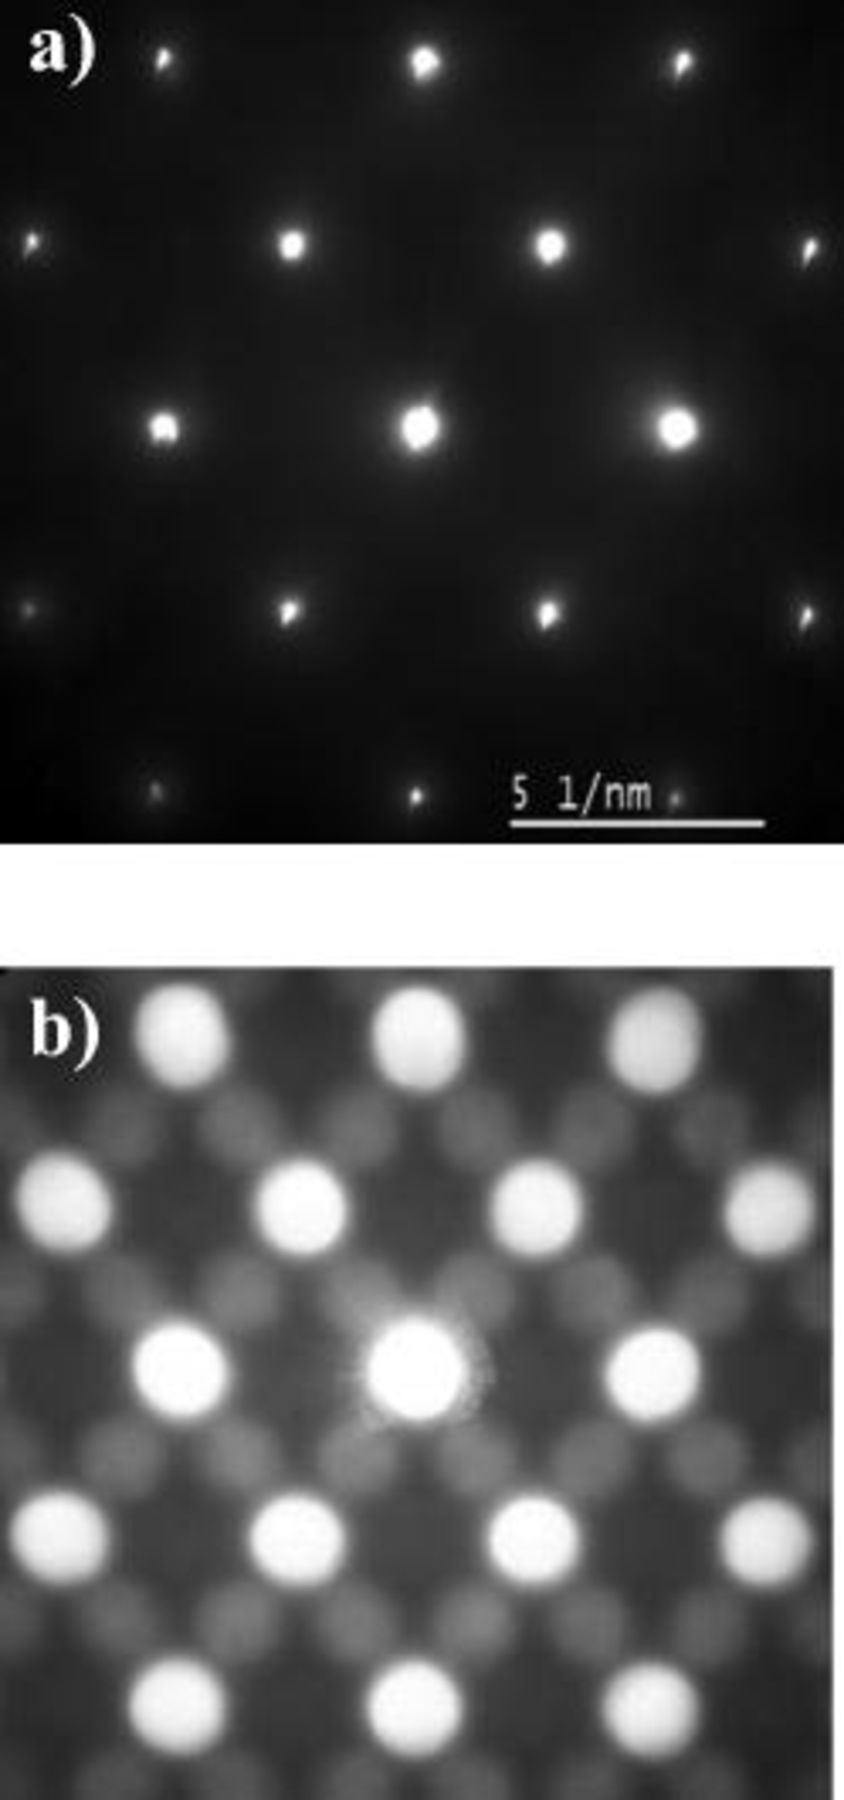
Figure 10. (a) SAED pattern of the core  sample. (b) Nanoprobe electron diffraction of the surface phase next to a nodule of the
  sample.
XPS
The XPS spectra of Co 2p (Co  and Co
  due to spin-orbit splitting) obtained for the
  samples before and after sputtering are shown in Fig. 11. The two different
  samples showed similar results before sputtering with an average Co
  binding energy of 781.3 and
  for the
  and the
  -quench samples, respectively (Table II). Because cobalt in divalent and trivalent states emerges at
  34, 35 and
  (
( standard), respectively, the surfaces of both
  samples most likely consist of a mixture of
  and
and  . A few monolayers (1–3) were removed by sputtering to examine any variation of the cobalt oxidation state as we progressed from the surface toward the core of the materials. The Co
  peaks of both types of materials shifted toward higher values. This shift in energy is brought about by the reduction of the smaller peak centered at
  associated to divalent cobalt contained within the overall Co
  peak. However, the
  sample exhibited a much more drastic change (almost a factor of 2) compared to the 1010°C-quench sample, with a
  shift vs
  , respectively, to achieve an average binding energy of
  . This value is slightly larger than the
  obtained for a
  standard in the form of
  characterized under the same conditions. While
  coexists with
  at the surface of both materials, the core of the
  sample consists of trivalent cobalt, whereas some
  remains trapped within the core of the quenched sample. This distinct change is consistent with the distinct surface phase present in the reannealed sample vs the gradual change suggested in the nanoprobe electron diffraction of the quenched sample.
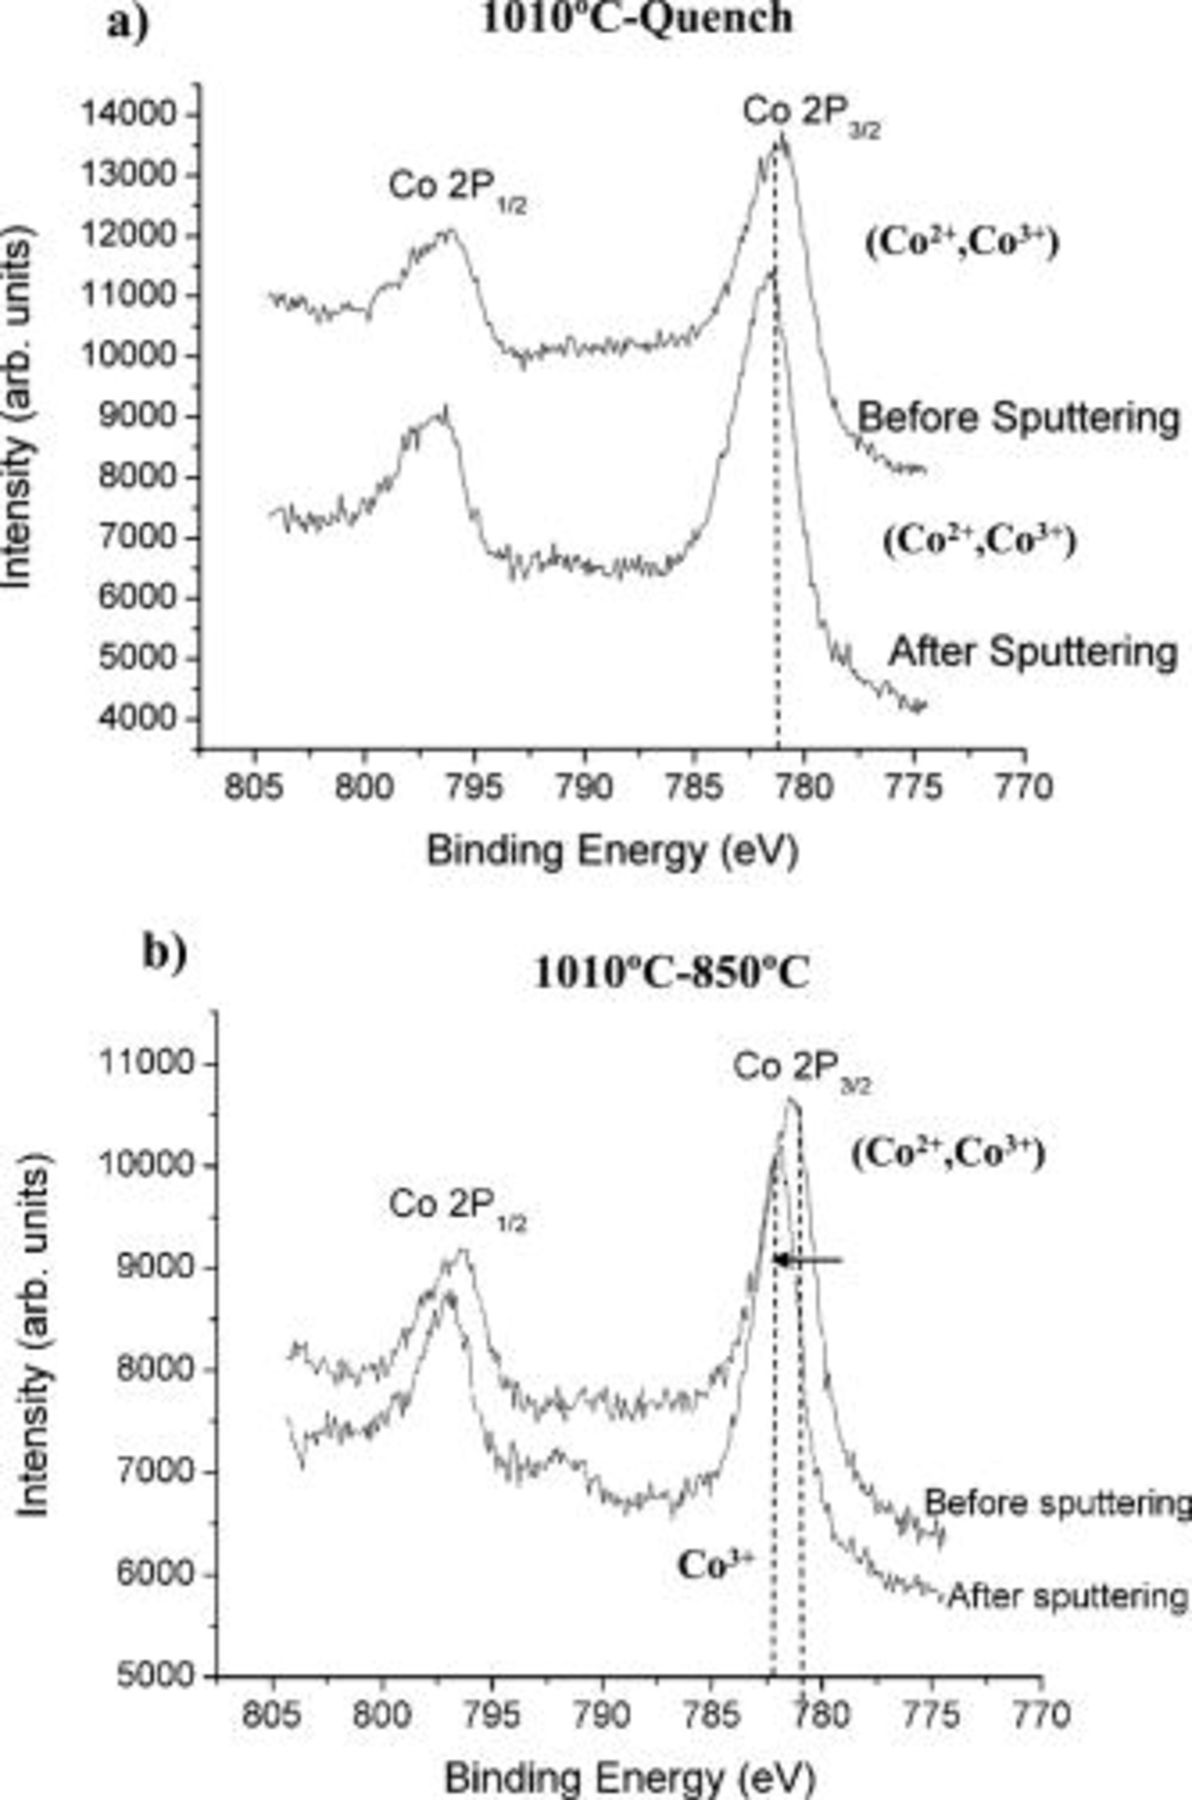
Figure 11. XPS spectra of the Co 2p peaks obtained for (a) the  -quench and (b)
  samples before and after sputtering.
Table II. Co  average binding energy obtained for the
 samples before and after sputtering.
| Sample | Co  binding energy before sputtering (eV) binding energy before sputtering (eV) | Co  binding energy after sputtering (eV) binding energy after sputtering (eV) |
|---|---|---|
 reference reference | 781.8 | — |
| 781.3 | 782.0 |
 -quench -quench | 781.2 | 781.6 |
Discussion
Progress has been made in understanding the distinct improvement in stability of  that can be brought about by short high-temperature anneals. The sample annealed at
  and then quenched exhibited poor electrochemical stability at large degrees of lithium removal, similar to the standard
  sample fabricated at
  . However, the
  sample, which had a postanneal stage at
  , displayed a drastically improved electrochemical stability than the aforementioned samples. In comparing the physical properties of the three materials, a number of important physical characteristics were systematically determined not to be a factor in the improved cycling stability. The lattice parameters were almost identical for all the samples, although the
  -quench material displayed evidence of some degree of cation mixing compared to the two other samples. In addition, the two
  samples had identical morphologies and surface areas. The key difference was demonstrated to be the formation of secondary phases on the surface of the lithium cobaltite that was annealed at
  after the
  anneal. First, we will discuss the mechanism of formation and then the relative importance of this finding.
The formation of the surface phases can be accounted for by looking at the two differing fabrication conditions focused on the  -annealed samples. A simplified schematic shown in Fig. 12 demonstrates the difference. For both samples, the
  stage results in the solid-state synthesis of trigonal
  from the precursors. A subsequent anneal at temperature in excess of
  induces the loss of lithium and oxygen in accordance with the weight loss observed by TGA above
  (Fig. 3). At such high temperatures this off-stoichiometry manifests itself as a solid solution rather than the formation of two distinct phases. Two types of Li–Co–O solid solution phases can exist. Cubic rock salt oxides of the general formula
  , with
  up to 0.2, that have been synthesized by Johnston et al. in 1958,28 can be viewed as a solid solution of
  in CoO. Lithium-rich trigonal
  (high
(high  ) consists of a solid solution of cubic CoO in trigonal
  . Both types of solid solutions display a mixture of cobalt in the divalent and trivalent state. Because the anneal at
  was short, the degree of off-stoichiometry is deemed to be small and the solid solution may be denoted as
  (where
  remains high) in the schematics of Fig. 12.
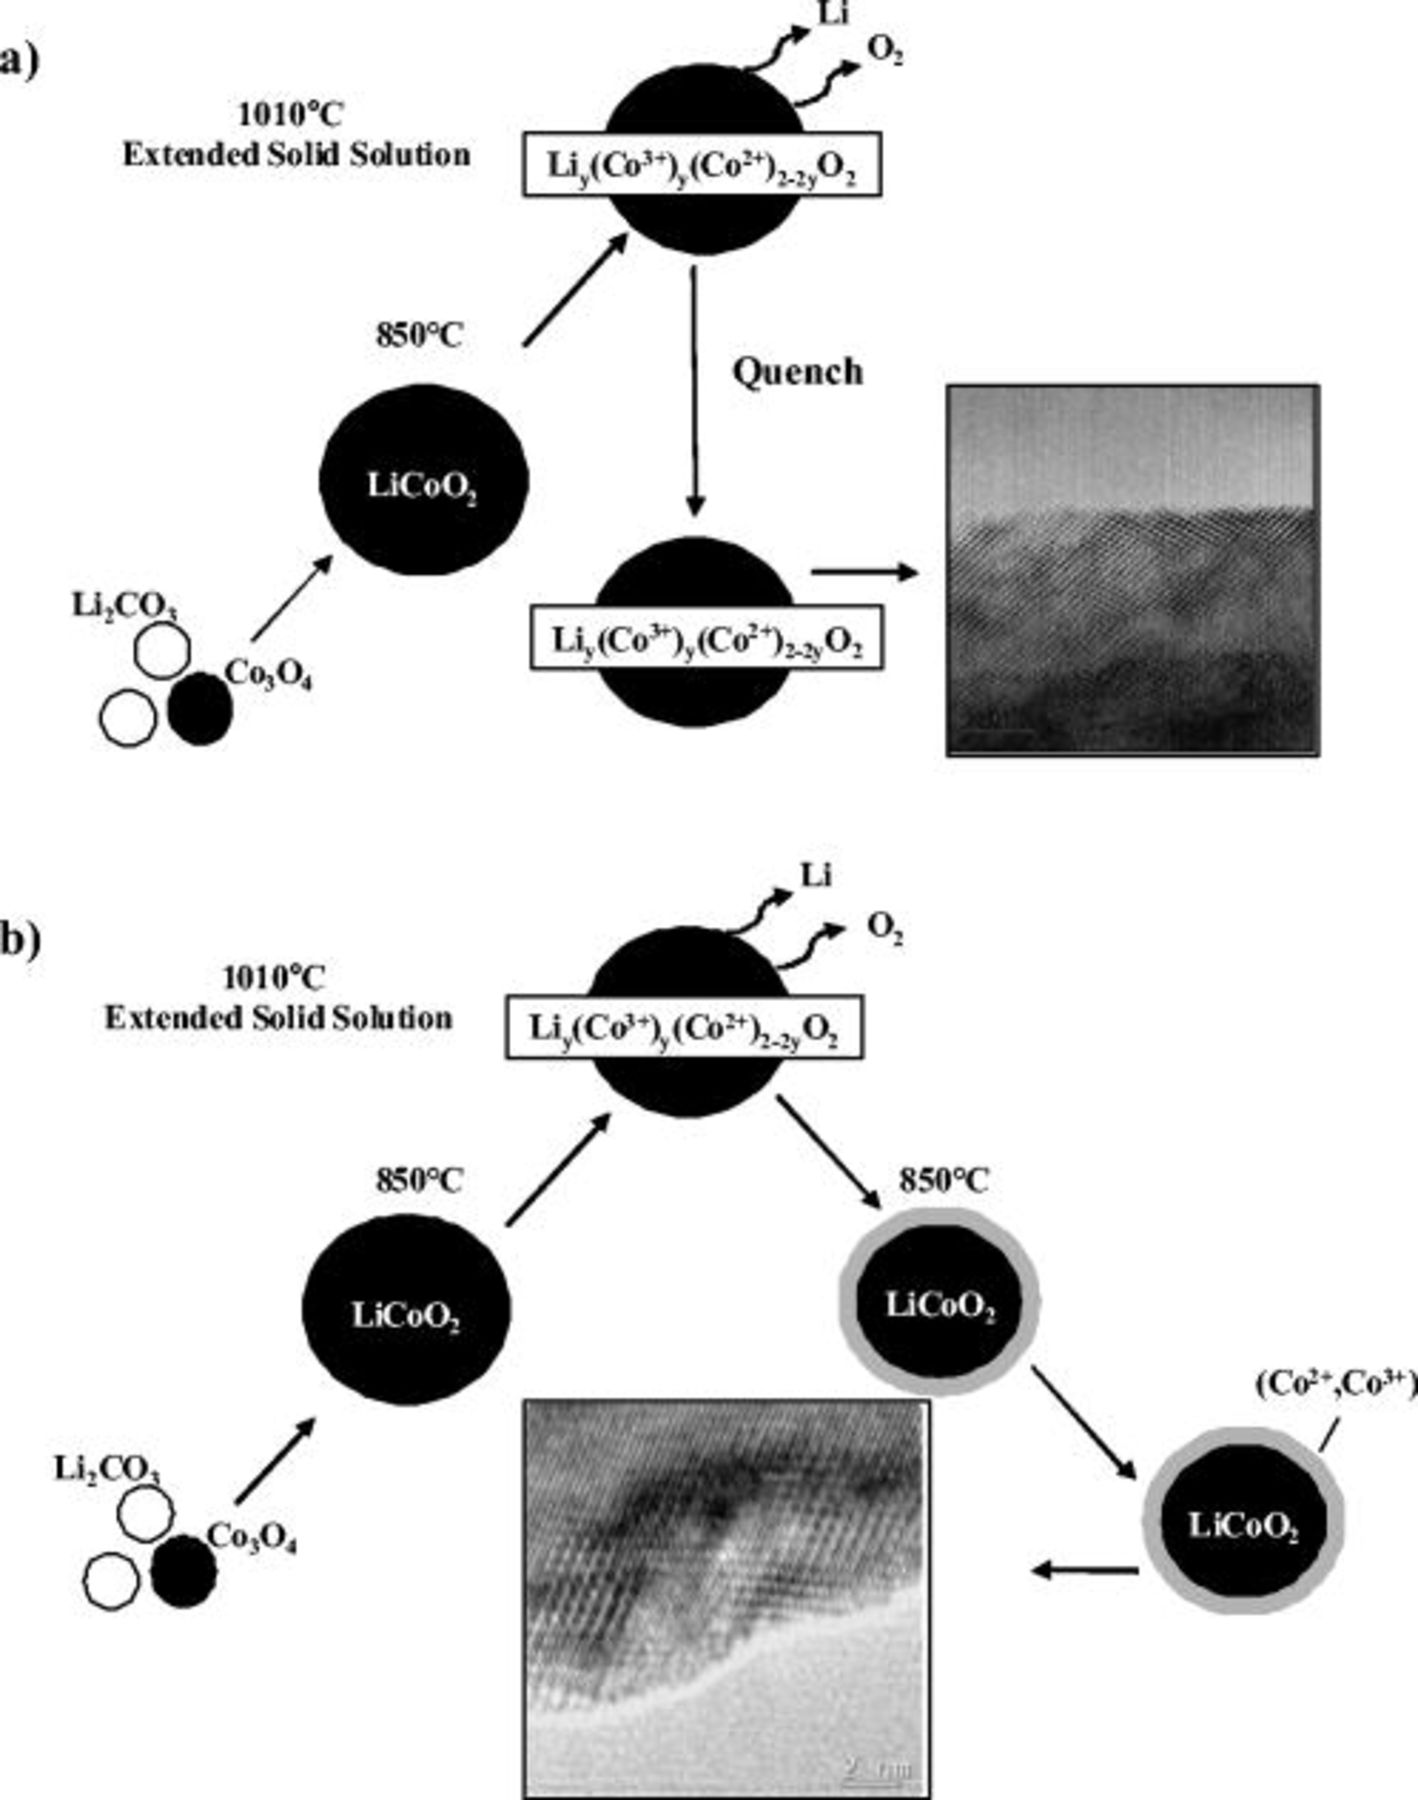
Figure 12. Schematics of the fabrication process of the two  samples: (a) the
  -quench and (b) the
  samples.
The synthesis process following the  anneal was found to profoundly affect the materials surface. Quenching the material maintained some of this off-stoichiometry within the bulk. This is supported by XPS analysis, showing
  exists both at the surface and the bulk of the particles, and by XRD analysis, showing some evidence of Co within the Li layers of the bulk. Although HRTEM revealed no visible surface phase distinction in the quench sample, the material remains in transition with a local intermix of nonstoichiometric cubic spinel and trigonal
  . The cubic spinel phase does not form a separate entity but most likely exists as sporadic "defects" within
  domains. Limiting kinetics during the
  anneal most likely generated a lithium gradient with a larger lithium and oxygen deficiency close to the surface compared to the core of the material. This would explain the fact that the cubic "defects" and divalent cobalt are more pronounced toward the surface, as demonstrated by nanoprobe electron diffraction and by XPS, respectively. Because the drop floor box furnace used in this study only allows a "slow quench" process, partial reoxidation and ordering of Co trapped in the Li layer may occur, leading to the cubic spinel intermixed phase observed by HRTEM. While the quench process maintained a single-phase material in transition, the reanneal at
  following the
  step transitions the lithium cobaltite from the solid-solution region to a multiphase region as the solubility range decreases with decreasing temperature. The phase separation that has begun in the "quenched" sample is now brought to completion, resulting in the formation of discreet nodules of
  and a
and a  thick surface film uniformly covering the remaining surface. The XPS results, which have shown the presence of
  at the surface and primarily
  within the core, is consistent with a stoichiometric
  surface and a
  core, respectively. Unfortunately, a conclusive identification of the thin layer covering the remainder of the surface besides a decrease in crystal symmetry to cubic was not possible from the preliminary HRTEM results obtained in this study.
These results clearly indicate that the surface passivation and control of the interphase chemistry is of critical importance for cycling at high degrees of delithiation, resulting in high energy densities via high average voltages and specific capacities. The other important aspect is that these results seem to indicate that the relatively large  lattice parameter change that occurs in this region has a small role to play in the loss of cycle life; it seems to be purely a surface effect. This is consistent with the results of others who have utilized surface encapsulation of prefabricated lithium cobaltite with other phases such as metal oxides,6–16 metal phosphates,17–19 and metal fluorides.20 The oxidation of cobalt to
  upon delithiation of
  generates catalytic centers for the oxidation of the electrolyte detrimental to the material's long-term cycling stability. As a result, surface passivation can provide a physical barrier that protects the lithium cobaltite from contact with the electrolyte, thereby preventing electrolyte degradation. This is consistent with the stabilization of the
  material, which exhibits distinct layers covering its entire surface. In spite of a potential above
  at the surface, it is impossible to form
  cations within the surface layers. In contrast, the absence of a protective passivation surface layer explains the poor capacity retention at high degrees of delithiation of the quenched sample. Although an interpenetrating spinel phase has been determined close to the surface, it is intermixed with the trigonal lithium cobalt oxide phase, therefore allowing the oxidation of cobalt to
  at the surface. This also seems to indicate that the systematic cobalt dissolution that was observed for
  cycled to high degrees of delithiation is induced by the surface only and not bulk structural changes.
The use of the demonstrated thermodynamically induced phase separation may have advantages over postfabrication coating techniques. The first and most important is that the phase will be uniformly coated and can be controlled to occur to very small dimensions. Secondly, the stabilization can be brought about with the use of an electronically conductive surface as opposed to insulating coatings generally proposed with the postfabrication coating techniques. The latter technique can bring about degradation of the rate capability of the lithium cobalt oxide material.9 Finally, use of the proposed technique enables a low-cost, fast fabrication. Although high specific capacities are enabled, other attributes such as thermal stability and safety must be taken into account before such materials can be considered of practical importance.
Conclusions
Thermodynamically induced phase separation can be used to form  surface layers on
  . Physical and electrochemical analysis revealed that a marked improvement in cycling stability to
  at
at  was directly attributed to the formation of these surface phases. This conclusion was reached after an extensive array of characterization which revealed that morphological, crystallographic, and structural characteristics could not account for the observed improvement. The thermodynamic method introduced here, consisting of engineering thermally induced phase stoichiometry, nucleation, and growth, leads to a very uniform, conformal, and complete coating. Such methodology may have certain advantages in the formation of interface and interphase-stabilized intercalation compounds in the future.
Rutgers, The State University of New Jersey, assisted in meeting the publication costs of this article.