Abstract
Silicon/disordered carbon (Si–DC) nanocomposites have been synthesized by high-energy ballmilling of Si-sucrose and silicon–polyvinyl alcohol followed by pyrolysis under argon flow. The exact disordered carbon content in the as-prepared Si–DC nanocomposites was determined by thermogravimetric analysis for the first time. Based on the thermogravimetric analysis, X-ray diffraction, Raman, and cyclic voltammetric results, we believe that carbon distribution on the Si particles in Si–DC nanocomposite using PVA as the carbon source is more uniform and has higher efficiency than that using sucrose as the carbon source, under the same preparation conditions. The carbon content and the starting polymers significantly affect the electrochemical performance of the Si–DC nanocomposites. The optimized Si–DC nanocomposite anode demonstrated a reversible capacity of  within 20 cycles.
Export citation and abstract BibTeX RIS
Lithium-ion batteries have become the power source of choice for consumer electronic devices such as cell phones and laptop computers due to their high energy density and long cycle life. In addition, lithium-ion batteries are expected to be a major breakthrough in the hybrid vehicle field. Despite their successful commercial application, further performance improvement of the lithium-ion battery is still required.
Graphitic or graphitization carbons have been used extensively as negative electrode materials for lithium-ion batteries. However, the lithium storage capacity of graphite as associated with its maximum  stage1 is limited to
  . Lithium alloys are also attractive anode candidates because they can incorporate large amounts of lithium. For example,
  has a theoretical capacity of
  . However, lithium alloys are brittle and hence easily pulverized by the large volume change in charge and discharge reactions. The resulting loss of connectivity with the conducting additive particles causes poor cyclability in practice.2–5 To circumvent this problem, several research efforts have been focused on composites consisting of silicon and carbonaceous materials. For instance, Wilson and Dahn6 have synthesized nanodispersed silicon in carbon using chemical vapor deposition (CVD). Although the Si–C anodes demonstrated a reversible capacity of
  , it is difficult to control the morphology of Si and C when using the CVD approach. Yoshio et al.7 prepared carbon-coated silicon by a thermal vapor deposition (TVD) method, and a better cycle life than with the respective silicon has been achieved. Composite produced by mechanically mixing silicon and graphite (or acetylene black) shows high capacity but its cycling is still poor.8 More recently, research work by many groups has demonstrated that silicon/disordered carbon (DC) composite, obtained by mechanically milling and pyrolyzing organic precursors, such as polyparaphenylene (PPP) or polyvinyl chloride (PVC), in an inert gas atmosphere can reversibly insert Li atoms with a capacity
  greater than that of graphite
  .9, 10 Although the electrochemical performance is significantly improved compared with the respective silicon electrodes, the silicon-disordered carbon systems still pose some problems, such as a relatively high capacity fading rate and a relatively low capacity contribution from the disordered carbon (
 from PVC-based disordered carbon;
  from PPP-based disordered carbon). Recently, it was reported that the disordered carbon prepared by pyrolyzing hexa(phenyl)benzene (HPB) demonstrated a stable capacity on the order of
  .11 Carbon from pyrolyzed sugar under optimal conditions showed a large reversible capacity of
  .12 Therefore, the optimization of the silicon-disordered carbon system and further improvement of the silicon-disordered carbon concept are necessary.
In this paper, a series of Si–DC samples were synthesized by mechanical milling of Si–sucrose and Si–polyvinyl alcohol (PVA) followed by pyrolysis. Here sucrose was chosen because the DC obtained by sugar pyrolysis shows a large reversible capacity  ;12 PVA was used because it gives the maximum yield of amorphous carbon compared to other polymers.13 The disordered carbon content in Si–DC nanocomposites was determined by thermogravimetric analysis (TGA) analysis for the first time. The electrochemical properties of the obtained Si–DC nanocomposites as anodes in lithium-ion cells were systematically evaluated.
Experimental
Preparation and characterization of Si–DC nano composites
Si powder (average particle size 80 nm) and PVA (Aldrich) or sucrose with weight ratios of silicon vs PVA or sucrose from  to
to  were mechanically milled for 10 h to obtain Si–polymer composites with the Si particles coated with polymer. The mixture was then heated at 600°C under argon flow for 2 h at a heating rate of
  and cooled to room temperature at a natural rate. The as-prepared Si–DC nanocomposites were characterized by scanning electron microscopy (SEM, Leica/Cambridge Stereoscan 440) and X-ray diffraction (XRD) with Cu
  radiation (MO3xHF22, MacScience, Japan). Raman spectroscopy was used to monitor the variations in the carbon using a JOBIN YVON HR800 Confocal Raman system with 632.8-nm diode laser excitation on a
  grating at room temperature. The precise DC concentration in Si–DC nanocomposites was determined using TGA/differential thermal analysis (DTA) via a Setaram TGA/DTA apparatus. The samples were heated in an alumina crucible from room temperature to 900°C at
  in air.
Electrochemical characterization
Teflon-type and coin cells were assembled for electrochemical characterization of Si–DC nanocomposite electrodes. The testing electrodes were made by dispersing 80 wt % active materials, 15 wt % carbon black, and 5 wt % polyvinylidene fluoride (PVDF) binder in dimethyl phthalate solvent to form a slurry. The slurry was then spread onto a copper foil and dried in a vacuum oven. The electrodes were Φ 12-mm disks, and the weight of the electrodes was about 1.5 mg. The cells were assembled in an argon-filled glove box (MBraun, Unilab, USA). The electrolyte was 1 M  in a mixture of ethylene carbonate (EC) and dimethyl carbonate (DMC) (
 by volume, provided by Merck KgaA, Germany). The cells were galvanostatically charged and discharged at
  over the voltage range 0.02–1.2 V vs
  . Cyclic voltammetry (CV) measurements were carried out on a potentiostat (model M362, EG&G PAR, USA) at a scanning rate of
  .
.
Results and Discussion
Determination of carbon content in the Si–DC nanocompo sites
Although there have been some investigations on Si–C composite anodes for lithium-ion batteries,6–10 the exact content of carbon in the Si–C composites or the detailed structure and morphology of the carbon have not been addressed. It is well known that the content, structure, and morphology of polymer pyrolyzed carbon are affected by the sintering temperature, gas flow rate, polymer precursors, etc.12 In order to optimize the Si–C composites, it is really necessary to determine the exact carbon content in  composites.
When heated in air, carbon in  nanocomposites is burnt and releases gas (mainly
  , constituting a weight loss), while Si in the nanocomposites is oxidized and
  is formed (weight gain). Therefore, it is hard to identify the weight loss region where carbon is burnt. A calibration curve is necessary to calculate the carbon ratio in
  nanocomposites. In order to obtain the calibration curves, TGA was carried out on
  mixtures with certain known
  ratios (with the carbon obtained by pyrolyzing sucrose or PVA under the same conditions). The TGA curves and calculated calibration curves are shown in Fig. 1. Then TGA on as-prepared
  nanocomposites was conducted. The value of the mass loss percentage was taken at the lowest point of the TGA curves and converted into the real content (Table I) of carbon in the
  nanocomposite according to the equation of the fitted curve in Fig. 1b. The carbon concentrations obtained were significantly below the levels originally targeted. For example, when we added enough PVA to produce
  C
C  , we actually achieved
  C in the final powder due to carbon burnt out in the sintering stages of Si–DC synthesis.
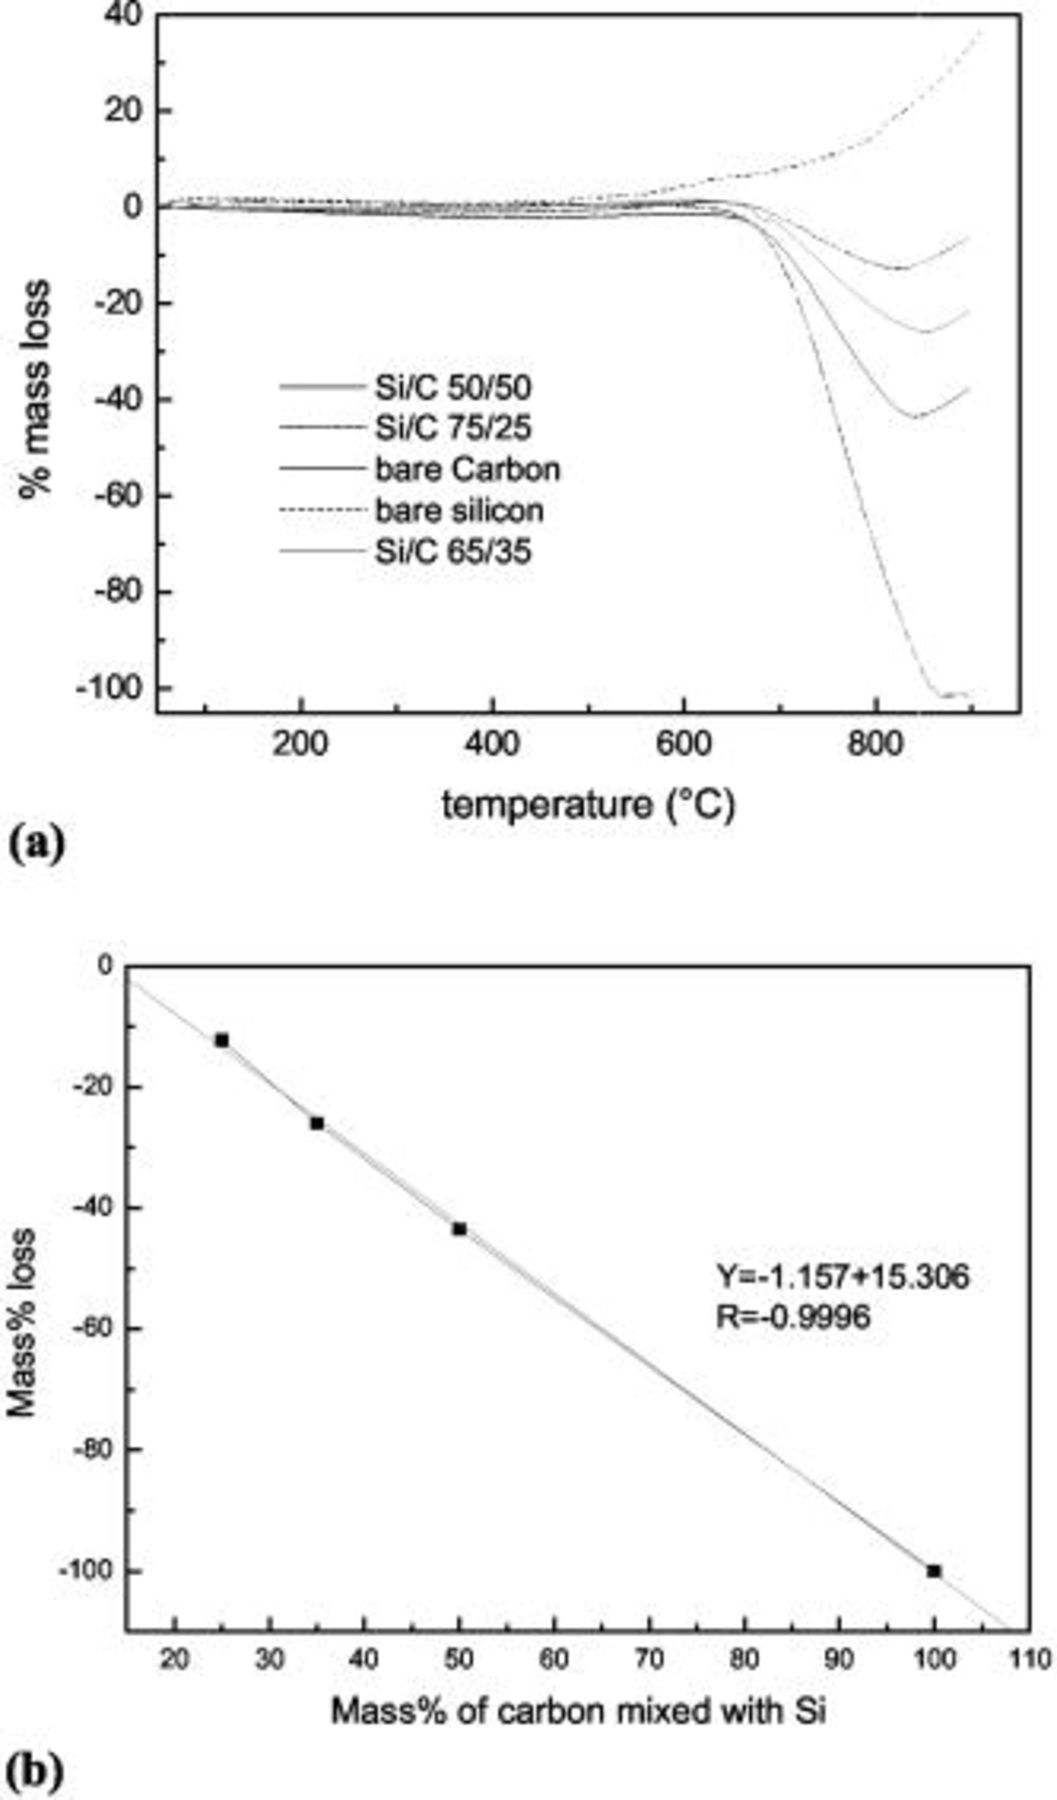
Figure 1. (a) TGA curves of  mixtures with different
  ratios and (b) the calibration curve worked out from the TGA curves above.
Table I. Theoretical and real carbon concentrations in  nanocomposites synthesized from different carbon sources.
| Samples | Theoretical (targeted) weight % of carbon | Weight % of carbon | Mass loss % of carbon (%) |
|---|---|---|---|

| 33.7 | 28.9 | 14.24 |

| 27.8 | 23.7 | 14.74 |

| 12.6 | 10.3 | 18.25 |

| 49.1 | 28.6 | 41.75 |

| 43.6 | 20.4 | 53.21 |

| 27.3 | 7.5 | 72.52 |
Structure and morphology analysis of Si–DC nanocompo sites
Figure 2 shows XRD patterns of high-carbon-content Si–DC nanocomposites from  and
and  , respectively. (Discussion is focused on the Si–DC nanocomposites from
  and
and  because their real carbon contents are similar, i.e., 28.6 and 28.9%.) The XRD pattern of the bare Si sample is also presented for comparison. No peaks corresponding to carbon can be seen, which suggests that the carbon obtained by pyrolyzing sugar or PVA is amorphous. The peaks due to Si diffractions can be clearly observed, and the intensity of the Bragg peaks of silicon for Si–DC nanocomposites is higher than that of the bare Si. In addition, although both Si–DC nanocomposites were obtained at the same temperature (600°C), the intensity of the Si Bragg peaks for Si–DC from
  is slightly higher, indicating that the size of the silicon crystallites is bigger compared to that of Si–DC from
  . The crystallite size of Si was calculated using the Scherrer equation,14 and the calculated crystallite sizes of Si in the bare Si, Si–DC from
  , and Si–DC from
  are 11, 17, and 59 nm, respectively. A possible interpretation for this phenomenon is the amount and rate of pyrolysis gases (especially
  ) released from sucrose and PVA are different. For the Si–DC from
  , more pyrolysis gases are released based on the carbon content analysis results (Table I). The gases are released very fast, which efficiently prevents the growth of silicon crystallites. No SiC phase peak was found in samples produced under the present pyrolyzing conditions. Wilson and Dahn reported that SiC is formed in carbons containing nanodispersed Si atoms if the content of silicon exceeds 11 atom %.6 Wilson et al. utilized gases as the starting materials, whereas we used polymers as the carbon source and adopted nano-Si powder as a starting material. This may be one of the reasons why no crystalline SiC was produced.

Figure 2. XRD patterns of (a) Si–DC nanocomposite pyrolyzed from  ; (b) Si–DC nanocomposite pyrolyzed from
  ; and (c) bare Si sample.
Laser Raman spectroscopy gives information about the vibrations of atoms in crystals and molecules and can be used as a complementary tool to XRD. Figure 3 shows the Raman spectra of Si–DC nanocomposites. The Raman spectra of graphite and the bare disordered carbon pyrolyzed from sucrose are also shown for comparison. Two main peaks were observed at around 1350 and  , which are designated as the D band and the G band,15 respectively. The G band is associated with the allowed
  optical modes of the Brillouin zone center of the crystalline graphite, while the D band is attributed to disorder-allowed phonon modes, which become Raman active as a result of lack of long-range order in amorphous graphitic materials.16 Another small Raman band at
  is also observed, which is the upward shift of peak G due to disorganized carbon.17 The relative intensity ratio of the D and G bands,
  , is known to depend on the structural characteristics of carbon.18 The ratio can give information about the perfection of the graphite layer structure, reflecting the properties of the edge plane or boundary of the graphite crystal faces. As the
  ratio increases, the defect structure increases and the degree of graphitization becomes less.19 All the
  ratios are listed in Table II. The
  ratio of carbon produced by pyrolyzing sugar is almost four times higher than that of graphite, suggesting high disorder of the carbon sample. For the Si–DC nanocomposites, only one Raman band at about
  , corresponding to a Si lattice vibration, is observed, except for the three peaks assigned to disordered carbon, indicating that the carbon in Si–DC nanocomposites is still disordered carbon.
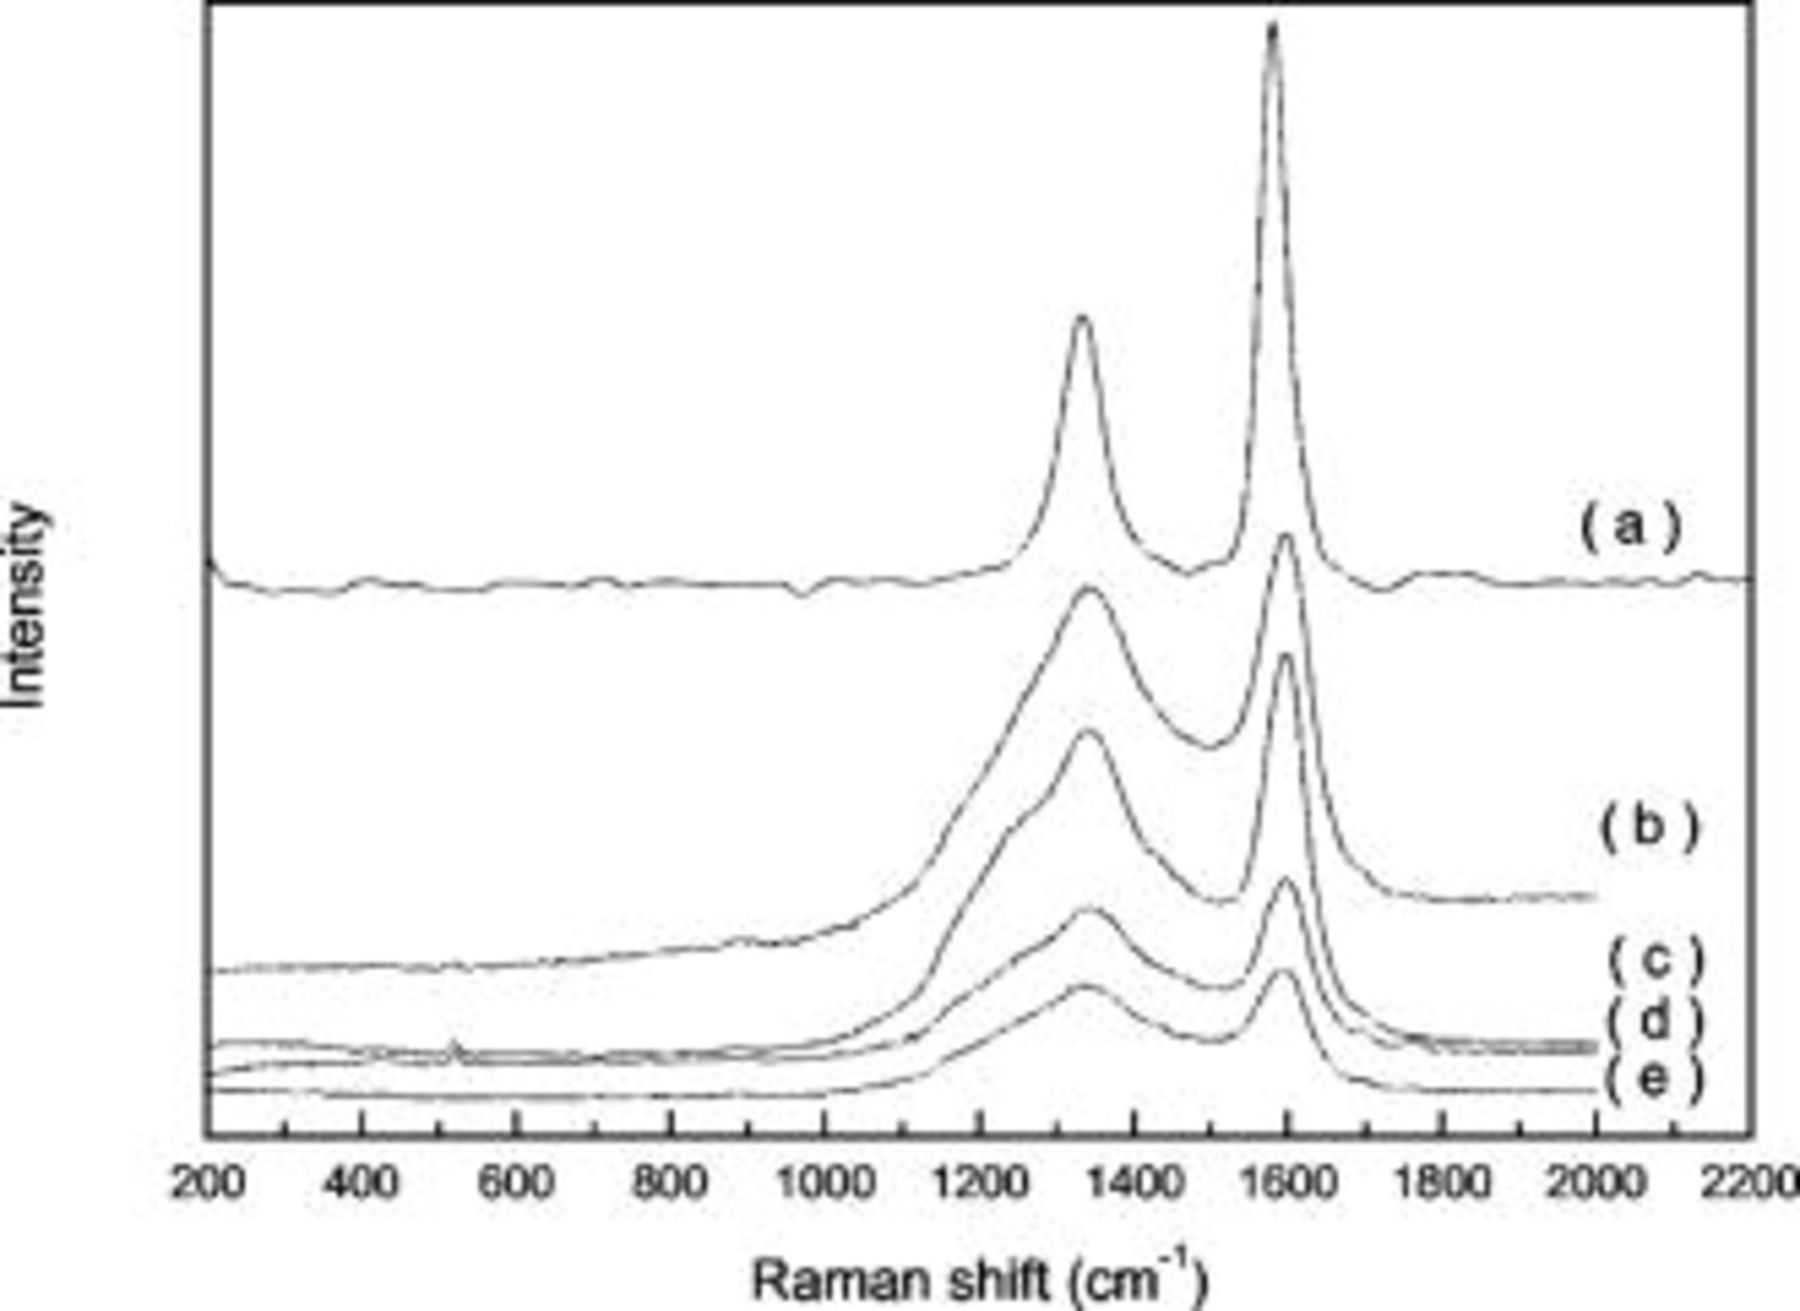
Figure 3. Raman spectra of Si–DC nanocomposites from (a) graphite; (b)  ; (c)
; (c)  ; (d)
; (d)  ; and (e) disordered carbon produced by pyrolyzing sucrose.
Table II. The relative intensity ratio of the D and G bands  obtained from experimental spectra shown in Fig. 3.
| Samples |

|
|---|---|
| Graphite | 0.53 |

| 2.46 |

| 2.38 |

| 2.35 |
| Disordered carbon produced by pyrolyzing sucrose | 2.41 |
SEM images of Si–DC nanocomposites compared with disordered carbon pyrolyzed from sucrose are shown in Fig. 4. Note the change in powder morphology depends on the polymer carbon source and its ratio. For bare disordered carbon (Fig. 4c), a nonuniform morphology, comprising differently shaped flakes, is shown. Compared with Si starting powder, the particles of all Si–DC nanocomposites become dense and less porous, especially for the Si–DC nanocomposite from  . This result is in good agreement with results obtained from XRD. EDX mapping of the different elements was conducted to analyze the distribution of the species within the agglomerated particles (Fig. 5). The bright spots correspond to the presence of each element. Based on the EDX elemental maps, C in the Si–DC nanocomposite from
  is not completely well-distributed, while the distribution of C in the Si–DC powder from
  is more homogeneous. These indicate that a uniform distribution of C on all the particles is not easily achieved by pyrolyzing sucrose, but a more uniform carbon coating on silicon particles can be achieved by pyrolyzing PVA.
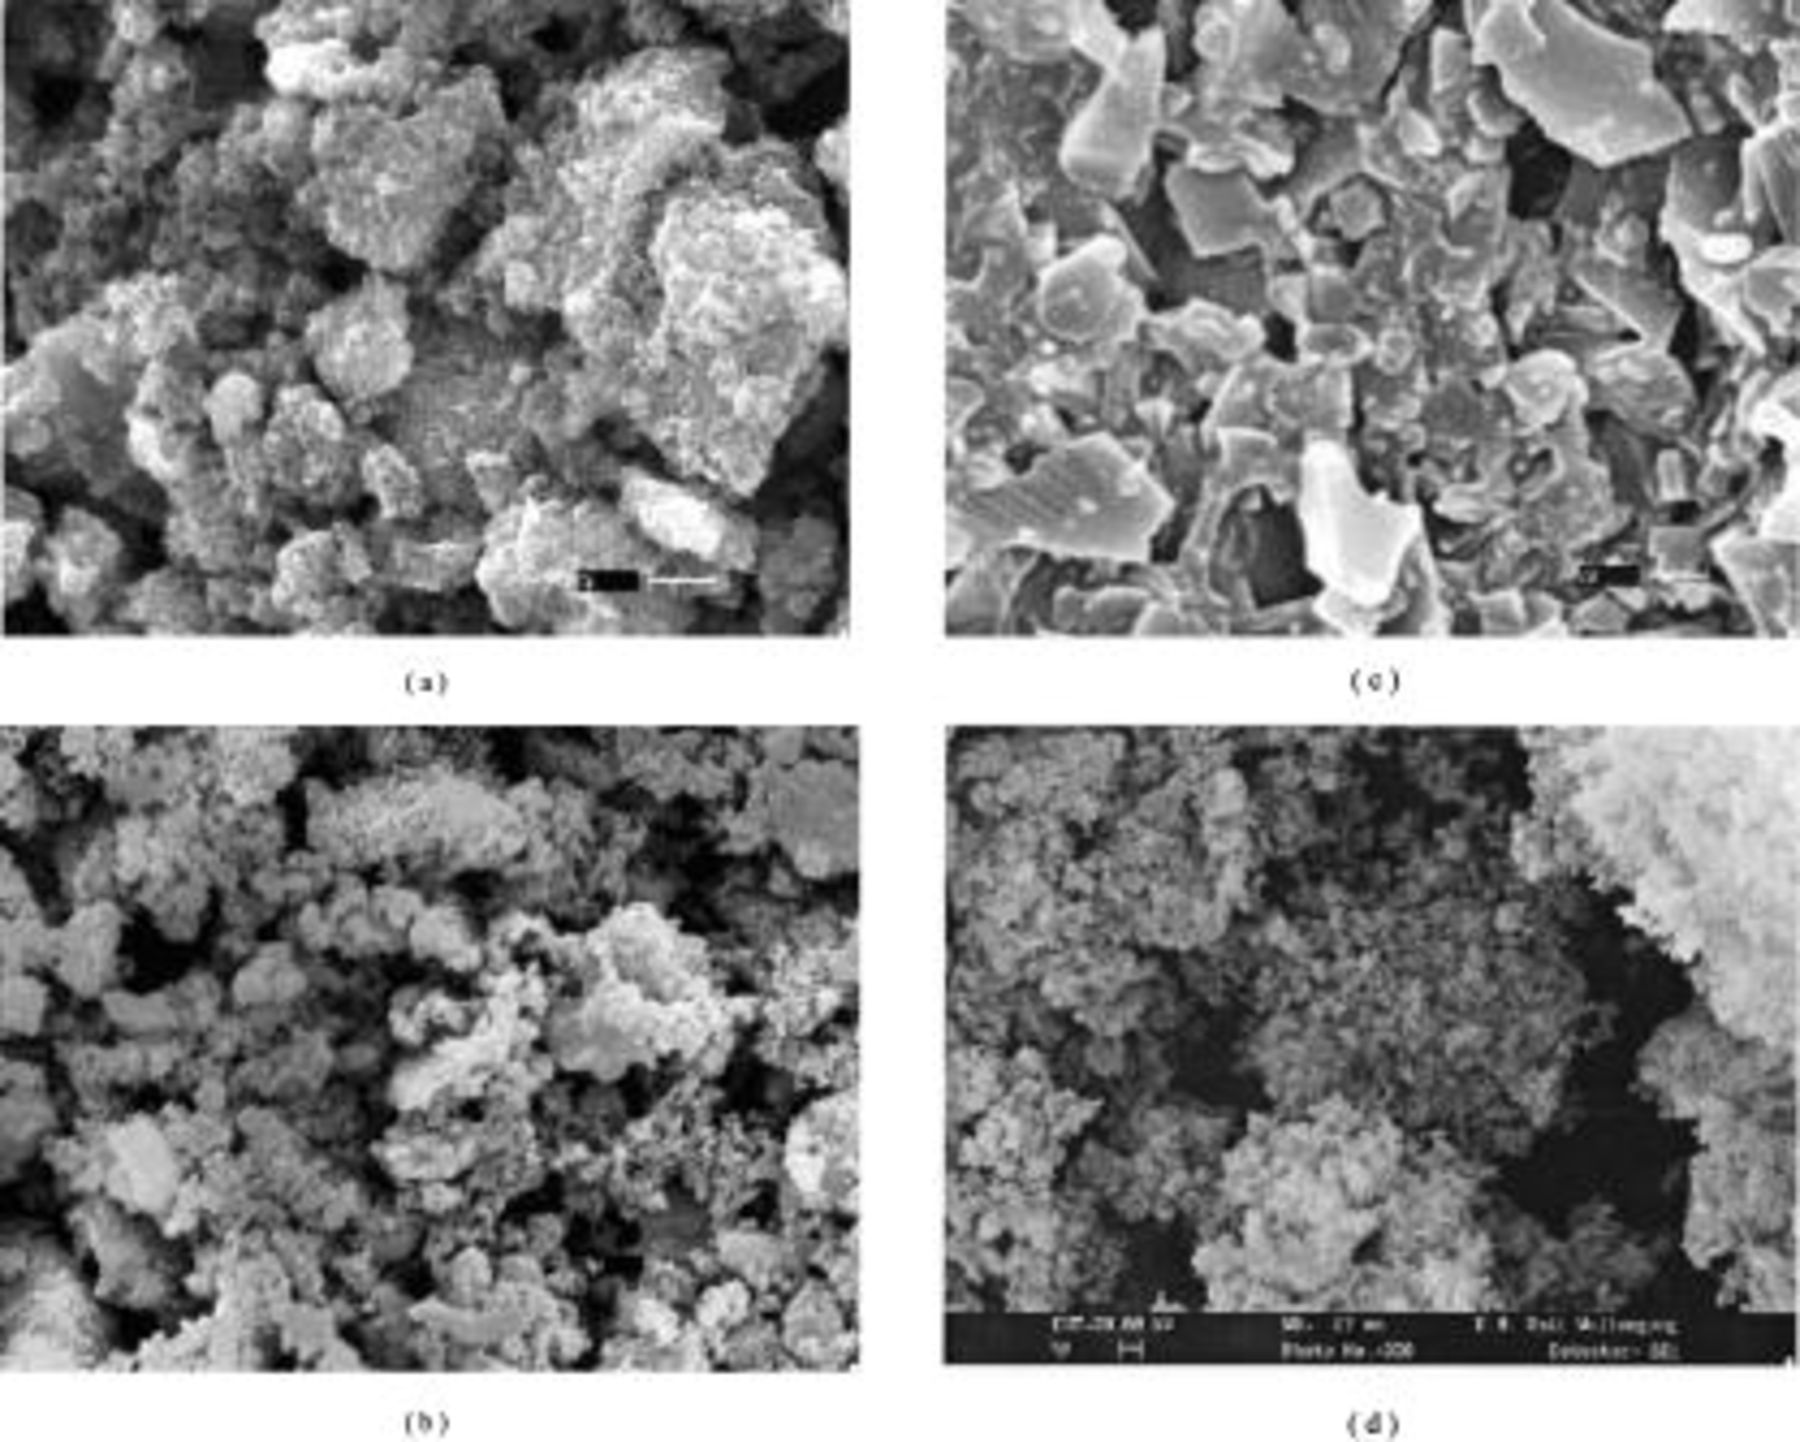
Figure 4. SEM images of (a) Si–DC nanocomposite pyrolyzed from  ; (b) Si–DC from
  ; (c) disordered carbon obtained by pyrolyzing sucrose; and (d) Si starting materials.
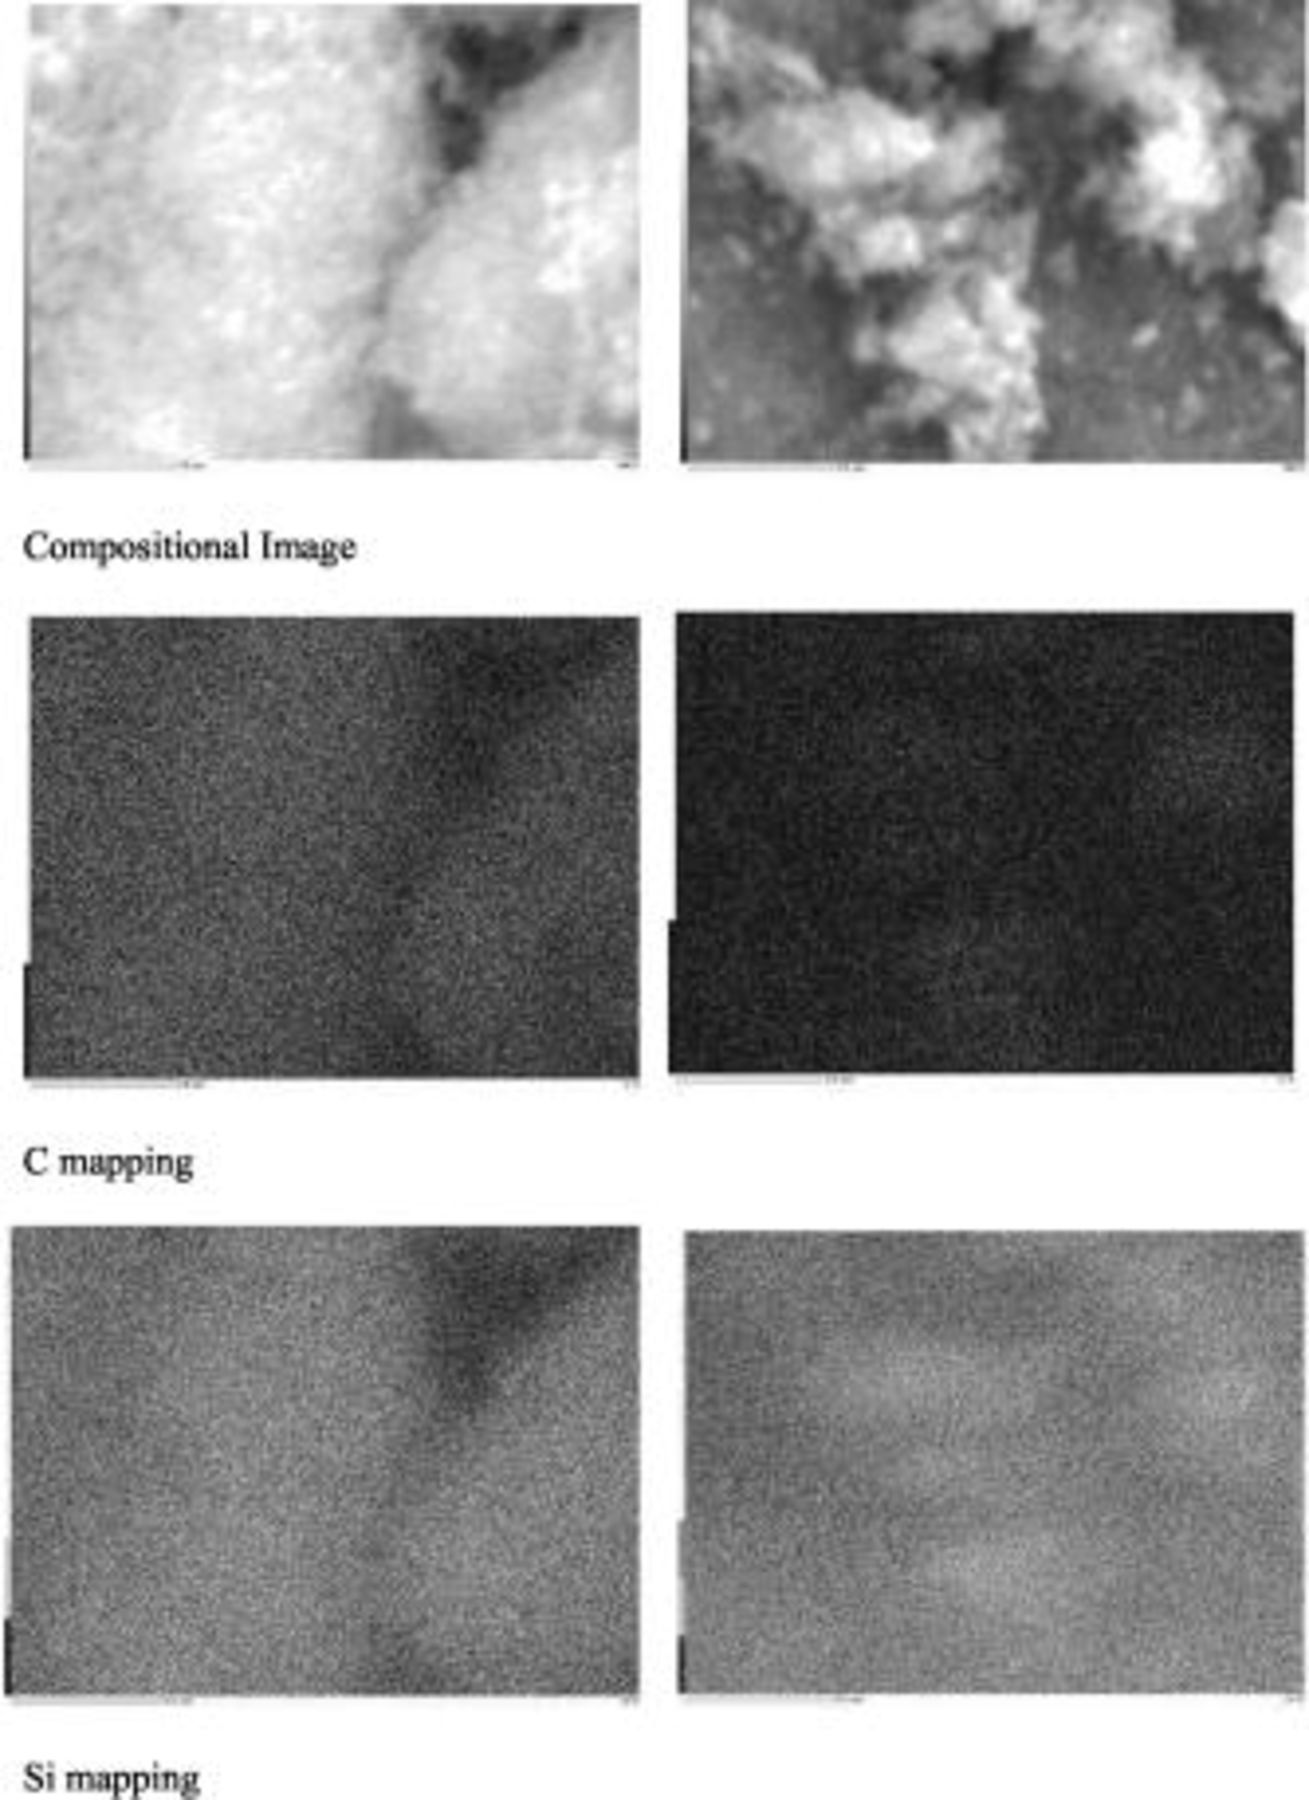
Figure 5. EDX mapping of Si–DC nanocomposites by pyrolyzing  (left) and
  (right).
Electrochemical performance of Si–DC nanocomposites
CVs of Si–DC nanocomposite electrodes in lithium-ion cells, in which a lithium foil was used as the counter electrode and reference electrode, are shown in Fig. 6. The three-electrode CV cells were cycled at a scan rate of  . For the Si–DC nanocomposite from
  , the irreversible peak of electrolyte decomposition ranging from 0.5 to 1.1 V vs
  can hardly be seen, which implies that the electrolyte decomposition on the surface is suppressed to a small extent by the carbon coating.7 By contrast, the irreversible peak corresponding to the electrolyte decomposition is clearly observed in CVs of both Si–DC nanocomposite electrodes from
  and
and  . This may suggest that the Si particles in Si–DC nanocomposites from
  and
and  were not effectively covered by the carbon coating. From the TGA results, the carbon content in Si–DC from
  is only 7.5%, which may not be high enough to fully cover the Si particles. For the Si–DC nanocomposites from
  , although the carbon concentration is 28.9%, slightly higher than that of
  (28.6%), the irreversible peak from 0.5 to 1.5 V in the first cycle still existed, implying that the pyrolyzed carbon is not uniformly decomposed on the surface of the silicon. By comparison of the CVs of all the electrodes, it was found that the peak shapes were slightly different. For the Si–DC nanocomposites from
  and
and  , there are two anodic peaks that can be clearly seen at about 0.36 and 0.54 V vs
  , respectively. A shoulder peak at about 0.2 V vs
  can also be observed. These peaks originate from the phase transitions between
  , and Si, respectively.4 However, for the
  sample, the two anodic peaks at about 0.36 and 0.54 V vs
  are not clearly split. Instead, the anodic current begins to rise up at a slope from 0.3 V vs
  and merges with the anodic peak at 0.54 V, which may be caused by the large polarization of the electrode. These phenomena suggest that a high content of pyrolyzed carbon could effectively decrease the inner resistance of silicon electrodes due to the high conductivity of the carbon, thereby decreasing the polarization of the silicon electrodes.
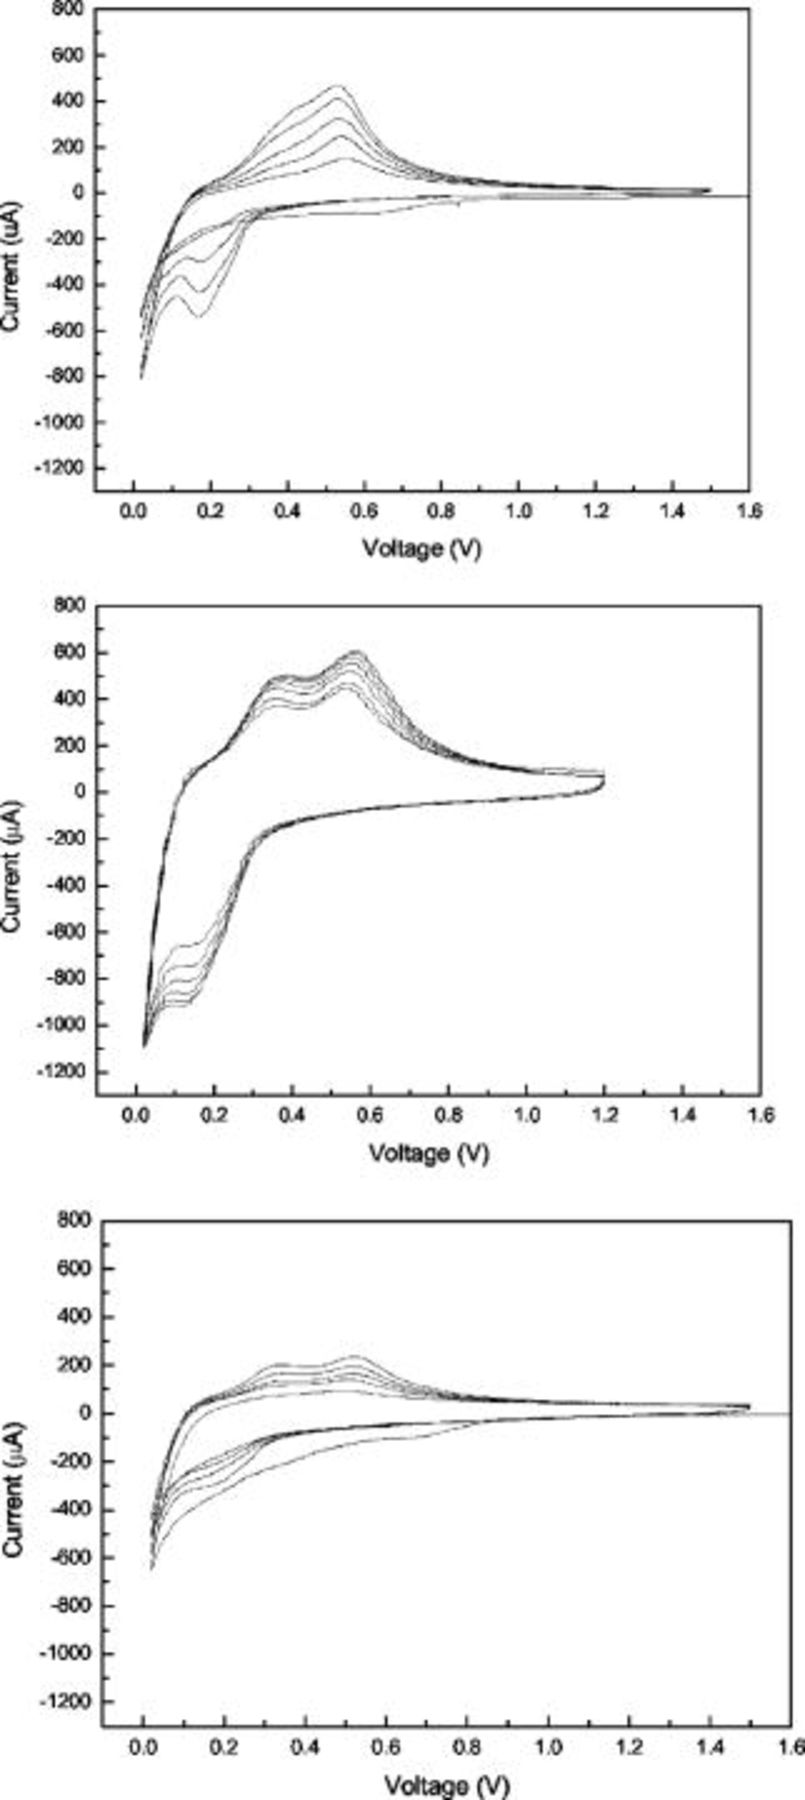
Figure 6. CVs of Si–DC nanocomposites from  (upper);
  (middle); and
  (lower), respectively.
The 1st, 3rd, 5th, and 10th charge/discharge curves of Si–DC nanocomposite electrodes from  and
and  are shown in Fig. 7. In the first cycle, the discharge capacities (intercalation of lithium into the Si-based electrode) were 1165 and
  , while the charge capacities (deintercalation from the Si-based electrode) were 935 and
  for Si–DC nanocomposite electrodes from
  and
and  , respectively. Thus, the coulombic efficiency in the first cycle for Si–DC nanocomposite electrodes from
  was 80.3%, while it was much lower for Si–DC nanocomposite electrodes from
  (67.1%). This result is consistent with that from CV and further demonstrates that the carbon coating achieved by using PVA as the carbon source on Si particles is more uniform and produced more efficiently than that produced by using sucrose as the carbon source. In addition, a potential plateau at about 0.4 V can be observed in the first few cycles in the charge curves; however, it gradually becomes more sloped and shorter during charge/discharge cycling, which indicates that some irreversible structural changes have occurred and the amount of Li extraction from silicon in the Si–DC nanocomposite electrodes has decreased.
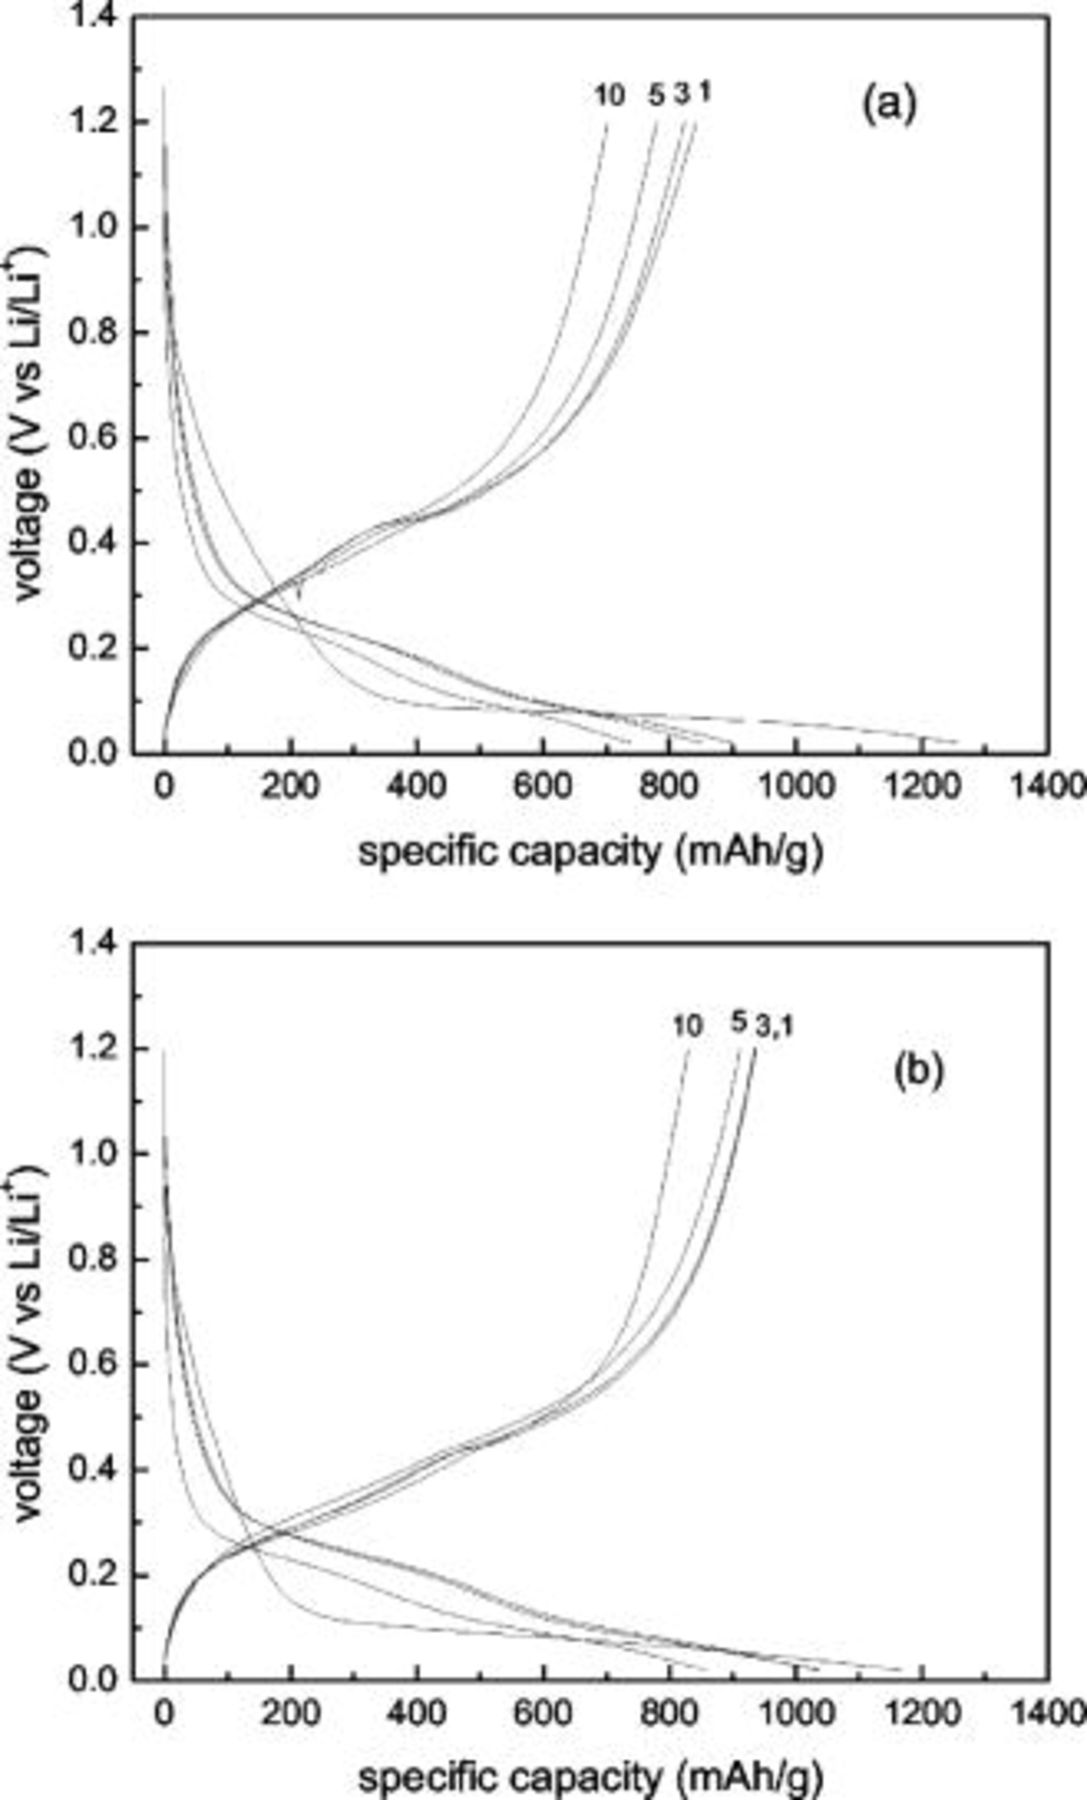
Figure 7. The 1st, 3r, 5th, and 10th charging/discharging curves for the  nanocomposites obtained by pyrolyzing (a)
  and (b)
  .
.
The reversible capacities as a function of cycle number are compared in Fig. 8. The reversible capacity is up to  after 20 charge/discharge cycles, which suggests that the nanocomposite materials are promising as anode materials for Li-ion batteries. From Fig. 8, we can also see that the cycle life decreases in order as follows: Si–DC from 90% PVA/10% Si> Si–DC from 80% PVA/20% Si Si–DC from 80% sucrose/20% Si>Si–DC from 67% sucrose/33% Si Si–DC from 50% PVA/50% Si>Si–DC from 30% sucrose/70% Si In Si–DC nanocomposites, the nanosized silicon particles are separated and coated by disordered carbon, which could not only suppress the decomposition of electrolytes on the surface of Si-based electrode, but also provide integral and continuous electric contact networks around Si particles even when they are slightly expanded after lithium insertion.7 It is obvious that the carbon content and starting polymer used significantly affect the capacity and cycling behavior of Si–DC nanocomposite electrodes. We believe that the electrochemical performance of Si–DC nanocomposites can be further optimized through tuning the material processing. A more detailed study of the effects of preparation conditions, such as mill design, sintering temperature and time, gas flow rate, heating rate, and starting polymer, on electrochemical performance is in progress in our laboratory.
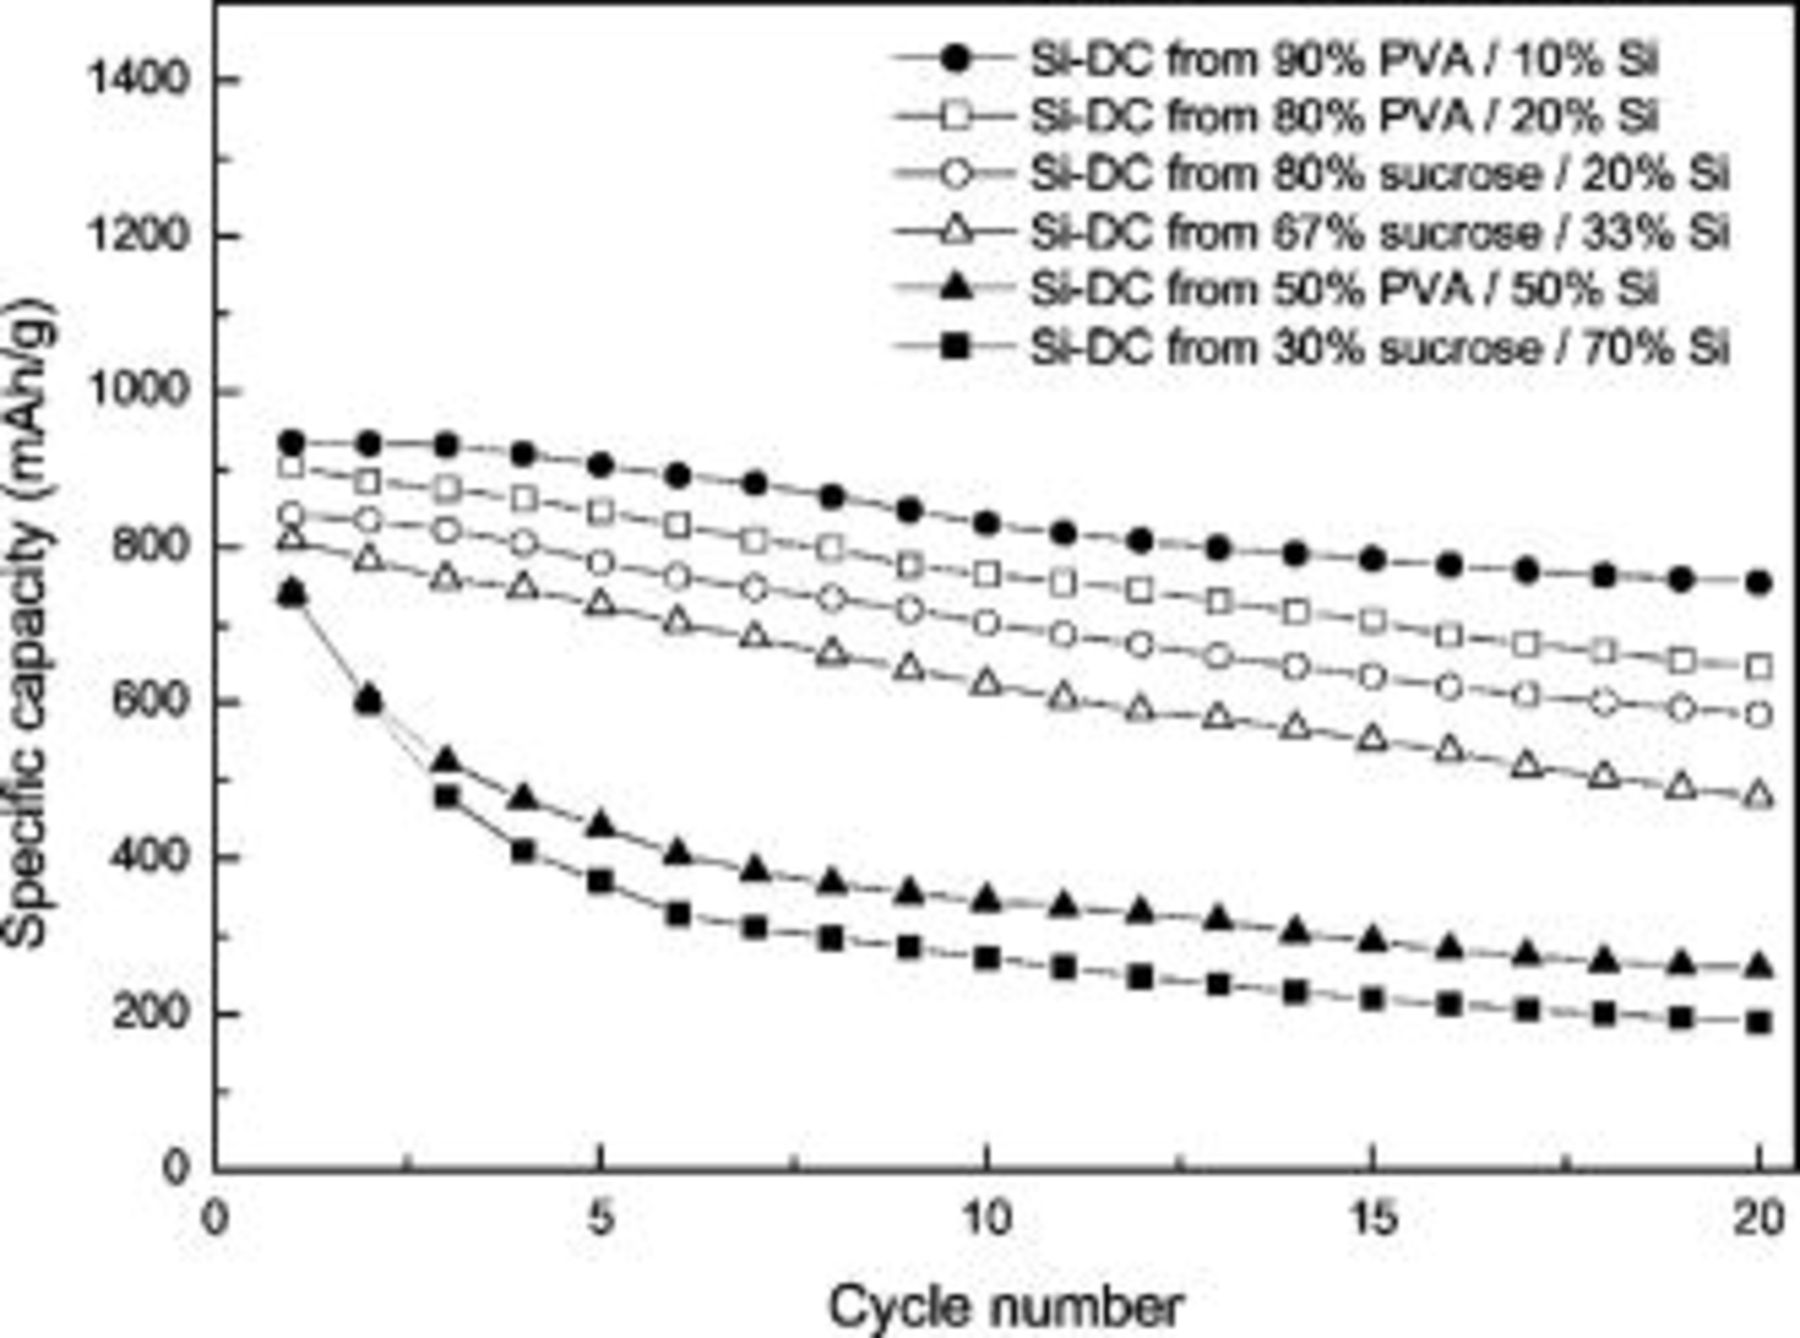
Figure 8. Cycle life behavior of Si–DC nanocomposites. Current density  .
.
Conclusions
Si–DC nanocomposites have been synthesized by mechanical milling of Si–sucrose and Si–PVA followed by pyrolysis under argon flow. The Si–DC nanocomposite from  shows a high reversible capacity of
  within 20 cycles and a high initial coulombic efficiency of 80.3%. The carbon content and starting polymer used significantly affect the capacity and cycling behavior of Si–DC nanocomposite electrodes. The exact disordered carbon content in the as-prepared Si–DC nanocomposites was determined by TGA for the first time. TGA, XRD, Raman, and CV results demonstrated that the carbon distribution on the Si particles in Si–DC nanocomposite using PVA as the carbon source is more uniform than that using sucrose as the carbon source under the same preparation conditions. Carbon analysis using TGA appears to be a good way to investigate carbon-containing composites. We believe that this approach to analysis warrants significant further work.
Acknowledgments
The authors would like to thank Dr. K. Konstantinov for his help with the SEM measurements. Financial support from the Australian Research Council is gratefully acknowledged.
The University of Wollongong assisted in meeting the publication costs of this article.