Abstract
Plasma etching of nanoporous materials (NPMs) is a complicated phenomenon and depends upon the NPMs parameters, such as the overall porosity, the pore size and structure, and the concentration of organic groups on the surface of the film and inside its pores. Polymerization during fluorocarbon plasma exposure is ubiquitous and suppresses the net etching rate. The model developed here accounts for the polymerization that occurs. In this study, a new plasma etching model is developed that applies in the high-polymerization-rate regime. This new model includes pore structure factors (pore shape and size) as well as mass and volume effects in the form of the film's overall porosity. According to the model, at low porosities the etching rate varies directly with the total porosity. However, as the porosity of the film increases, surface effects become important and the etching rate is affected by both total porosity and pore geometry. Finally, we correlate the corrected etching rate, including the porosity and the average pore size effect, with the etching of solid  over a wide range of bias voltage. In the fluorocarbon suppression regime, the corrected etching rate expression agrees with the experimental results and collapses all etch rate data onto a single curve. © 2005 The Electrochemical Society. All rights reserved.
Export citation and abstract BibTeX RIS
Nanoporous materials (NPMs) are one of the promising dielectric candidates for future integrated circuits due to their low dielectric constant.1
2 Plasma etching of NPMs with fluorocarbon gases has been studied3
4
5
6
7
8
9
10
11 because of the high selectivity of fluorocarbon plasmas for etching  relative to Si.
Oehrlein et al.3
4 reported that the Si etch rate is suppressed by a polymer layer that deposits during reactive ion etching with fluorocarbon gases. They found that the polymerization rate is strongly affected by the concentration of neutral radicals and is more efficient due to low ion energy bombardment in low-density, capacitively coupled, radio frequency (rf) discharge plasma etching. Standaert et al.5 observed relatively thick fluorocarbon layers on the substrate surface during the steady-state etching of silicon and claimed that the silicon etch rate is controlled by a neutral flux through the fluorocarbon layer. Oehrlein et al.6 and Rueger et al.7 also reported that the plasma etching rate of solid  is primarily determined by fluorocarbon deposition and that there is a thin fluorocarbon film on the solid
  surface during steady-state etching in the fluorocarbon suppression regime. Thus, a thin, steady-state, fluorocarbon film plays an important role in determining the rate of etching and this deposited film suppresses the etch rate. These phenomena, for a reactive sputtering process, occur under conditions referred to as the fluorocarbon suppression regime. Standaert et al.5 have found that slight variations in the film thickness, on the order of 1 nm, can result in substantial changes in the etching rate of solid
The major role of the polymer layer that forms on the  film during plasma etching is to limit species diffusion through the layer and dissipate ion-bombardment energy,8 preventing material etching. The precursor for polymer growth is generally believed to be
  radicals. Booth et al.9 observed decreasing CF and
  densities on the surface at low bias power in a
  plasma, indicating polymerization of these species. However, they observed
  generation at high bias, which implies polymer decomposition.
Standaert et al.10 observed that the different chemical makeup of  -like dielectrics [fluorinated silica, SiOF, hydrogen silsesquioxane (HSQ), and methylsilsesquioxane (MSQ)] does not affect the etching in a less polymerizing environment. They suggested the etching process becomes increasingly dependent on neutral species from the gas phase as the fluorocarbon film thickness increases. They also observed the effect of impurities in the
  on the etching rate. The hydrogen and carbon components in HSQ and MSQ, respectively, limit the etch rate, while fluorine in fluorinated
  enhances the etching rate.
Standaert et al.11 reported on the etching behavior of xerogel films as a function of substrate porosity and the rate of polymerization of feed gases, 
 and
and  They used a porosity-corrected etching rate relation,
  where
where  is the etching rate normalized by porosity, π is porosity, and
  is the etch rate of dense
  This is basically a density effect that corrects for the fact that less material per unit thickness needs to be removed as the porosity is increased. Using this relation,
  they obtained a good match between the etch rate of a 30% porous xerogel film and that of dense
  in a
in a  plasma. However, they found a more pronounced suppression of the etch rate by fluorocarbon films for higher porosity xerogel films. Standaert et al.11 suggested that a larger pore size and a higher porosity may allow for more fluorocarbon accumulation at the surface for selective etch conditions, such as with
  As shown in Fig. 1
11 the etch rate, corrected for the porosity (the volume effect), shows a limitation at higher porosities and at those higher porosities, the density effect correction alone does not collapse the etch rates to a single curve.
As shown in Fig. 1
11 the etch rate, corrected for the porosity (the volume effect), shows a limitation at higher porosities and at those higher porosities, the density effect correction alone does not collapse the etch rates to a single curve.
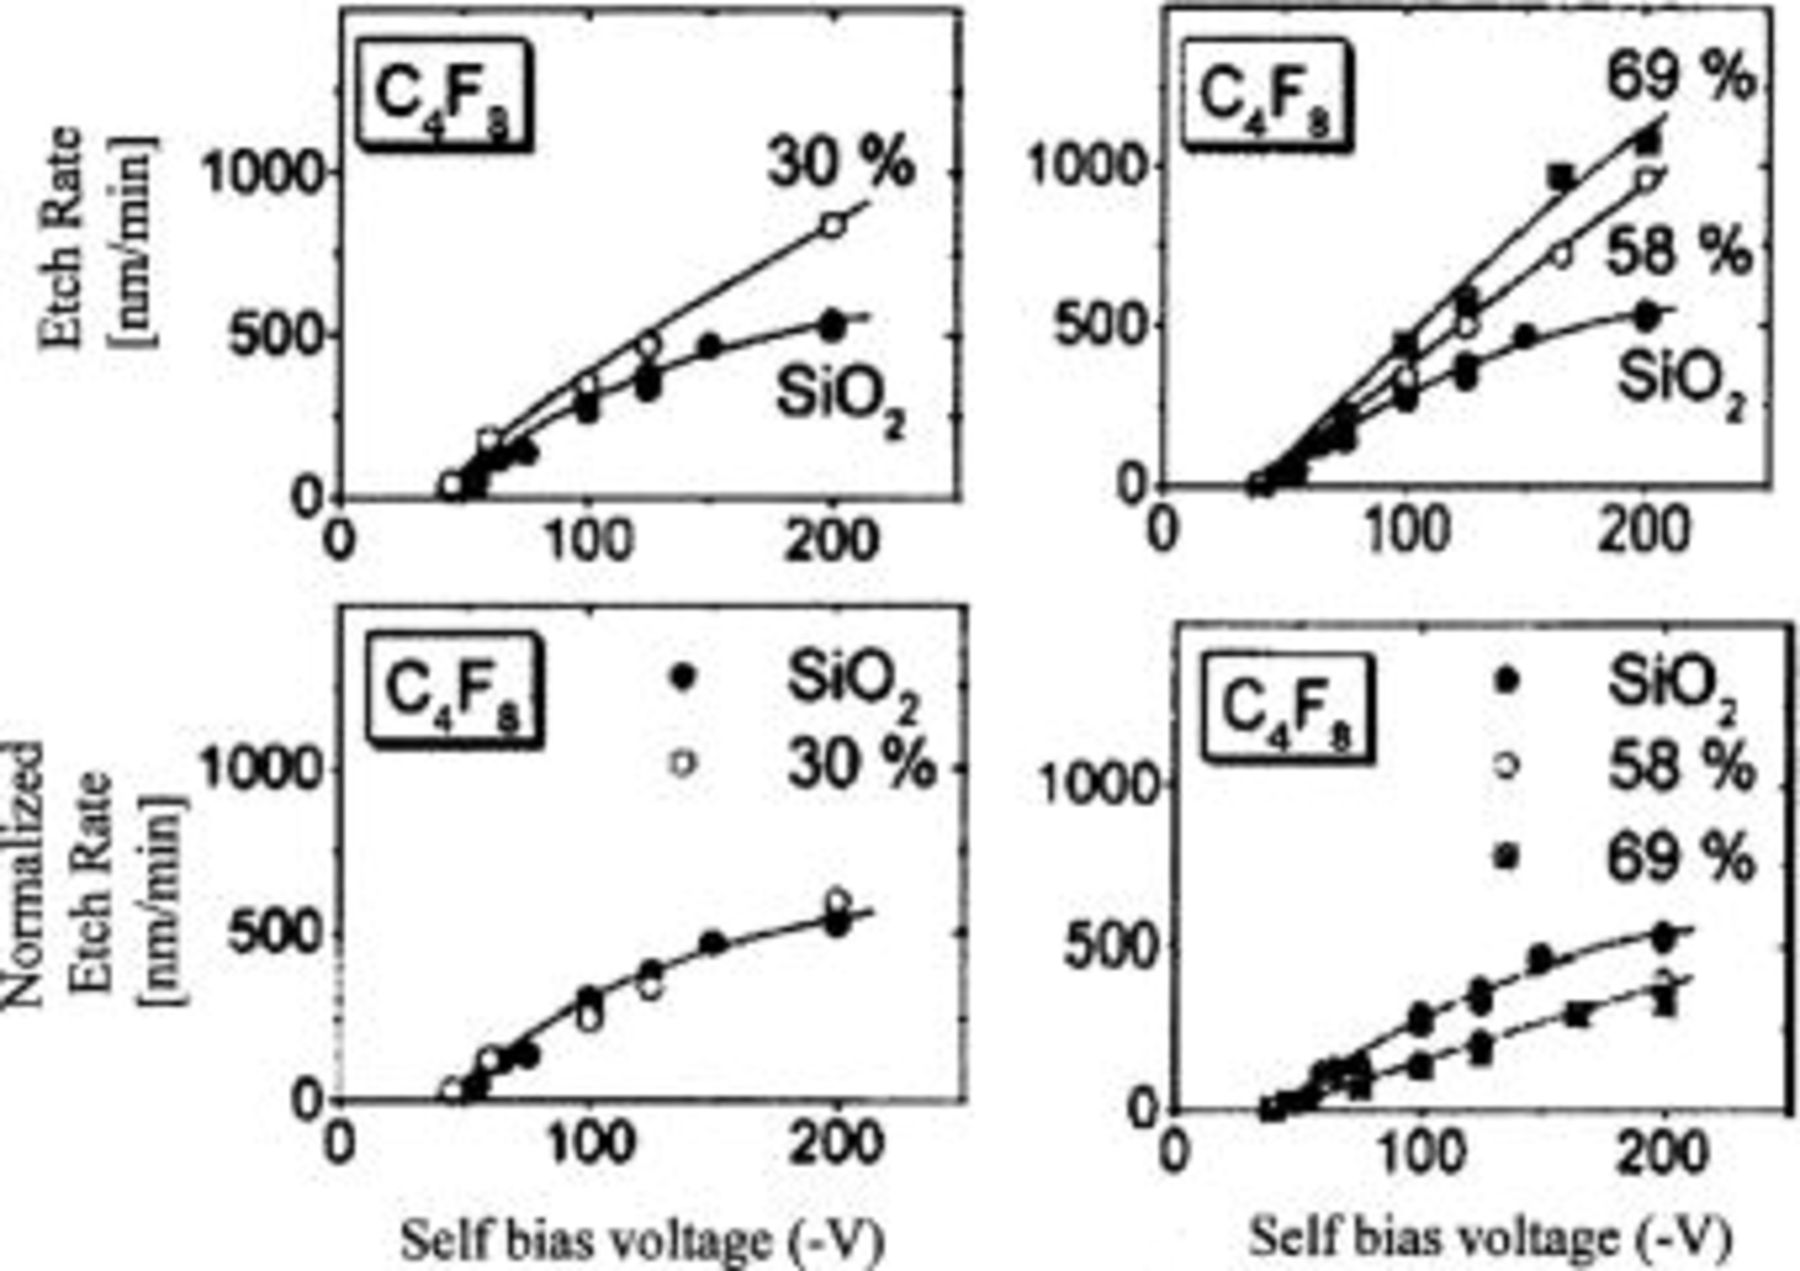
Figure 1. Observed etch rate and normalized etch rate by porosity at the various porosities and bias voltages.11
We have developed a new etching rate relationship based on observations in Standaert et al.11 We include information on the surface topography based on our previous work12 and the pore size as a function of xerogel film porosity. In this paper we derive and discuss the etching rate relation based on the film porosity (the volume/density effect) as well as on the film surface geometry (the suppressing reaction area), the latter effect depending on the average pore size of the film.
Model Development
According to Gregg,13 xerogels, among other active solids, often have a structure based on the packing of spheroidal particles, and it is possible to study their structure through an examination of the adsorption isotherm. This isotherm approach has received some attention, particularly in view of the relatively simple geometry used. The adsorption-desorption isotherms usually show a hysteresis in xerogel materials, which means that for the same value of relative pressure,  one has two corresponding values of pore radii.
McBain et al.14 provide a possible explanation for hysteresis based on an "ink bottle" hypothesis which ascribes a narrow neck and a wide body to the pores. Along the adsorption branch, condensation in the pore body first occurs when the pressure reaches the value  where γ and
  are the surface tension and corresponding pore radius, respectively. When the desorption branch is traversed, evaporation cannot occur at pressure
  because the neck of the pore is blocked by the meniscus which can evaporate only when the pressure has fallen to
  the whole pore then empties immediately. As a result, the adsorption isotherm provides information about the body of the pore (i.e.,
  while the desorption isotherm gives the neck radius (i.e.,
  .
.
We have shown12 that the pore structure of a xerogel system can be represented as cylindrical at low porosities and bottlenecked or tubular, having different radii for the pore neck and pore body at higher porosities. Polymerization always happens during fluorocarbon plasma etching, as mentioned in the previous section, and if both the solid and porous substrates are exposed to the same fluorocarbon plasma conditions, polymerization may occur as depicted in Fig. 2a and b where a conformal polymer layer coating the accessible surface is shown.
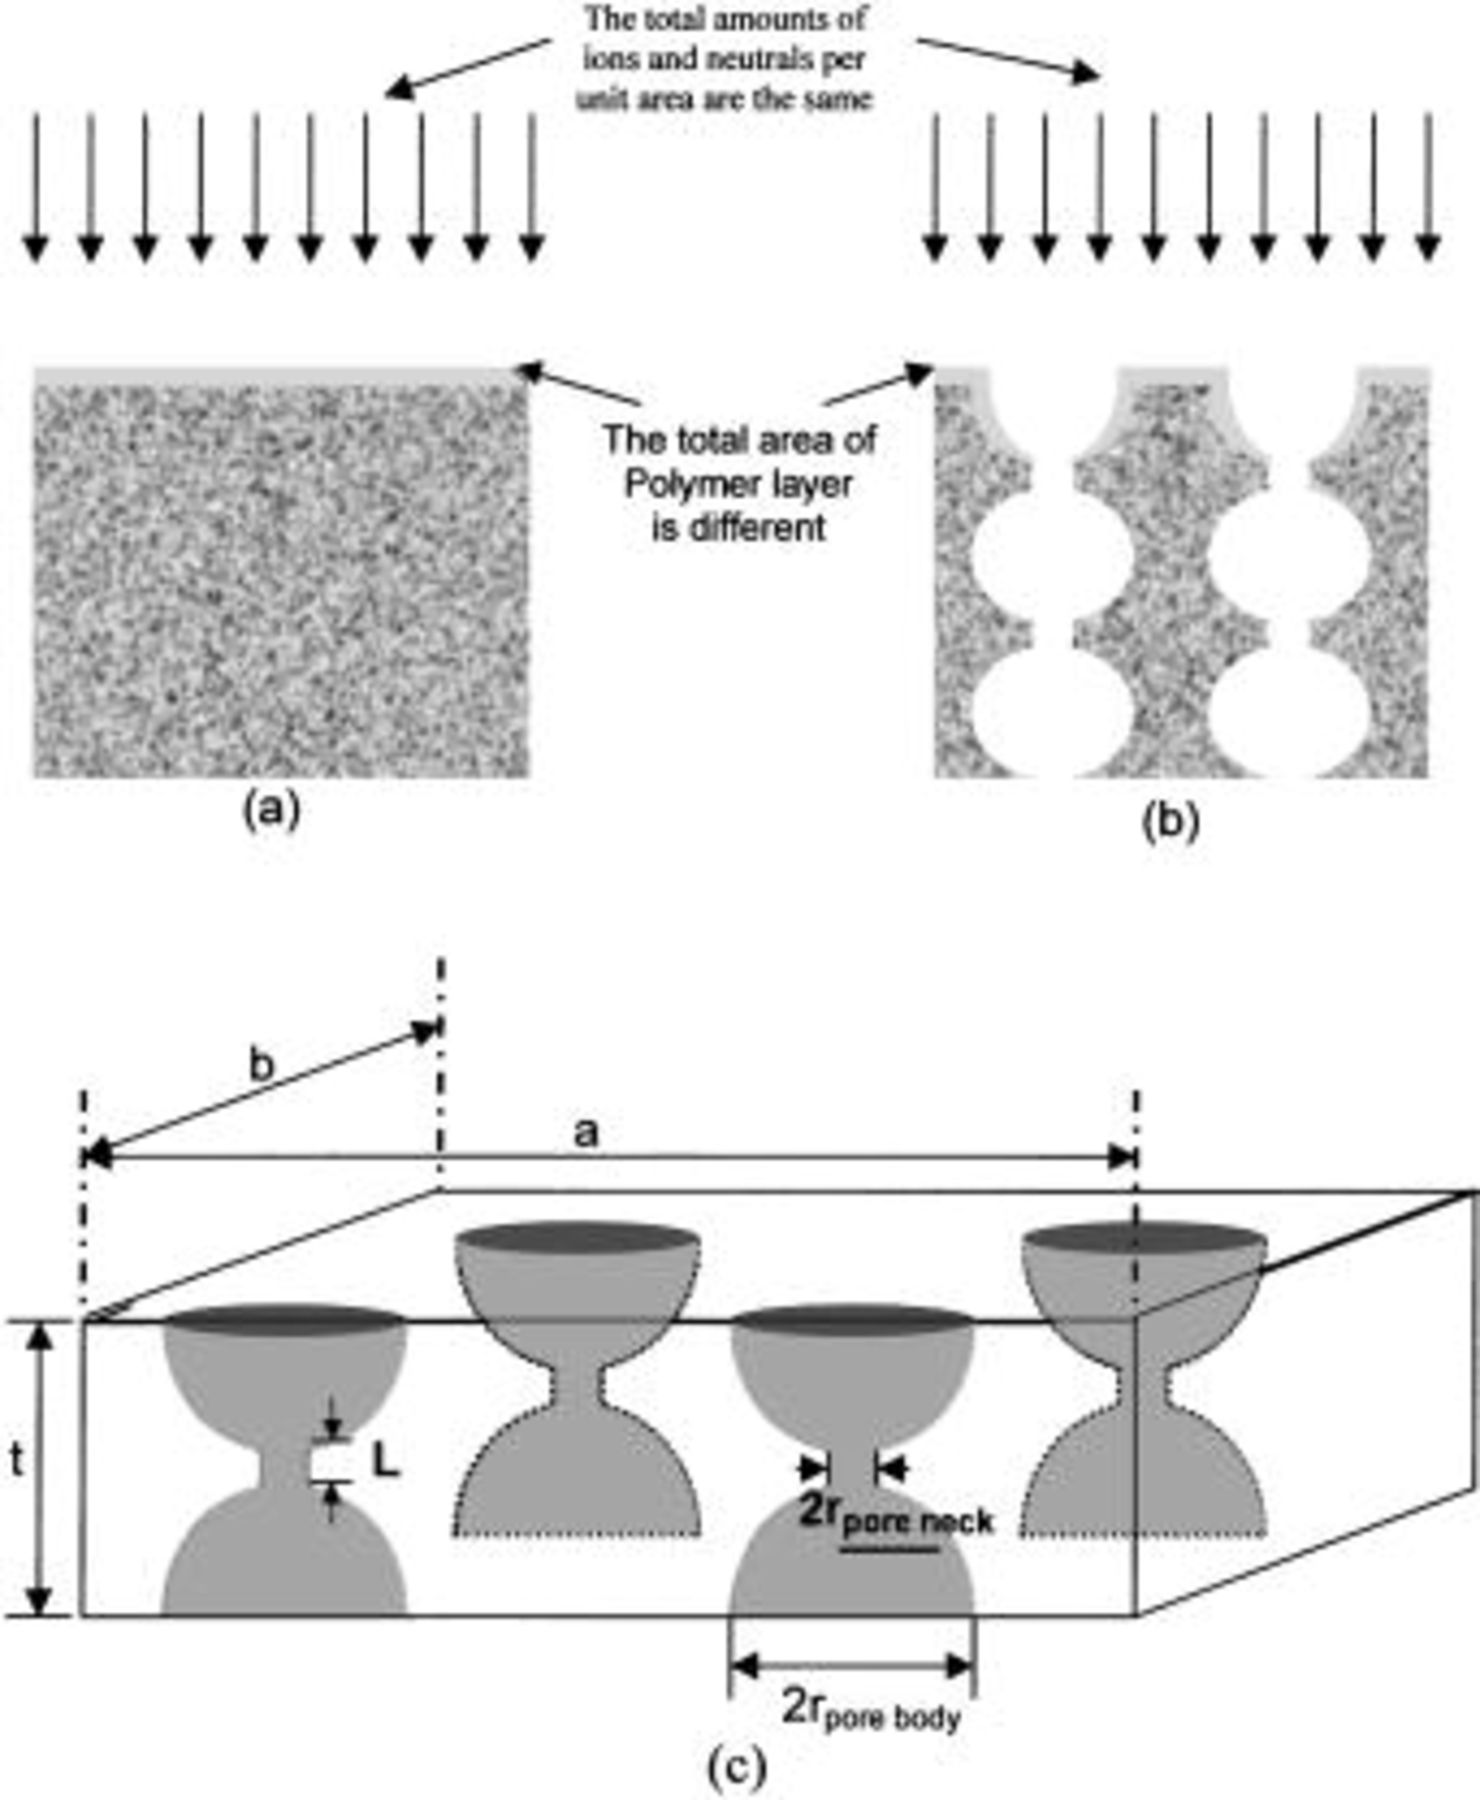
Figure 2. Schematic pictures of (a) polymer deposition on solid  (b) polymer deposition on porous
  and (c) the three-dimensional structure of nanoporous silica.
In a porous material such as a xerogel the etch rate depends upon two factors:  the surface area available for the etching reactant to adsorb and
  the amount of material that must be removed by the etching reaction itself. Because the deposited polymer layer acts as a protective barrier during plasma etching, our primary assumption is that the etch rate decreases as the area covered by the deposited polymer layer increases. The degree of inhibition of the etch rate is proportional to the available surface area. This area is larger for porous materials than for dense ones, and we include this idea in the model to quantify the effect of polymerization.
There are two main reactions that occur during the fluorocarbon etching of silica. The first reaction is the etching of substrate caused by highly energized ions. The second reaction is polymer deposition assisted by either low-energy ions or by neutrals, like CF or  Now if we consider two model materials (solid and porous
  as depicted in Fig. 2a and b, the amount of ions/neutrals striking the surface per unit of available area is the same. However, the number of available sites to form a polymer layer is different in the two systems. The number of sites is larger in the porous material than in the solid substrate, because the porous silica has larger accessible surface area than that of solid silica. Thus, the etching rate of porous material is enhanced compared to solid material by increased porosity, because less mass is removed per unit depth. However, the etch rate is inhibited by an increase in area available for polymer deposition because the polymer layer protects the material underneath it from being removed. The etching yield per impinging ion may depend on the angle between the surface and the impinging ions, but the angle dependency of the etch rate is not included at present in the model. Work on the kinetics of polymerization and the morphological effect of energetic ions impinging on the surface is currently under investigation.
We propose a unit cell model representing the film's pore structure including a top porous layer that consists of a pore neck and a pore body, a pore body that is spherical in shape, and a pore neck that is cylindrical in shape with a length,  The three-dimensional unit cell structure is shown in Fig. 2c
  is the thickness of the top porous layer,
  the width of system, and
  the depth of system). The porosity of the porous silica is the ratio of the open volume (pore volume) to the total volume,
  and is given in Eq. 1 The volume of the pore neck is its length,
  times the pore's cross-sectional area
  Thus
Thus

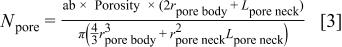
where  is the total number of pores in the unit cell.
For the porous silica, a unidirectional plasma sees the top surface,  minus the open area of the body pores,
  plus the surface area of the pore body,
  minus the area of the necks of the pores,
  This is the surface available for the deposition of the polymer. Consequently one obtains

The total number of pores,  in the unit cell is obtained from Eq. 1
Substituting Eq. 3 into Eq. 2 with the assumption of  one can get the ratio of the effective surface area of the porous material to that of the solid material as given in Eq. 4

The aspect ratio assumption used for the pore neck requires experimental justification. We do this by noting that it represents the final results with a correlation coefficient,  which is very good and is based on the fact that these films are built from spherical particles that partially fuse together leaving behind the bottleneck pores. Depending upon the degree of fusion, we end up with different aspect ratio pore necks.
According to Eq. 4, the effective top surface area of the porous material during plasma etching is a function of the pore size and shape  and
and  as well as the overall porosity. If a polymer layer covers the entire available surface area, which is reasonable in a high polymer deposition environment, and the polymer layer suppresses the plasma etching rate, a new dimensionless parameter, termed the "areal correction factor," is defined as follows

Clearly, the areal correction factor is the ratio of the available surface area of porous material to that of solid material.
To obtain the corrected etch rate  with respect to the observed etch rate
  one must include both the areal correction factor, Eq. 5, and the volume/density correction factor

Therefore, the "total correction factor" is given by

In discussing the results of our model we compare model predictions with experimental data11 and use the correlations between pore sizes and porosities that we obtained in that work,12 as given by Eq. 8 and 9.
Results and Discussion
We use the pore structure information12 obtained by ellipsometric porosimetry15 16 on our xerogel system to evaluate the correction factor. From previous work,12 the average sizes of the pore body and pore neck as a function of porosity are


Note that at 70% porosity the pore body has a radius of about 7.6 nm and the neck about 5.3 nm. However at 30% porosity the radius of both is about 1.6 nm, and the areal correction factor is not important. This is consistent with the etching data shown in Fig. 1.
To plot the areal correction factor and total (volume and areal) correction factor as a function of porosity, Eq. 8 and 9 were inserted into Eq. 5 and Eq. 7 to give


The areal correction factor and total correction factor as a function of porosity are shown in Fig. 3. The areal correction factor increases in importance at high porosities. (Note: the areal correction factor should be always be greater than 1, but Fig. 3 shows a range where it is less than 1). This is due to errors in the regression of the ellispometry data to arrive at Eq. 8 and 9. For example, a correction factor for 30% porosity is 1.03; however, those for 58% and 69% are 1.56 and 1.85, respectively. That may explain why the corrected etch rate equation using just the porosity (volume correction),  applies only at low porosities. Although the areal correction factor shows significant effects at high porosities, the total correction factor decreases as the porosity increases. This reflects the fact that eventually, the decrease in density (increase in porosity) overwhelms the surface area increase, but it does not necessarily mean than we can neglect the surface topography effect on the etching rate. In summary, when the porosity is
  the pore size effect is not prominent, but when the porosities are higher than 50%, the pore size substantially affects the plasma etching rate.
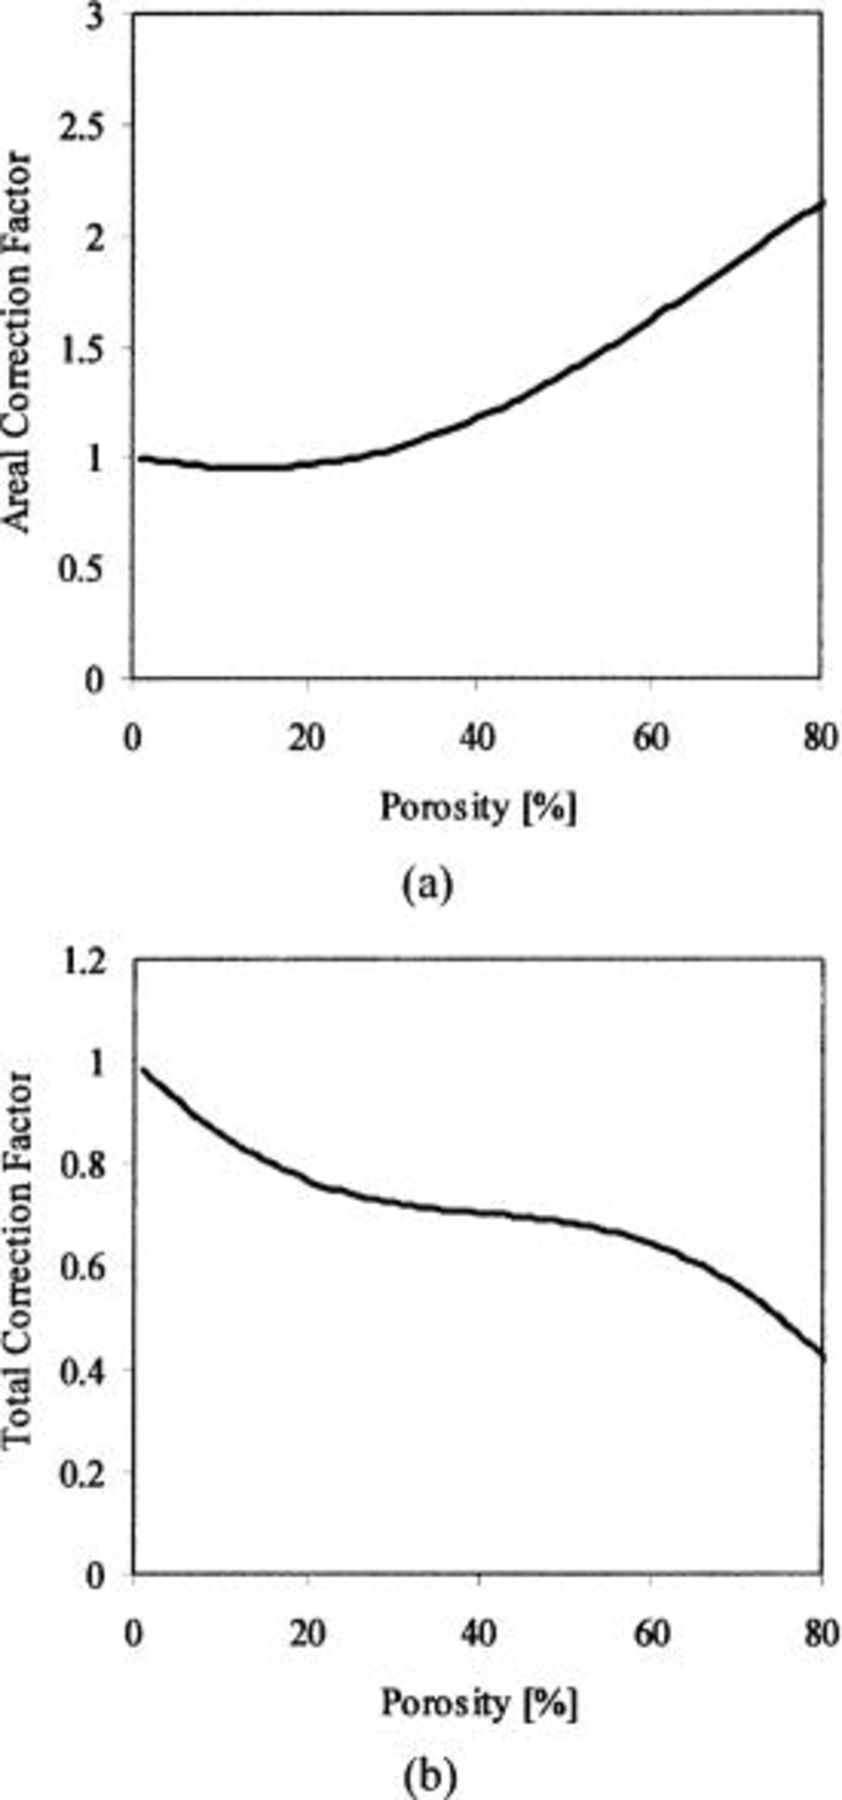
Figure 3. Correction factors as a function of porosity: (a) areal correction factor vs. porosity and (b) total correction factor vs. porosity.
By combining Eq. 8 and 9 with Eq. 6 to get a new corrected plasma etching rate of xerogel system as a function of porosity, one obtains

Figure 4 shows the new corrected etch rate, for various porosities, as a function of bias voltage. The data essentially collapse onto a single curve, and the correlation provides good agreement throughout the entire range of porosity up to a bias voltage of 200 V (in absolute value). The corrected etch rate at 200 V (in absolute value) of the bias voltage shows the limitation of the model. In the high-bias-voltage region, the polymer layer likely does not cover all of the surface due to sputtering from the higher energy ions. This effect is evident by the scatter of the experimental data at 200 V (in absolute value). However, sputtering is not the primary etching mechanism at lower bias voltages. In the future, we will incorporate the degree of polymerization into our plasma etching model to account for a low-polymerization environment or the sputtering regime.
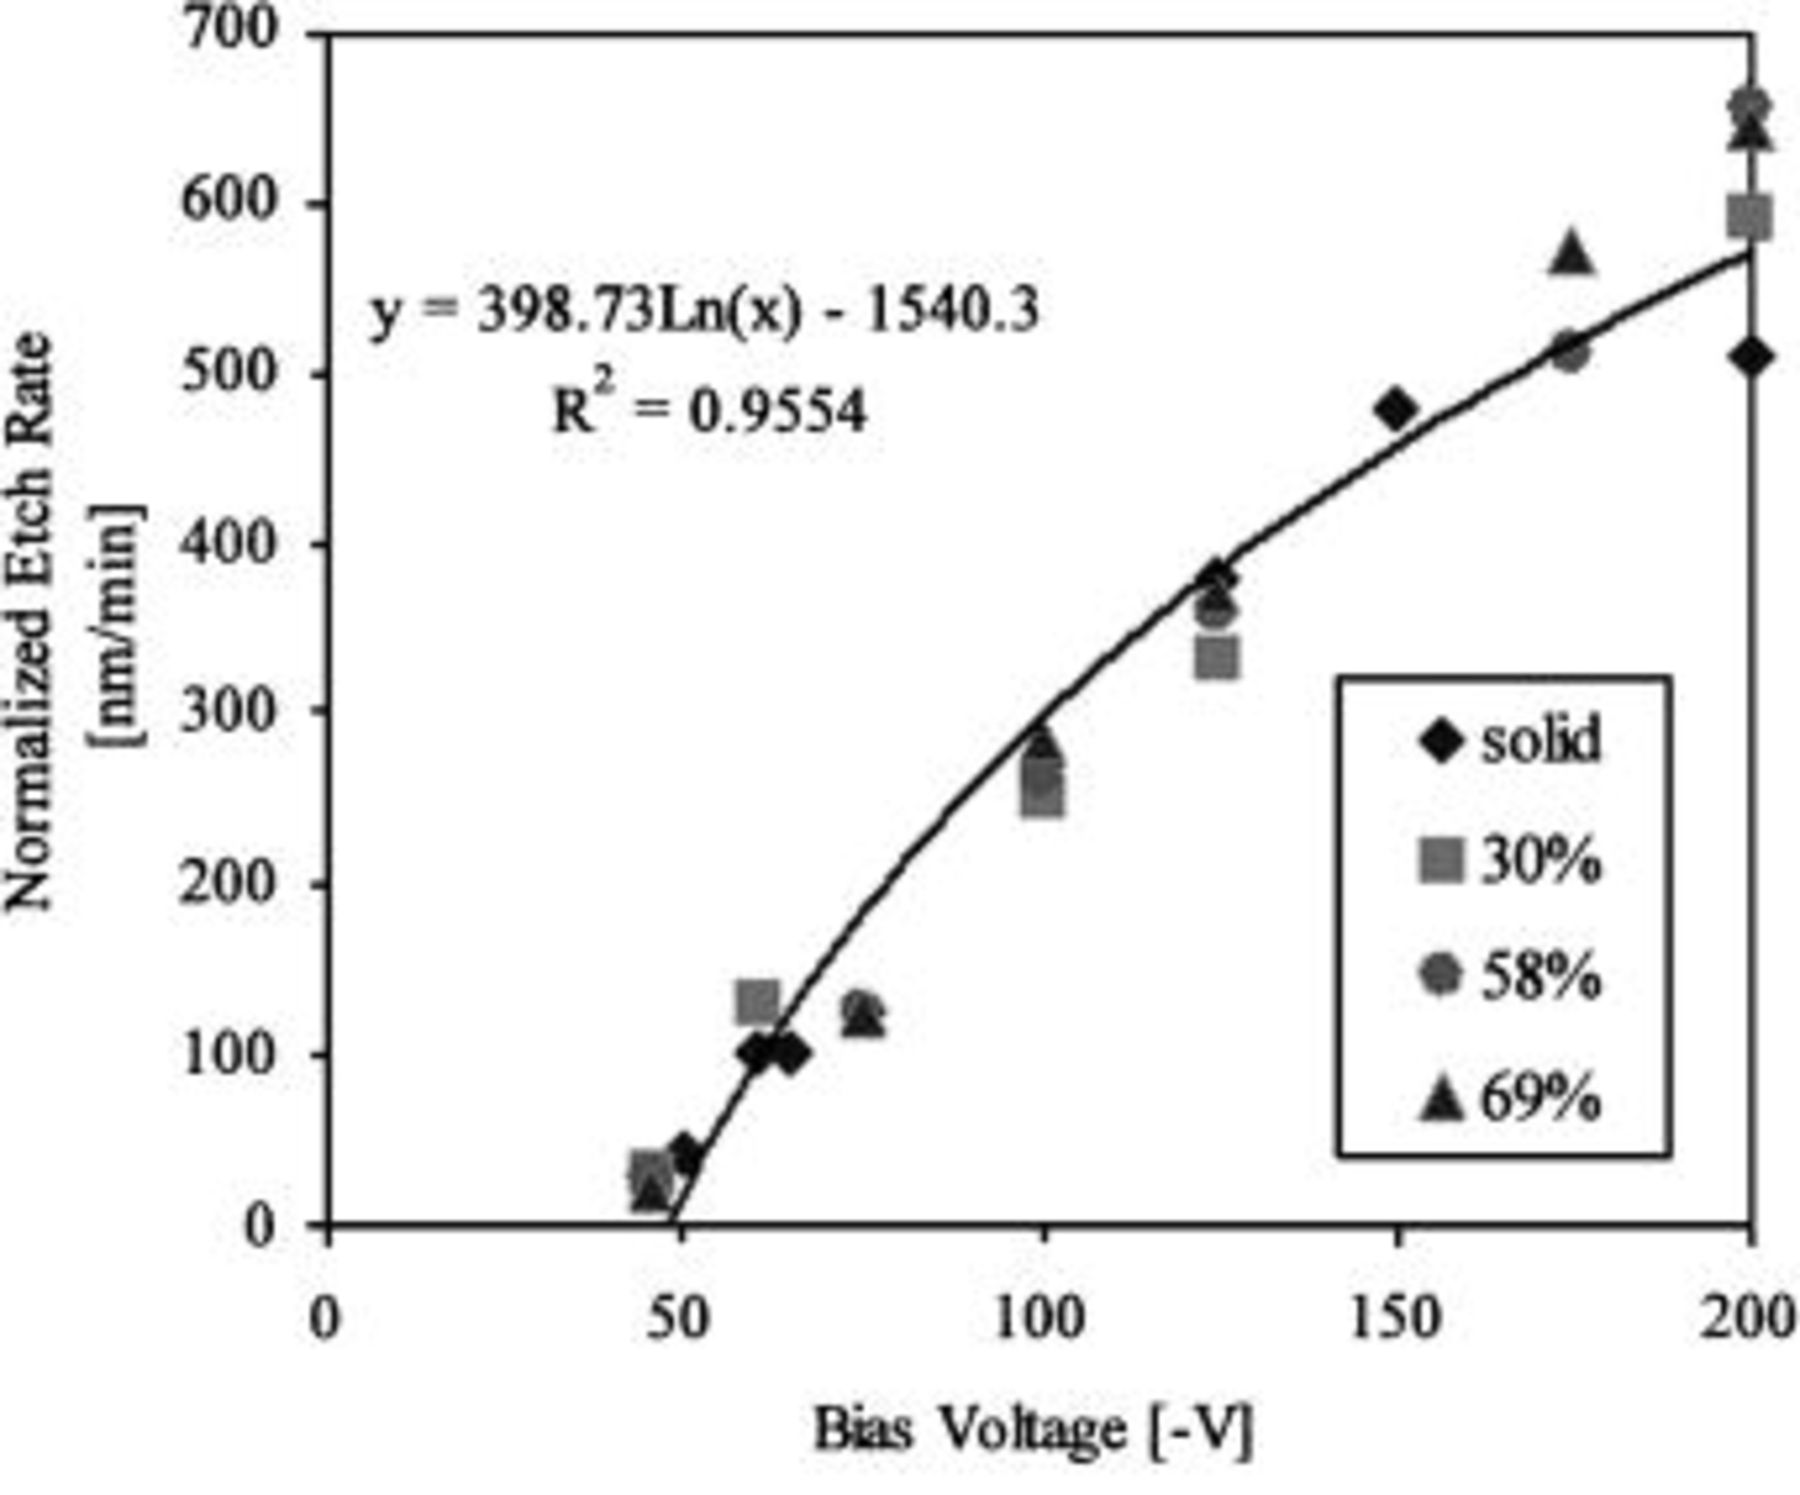
Figure 4. The corrected etch rate (including pore size, shape, and polymer) vs. bias voltage with various porosities for the case of  plasma, the experimental data from Ref. 11.
Conclusions
To explain the difference in etching rate behavior as a function of the film porosity during fluorocarbon-based plasma etching (in the suppression regime by a deposited polymer layer), we introduced a new parameter, the areal correction factor. It includes pore structure effects, which correspond to the deposited polymer layer per unit area. We found that the areal correction factor is inversely proportional to the plasma etching rate. At low porosities, the areal correction factor is around 1, which means that the etching rate mainly depends on the substrate total porosity. However, the areal correction factor at high porosities is substantially different from unity, which means that the etching rate is a function of the surface geometry induced by the pore structure as well as the overall porosity. The new etching rate relationship based on the surface geometry of xerogel films predicts the etch rate well when compared to that of solid  in the fluorocarbon polymer suppression regime. In the future, we will work on the sputtering regime based on the surface geometry of the porous substrate in plasma etching.
Acknowledgment
This work was supported in part by the Semiconductor Research Corporation under task 995.015.
W. N. Gill assisted in meeting the publication costs of this article.