
Abstract
A room-temperature ionic liquid (RTIL) solvent, N-methyl, N-alkyl pyrrolidinium bis(trifluoromethanesulfonyl)amide  has been investigated for use in a lithium metal battery. An average cycling efficiency of >99% is achieved at
 on platinum. At deposition rates up to
  optical micrographs indicate that the deposit is uniform and nondendritic. Above
  the deposit becomes dendritic and efficiency decays. High cycling efficiency
  can also be obtained on copper, but at relatively low current density
  The deposition/cycling history also influences the cycling behavior of the deposit. © 2004 The Electrochemical Society. All rights reserved.
Export citation and abstract BibTeX RIS
In lithium battery technology the lithium metal electrode is of particular interest because it offers the highest possible specific energy. In this respect, therefore, a lithium metal battery would be the ultimate electrochemical energy storage device. For this to be achieved, however, the repetitive deposition and stripping of lithium ("cycling") must be close to fully reversible. At present, cycling lithium invariably results in a dendritic morphology, which presents safety hazards and results in a drastically shortened cycle life.1 The dendritic deposits have the potential to grow through the cell and contact the positive electrode creating a short circuit which will cause significant local heating, often leading to fire and explosion. In addition, the dendritic deposits have a tendency to become disconnected from the bulk electrode, effectively becoming isolated within the electrolyte, thus reducing accessible electrode capacity with cycling.
Extensive research has been undertaken to solve the problems associated with cycling lithium metal. The majority of research has been geared toward dendrite suppression and hence improved battery cycle life and safety. Broadly, the approaches investigated include the use of more inert solvent systems and salts, increasing stack pressure on the electrode, the addition to the electrolyte of compounds which improve plating morphology, and the use of polymer electrolytes.2 Recent literature has concentrated mostly on the use of polymer electrolytes3 4 5 6 7 8 and/or additives.6 8 9 10 11 12 13 14 15
Another possible approach, which may allow the lithium metal electrode to be used, is the application of room-temperature ionic liquids (RTILs) as the electrolyte solvent. RTILs are organic ionic salts that are liquid over a wide temperature range, typically from below room temperature to above 200°C. RTILs possess important attributes that make them attractive for use as solvents in electrochemical applications.16 These include a wide electrochemical window, high conductivity, high thermal stability, low safety hazards (nonflammable, nonvolatile), and low toxicity. A recent review by Webber et al.17 details the advantages of RTIL electrolytes. The review summarizes recent advances and highlights the growing interest in these materials. RTILs are seen as a means to improve the safe performance of lithium based cells, particularly large-scale batteries, because of their nonvolatile properties. A recent study by Hammami et al.18 that reports the possible production of toxic fluoro-organic compounds resulting from thermal runaway of commercial Li-ion cells serves to highlight the need for safer electrolytes. With respect to the lithium electrode, RTILs present a fundamental difference to conventional solvents (i.e., aprotic organic liquids and polymers) in that the solvent and electrolyte are one and the same. We postulate that this could produce a simpler, more uniform solid electrolyte interphase (SEI), which, in turn, could lead to improved cycling behavior. The design flexibility of RTILs (i.e., through the combination of different anions and cations) provides the potential to exert a significant amount of control over the composition of the SEI.
Recent work has described the preparation and properties of the pyrrolidinium  family of RTILs.16
19
20
21
22
23
24
25 The bis(trifluoromethanesulfonyl)amide
family of RTILs.16
19
20
21
22
23
24
25 The bis(trifluoromethanesulfonyl)amide  salts of this cation show particularly high stability at negative potentials,24 including stability against lithium metal.26
27 The
salts of this cation show particularly high stability at negative potentials,24 including stability against lithium metal.26
27 The  and
and  RTILs are pale yellow, viscous liquids at room temperature, with a density of ∼1.4 g cm−3.25 The
  anion is an exceedingly weak base as a result of significant delocalization of charge throughout the molecule. This feature is thought to contribute to its stability vs. oxidation. The delocalized charge, producing weaker ion-ion interactions, coupled with the flexibility of the molecule tend to produce some of lowest known viscosities among existing ionic liquids. Table I presents conductivity data for the electrolytes used in this study. The addition of a lithium salt to the neat RTIL results in reduced conductivity due to increased ion interactions. This paper describes a study of the cycling properties and surface morphology of Li in these RTILs.
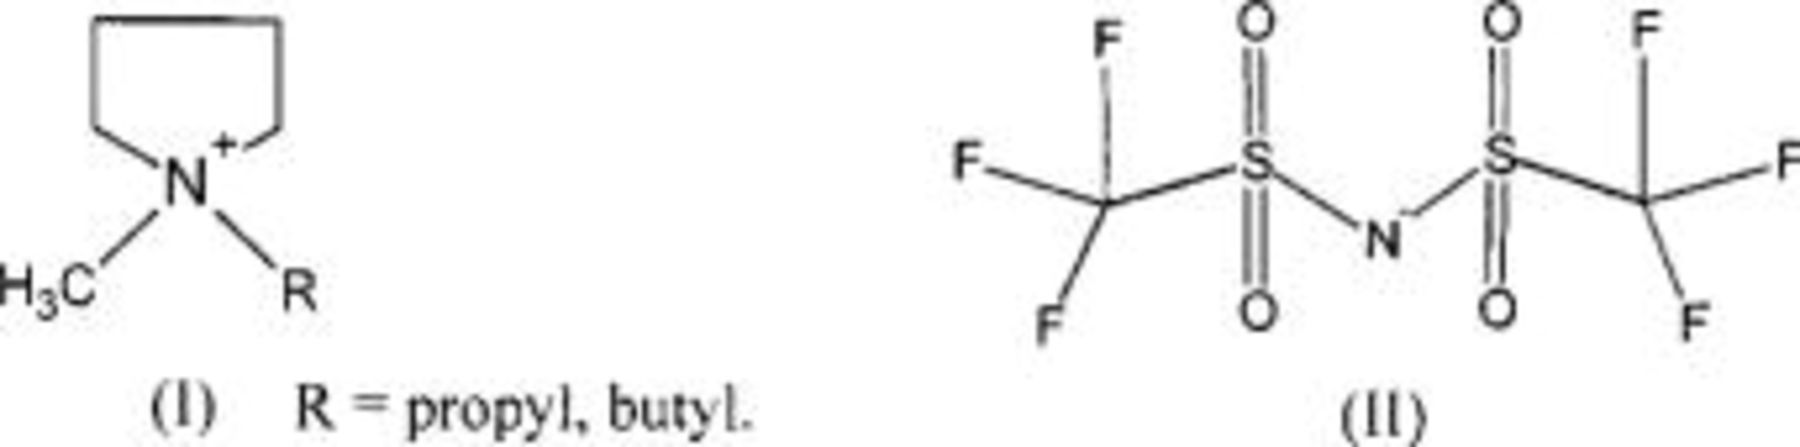
Table I.
Conductivity data (mS cm−1) for neat and 0.5 mol/kg  electrolytes at 25 and 50°C. electrolytes at 25 and 50°C. | ||||
|---|---|---|---|---|
| Temp (°C) | Neat  | 0.5 mol/kg
 | Neat  | 0.5 mol/kg
 |
| 25 | 3.6 | 1.2 | 2.6 | 1.0 |
| 50 | 8.1 | 3.5 | 6.2 | 3.0 |
Experimental
Lithium foil (Aldrich 99.9%), 180 μm thick, was prepared by washing in hexane (stored over 4A molecular sieves) prior to brushing and washing again.  (donated by 3M Company) was dried under dynamic vacuum at 90°C for 48 h. The
  and
and  RTILs were prepared as described by MacFarlane et al.25 The products were dried under dynamic vacuum at 90°C for 24 h and then treated with a stream of dry argon for 12 h. Electrolytes were prepared by dissolving
  directly into the ionic liquids. The optical cells were constructed with
  electrolytes. We are yet to ascertain a clear advantage of one ionic liquid cation over the other (i.e.,
  vs.
vs.  . The properties of the two are similar;
  is slightly more fluid and more conductive. The conductivity of the liquids was determined by ac impedance using a custom-built platinum dip-cell. The cell constant was determined from a 0.01 M KCl solution at 25°C.
X-ray photoelectron spectroscopy (XPS) was performed on lithium and lithium-deposited copper electrodes removed from cycled  cells. The spectra were acquired on a Kratos Axis ultra imaging XPS spectrometer. An aluminum monochromated X-ray source operating at 10 mA and 15 kV (150 W) was focused on the sample surface. The hybrid analysis mode was used which provided a sampling area of
  μm. Survey spectra were acquired at 160 eV pass energy and region spectra were acquired at 20 eV pass energy. The instrument vacuum was maintained at
  Torr. Etching experiments were performed on the sample surface using an argon ion beam gun operating at 15 mA and 5 kV, resulting in an estimated etching rate of ∼1 Å s−1. Instrument operation and peak fitting were performed using the XPS Axis ultra software. A 70:30 Gaussian:Lorentzian algorithm was used to fit the peaks to obtain quantitative results. The fit produced an estimated ±10% error in the atomic concentration determined for each peak.
The platinum electrode (polished, 0.05 μm  surface area was determined by applying the Randles-Sevcik equation (Eq. 1) to the peak currents determined for a 5 mM ferrocene/0.1 M tetrabutylammonium hexafluorophosphate/acetonitrile solution
  cm2 s−1) at scanning rates of 50, 100, and 200 mV s−1

where  is the peak voltammetric current (A), n is the number of electrons per reacting molecule, A is the electrode area (cm2), D is the apparent diffusion coefficient (cm2 s−1), C is the concentration (mol cm−3), and
  is the scan rate (V s−1).
A copper working electrode was prepared by press fitting a 1 mm diameter machined copper (OFHC, oxygen free high conductivity) rod into a polyethylene sleeve. The surface was polished (0.05 μm  and the surface area was determined using optical microscopy. In situ optical micrographs were obtained from optical cells, which were fabricated as described in a previous publication.28 The micrographs were acquired on a Nikon Epiphot microscope with a Sony Hyper HAD CCD-IRIS/RGB color video camera. A Maclab 200 potentiostat (Echem v1.3.2 and Chart v3.6.3 software) was used for the electrochemical measurements, all of which were performed in an argon glove box. In all cases either a platinum or copper working electrode (WE) was used with a lithium counter electrode (CE) and lithium quasi-reference electrode. The cycling efficiency measurements were performed as described in the literature.29
30 An excess of lithium was galvanostatically plated on the surface of the WE followed by galvanostatic cycling of a fraction of the original excess. The number of cycles required to consume the original excess (indicated by a sharp change in dissolution potential) was used to calculate the average cycling efficiency (ACE) of the electrolyte
and the surface area was determined using optical microscopy. In situ optical micrographs were obtained from optical cells, which were fabricated as described in a previous publication.28 The micrographs were acquired on a Nikon Epiphot microscope with a Sony Hyper HAD CCD-IRIS/RGB color video camera. A Maclab 200 potentiostat (Echem v1.3.2 and Chart v3.6.3 software) was used for the electrochemical measurements, all of which were performed in an argon glove box. In all cases either a platinum or copper working electrode (WE) was used with a lithium counter electrode (CE) and lithium quasi-reference electrode. The cycling efficiency measurements were performed as described in the literature.29
30 An excess of lithium was galvanostatically plated on the surface of the WE followed by galvanostatic cycling of a fraction of the original excess. The number of cycles required to consume the original excess (indicated by a sharp change in dissolution potential) was used to calculate the average cycling efficiency (ACE) of the electrolyte

where N is the number of cycles,  is the plated excess (1 C cm−2), and
  is the cycled fraction (0.25 C cm−2). All cycling efficiency values were determined at 50°C in ∼0.5 mL of electrolyte. Such experiments also serve to show the behavior of the ionic liquid in the practical situation of a cell designed to have a coulombic excess of Li in the anode as compared to the capacity of the cathode. Such designs are considered to be one way of making best practical use of the various features of the Li anode and the typical Li insertion cathodes; the additional mass of Li involved is a minor factor in the overall energy density of the cell. The Coulombic cyclic efficiency was calculated for pairs of cycles by comparing the charge required to reach a given voltage in cycle
  with that in cycle N.
Results and Discussion
An initial understanding of the behavior of a lithium electrode in the RTIL is provided by the cyclic voltammogram (CV) in Fig. 1. Well-defined processes are apparent for both the deposition of lithium ions and the dissolution of lithium metal. As indicated in Fig. 1, reduction currents for bulk reduction of the RTIL are still low at −800 mV (vs.  , which approximately defines the negative limit for the
  system. This limit is significantly lower than that for the related imidazolium
  salts and, in the present case, provides good resolution of the
  reduction process
  mV vs.
  . The mass-transport limit for this process is a diffusion limit, as there is almost no migration component to the
  current, due to the overwhelming concentration of solvent (RTIL) ions (ion fraction of
  is 0.1). The magnitude of
  is also approximately as predicted from the Randles-Sevcik equation (Eq. 2) from a
  diffusion coefficient of
  cm2 s−1 as obtained from pulsed field gradient spin echo (PFGSE)-NMR measurements.31 The stability of the RTIL to reduction leads to a relatively high reversibility of lithium deposition-dissolution on the first cycle (shown) of 83%. This improves with cycling and reaches 91% by the tenth cycle (not shown). The improvement is most likely due to the formation of an SEI. At the other end of the potential scale, Fig. 1 shows that the RTIL is stable to oxidation up to at least +4 V (vs.
  , sufficient to be compatible with most common lithium battery cathode materials. Therefore, an electrochemical window for this ionic liquid of greater than 5 V is accessible.
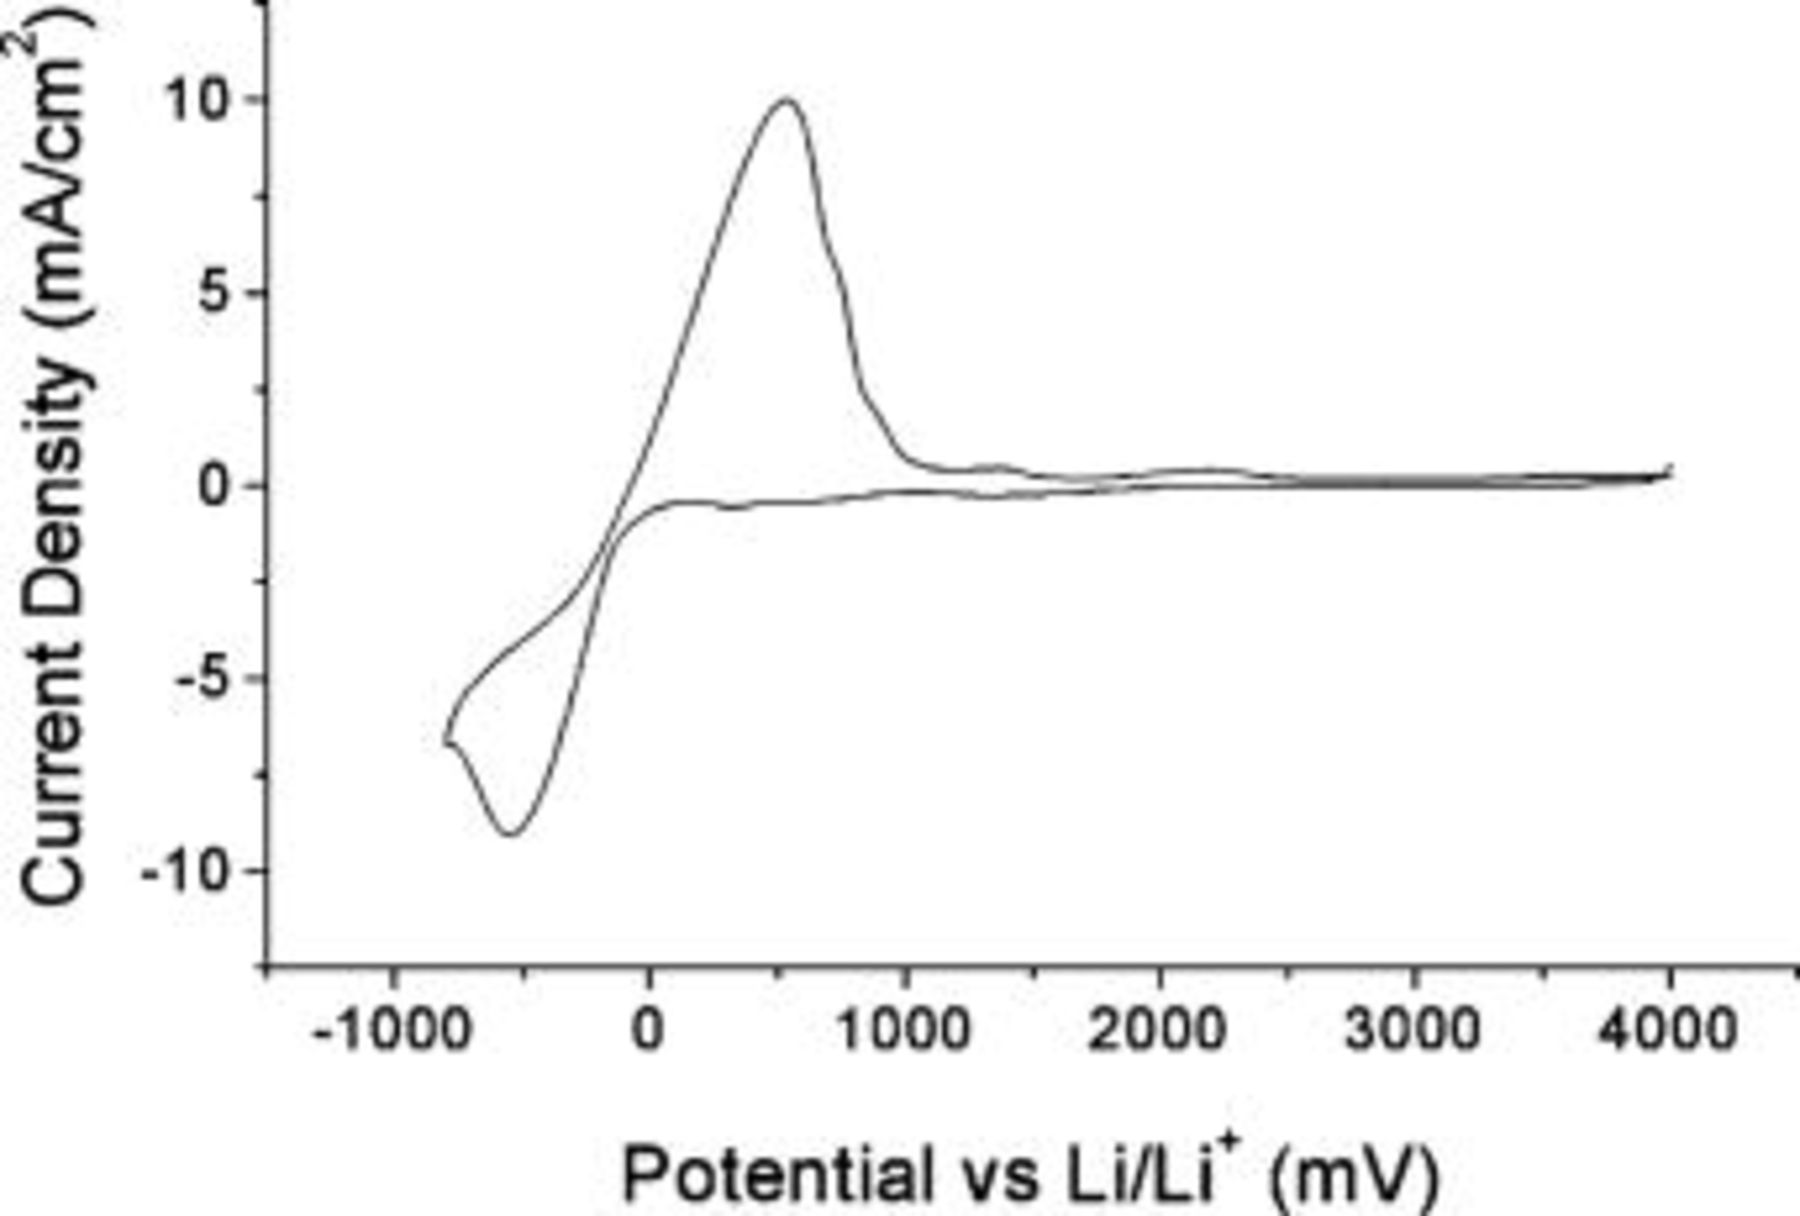
Figure 1. CV for 0.5 mol/kg  Platinum working electrode, Li counter electrode, Li quasi-reference electrode at 100 mV s−1 and ambient temperature.
XPS analysis of the surface of the cycled lithium deposit on a copper substrate indicates that the SEI consists of an inner compact layer of LiF and an outer more diffuse layer of reduction products of the  anion (i.e.,
  LiF,
LiF, 


 LiOH, etc.). Analysis of the surface of a cycled bulk lithium electrode indicates, in addition to the
  anion reduction products, the presence of a significant quantity of native lithium surface species, namely,
  and
and  Figure 2 shows an example of the data acquired from the XPS measurements (the RTIL persisted on the sample surface, even under ultrahigh vacuum). Etching resulted in changes in the relative quantities of some of the nuclei, particularly fluorine (as shown). Further details of the characterization of the lithium surface in these electrolytes will be presented elsewhere.31
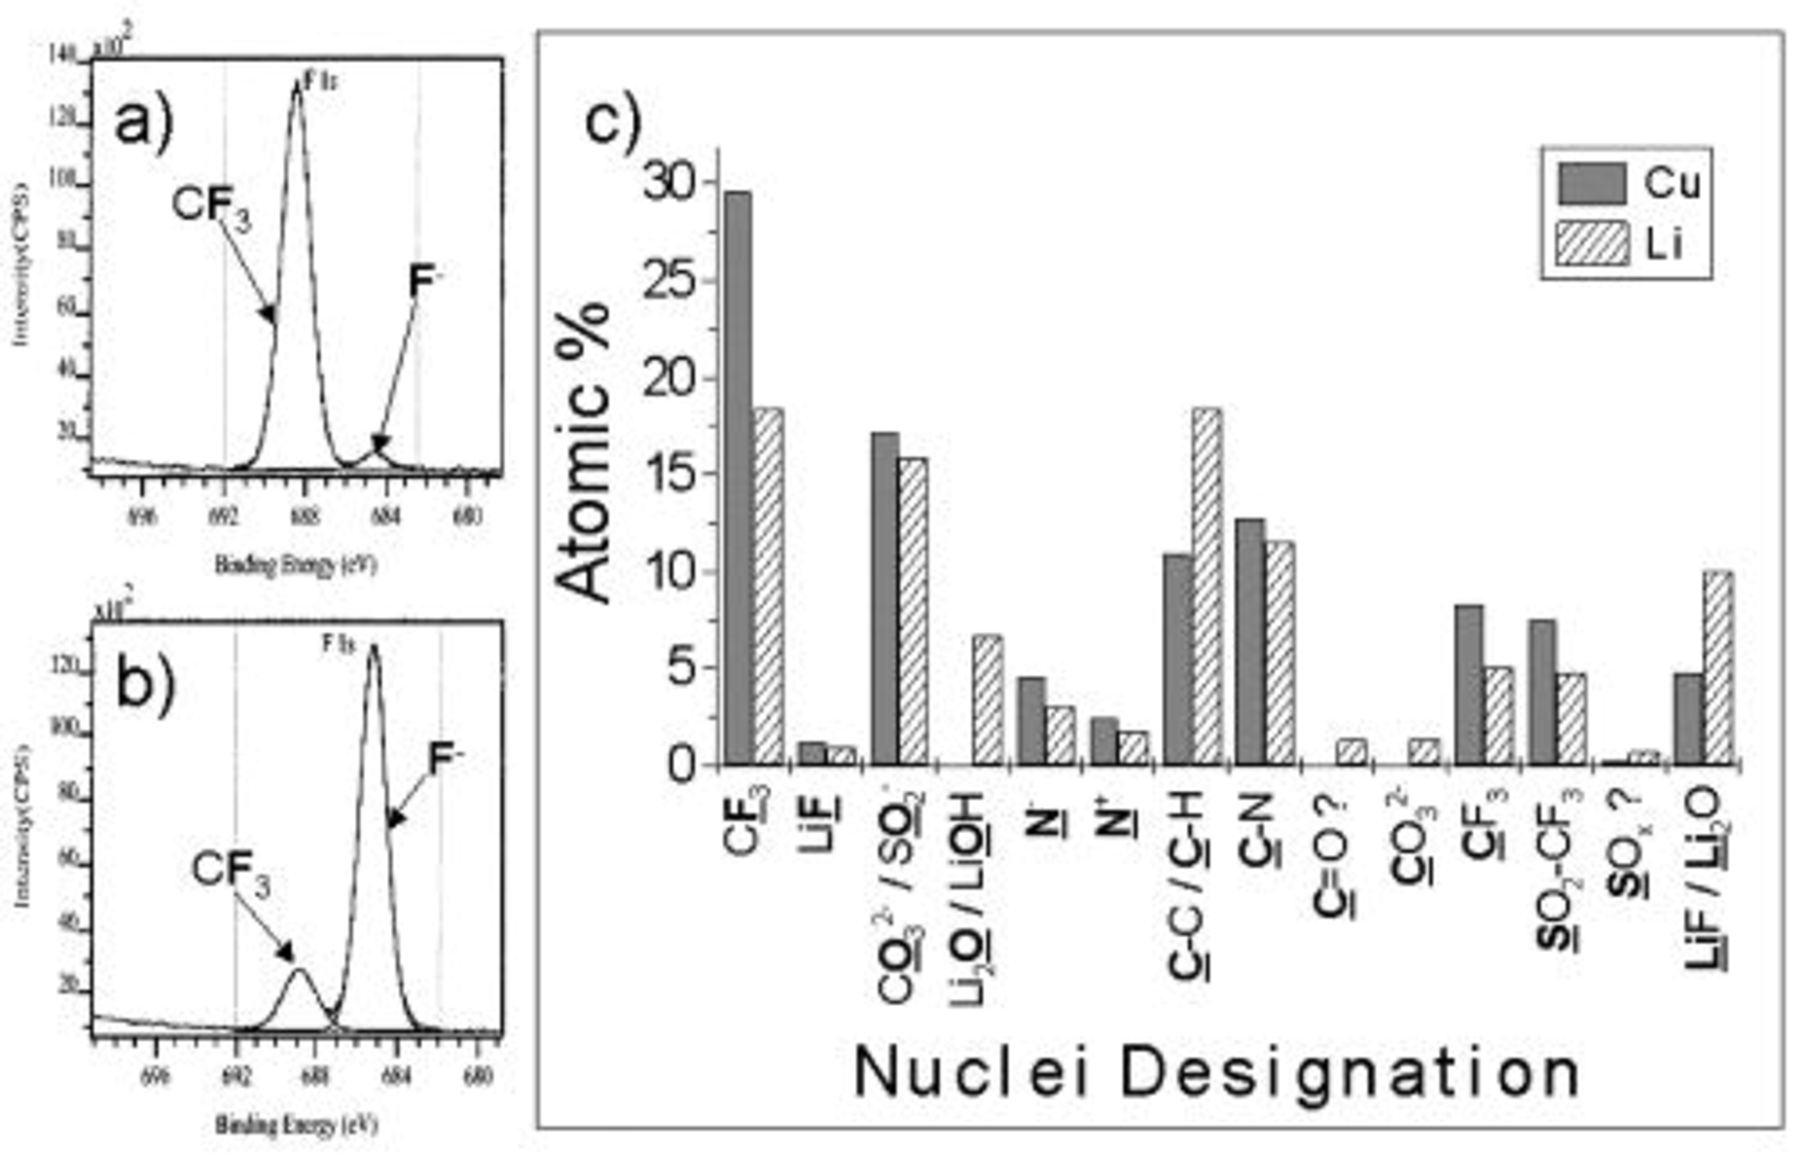
Figure 2. Example of XPS data obtained for a cycled lithium and lithium deposited on copper surface. (a) F1s XPS region spectrum, no etching; (b) F1s XPS region spectrum showing the effect of 15 min etch; (c) bar chart summarizing relative quantities of species present on the surface, a similar dataset was obtained for etched surfaces. The photoelectron line used to determine the chemical state is bold and underlined.
An example of the potential vs. time plot obtained from the average cycling efficiency experiments on a platinum substrate is shown in Fig. 3. The end point used to determine the number of cycles to calculate the ACE is taken as the point at which the final dissolution potential rapidly departs from its stable value. In this case, a cutoff of 2.5 V (vs.  is used. The dissolution end potential on a platinum substrate extends to a stable region of ∼1.5 to 2 V, within which the deposit cycles reversibly for many cycles. The ACE calculated from these experiments is as high as 99.1% (±0.1) where the current density is 1 mA cm−2. This determination is accurate due to the many cycles used in the calculation. Given that the most significant error results from the choice of the end cycle (as the quantity of charge can be measured accurately), then for an experiment where in excess of 300 cycles occurs, the error becomes trivial.
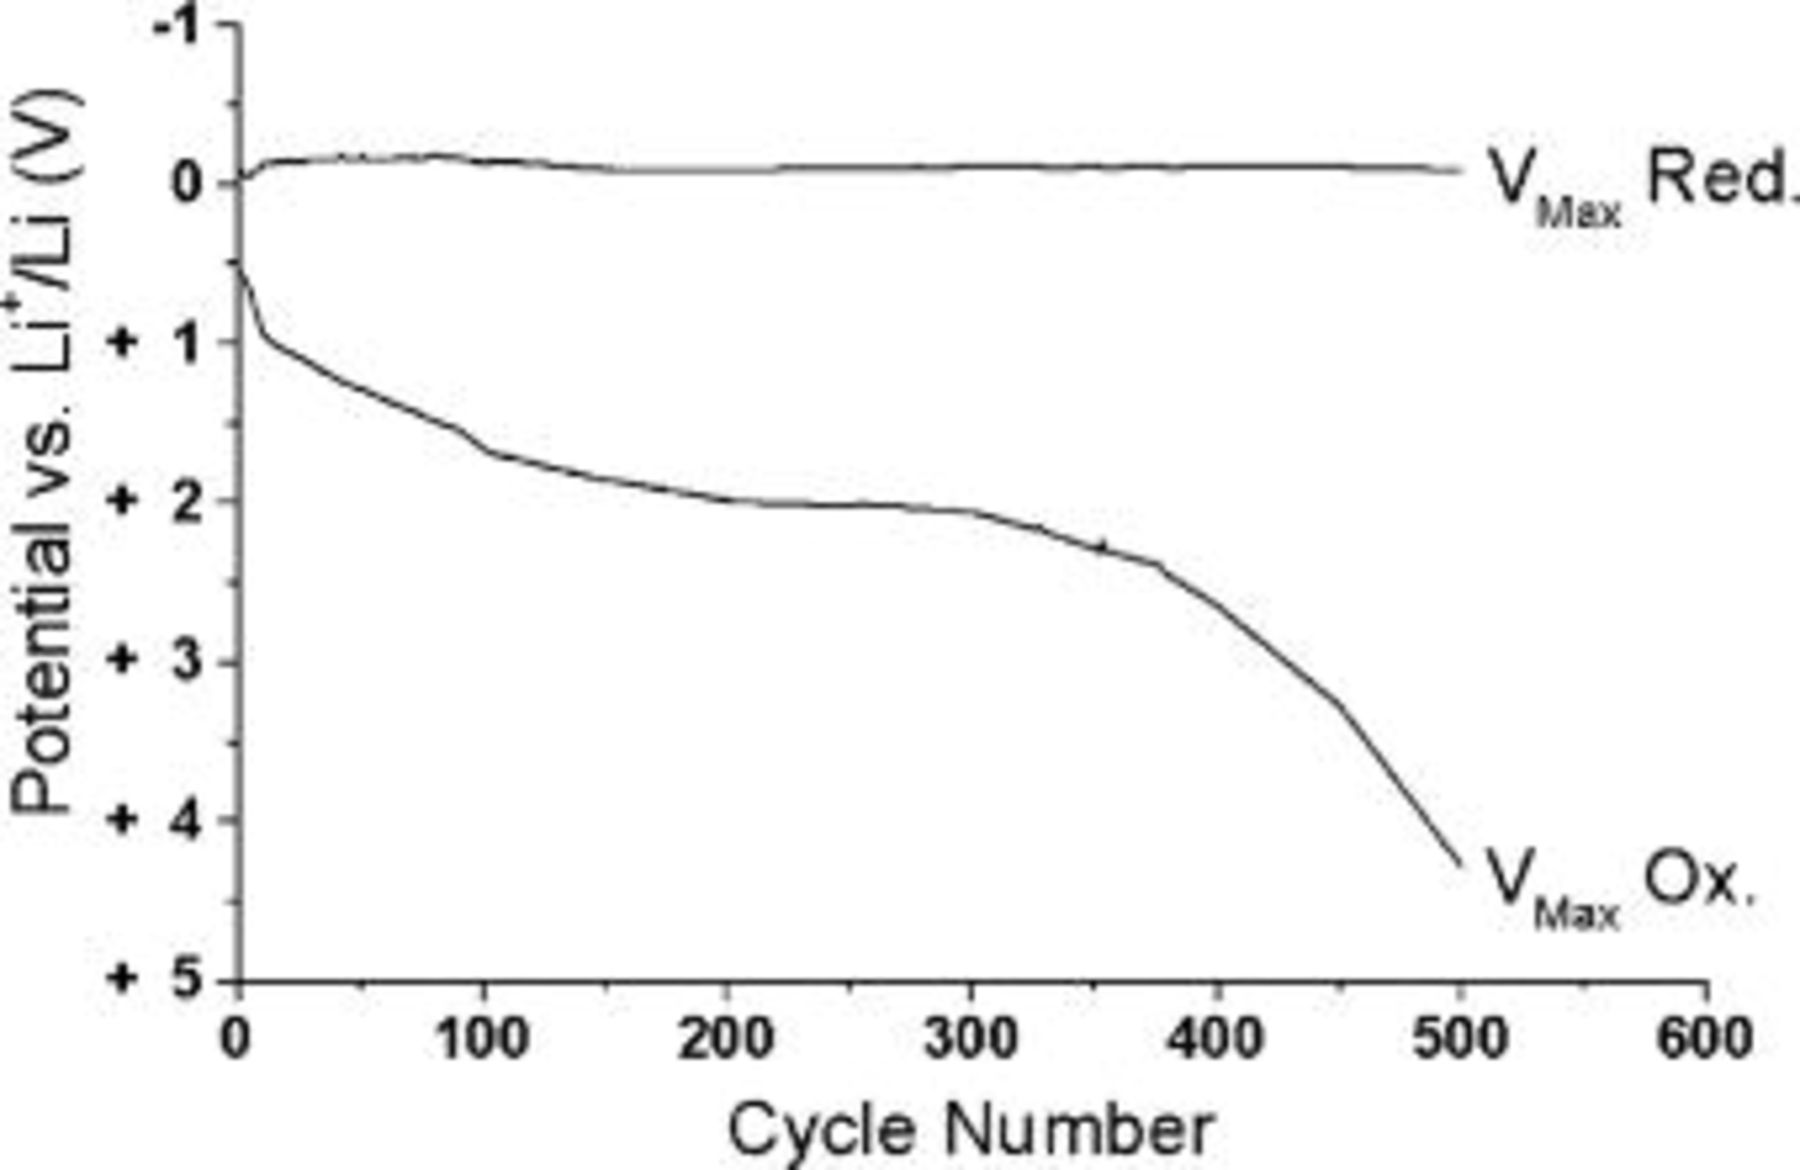
Figure 3. Potential profile plot showing the maximum reduction (deposition) and oxidation (dissolution) potentials for each cycle obtained from a cycling efficiency experiment. The experiment was conducted in 0.5 mol/kg  at 1.0 mA cm−2 on a platinum working electrode at 50°C. The cutoff was determined at 430 cycles giving 99.1% cycling efficiency.
Figure 4 shows a plot of the Coulombic cycling efficiency calculated (from Fig. 3) for pairs of cycles [N and  , each point represents an average of five consecutive cycles. In these experiments, where there is an excess of Li, this parameter relates mostly to the repeatability of the discharge process and indicates, for example, the occurrence of any significant buildup or alteration of the SEI from cycle to cycle (known to occur with many conventional liquid electrolytes). In the RTILs studied here, the Coulombic efficiency approaches 100% (within error) after an initial period during which, presumably, the SEI is formed. Such a high Coulombic efficiency indicates a stable interface. From the perspective of the cycle life of a cell having a Coulombic excess of Li of the extent used here, the experiment indicates cycle lives in excess of 300 cycles should be possible under these conditions.
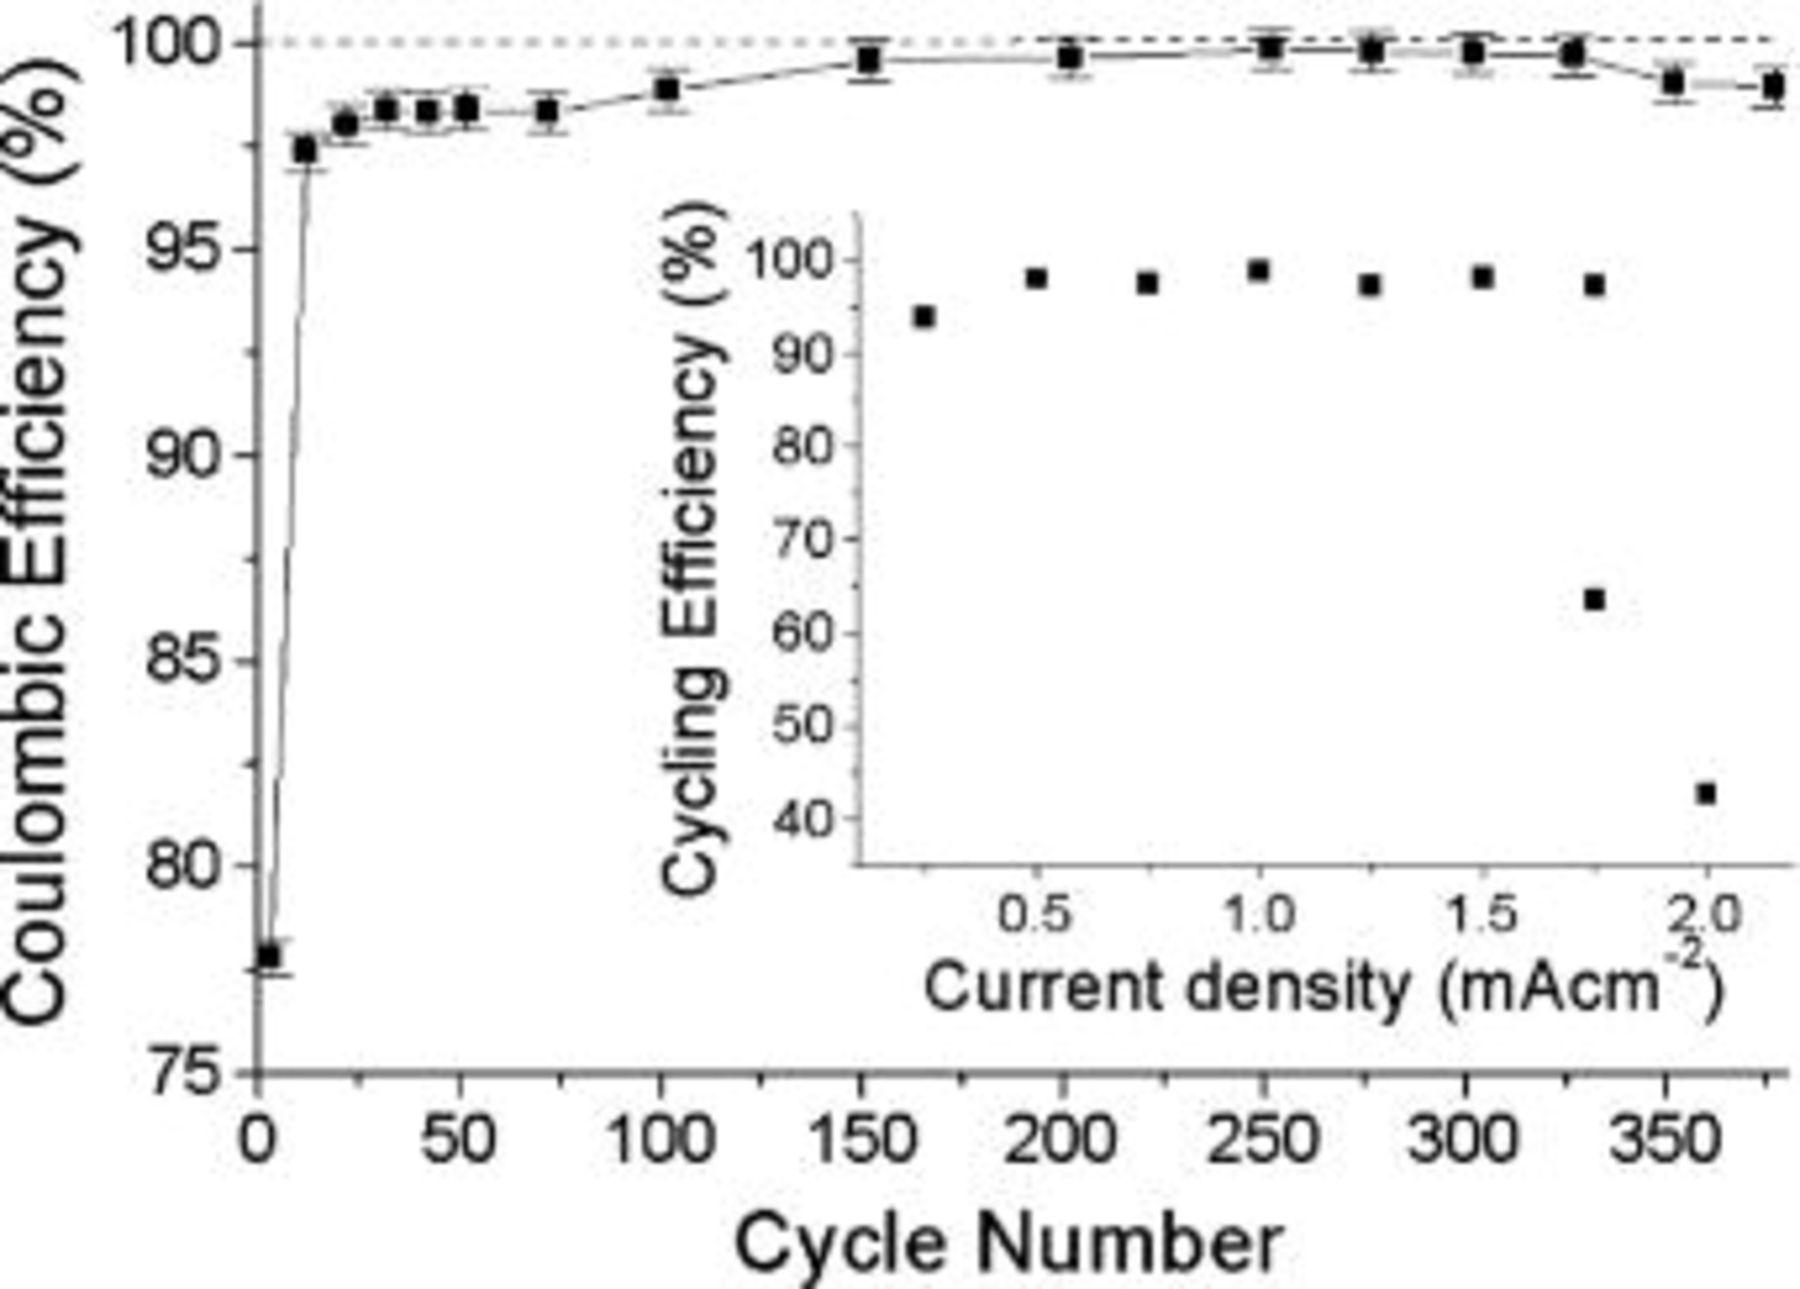
Figure 4. Coulombic efficiency calculated as a function of cycle number for 1.0 mA cm−2 cycling efficiency experiment in 0.5 mol/kg  on a platinum working electrode at 50°C, each point represents an average over five consecutive cycles. Inset: ACE in 0.5 mol/kg
  at 50°C as a function of current density on a platinum substrate.
A plot of current density vs. ACE is shown in the inset in Fig. 4. Deposition and dissolution current densities of equal magnitude (i.e.,  were used in each experiment. The deposition and cycling times differed for each experiment as a result of the differing current densities, thus for the 1 mA cm−2 experiment, the time to deposit 1 C cm−2 of lithium was 1000 s and the time to cycle (deposit and strip) 0.25 C cm−2 of lithium was 500 s. Similarly, for the 0.5 mA cm−2 experiment, deposition took 2000 s and cycling 1000 s. At low rates (i.e., 0.1 mA cm−2), the experiment was lengthy, requiring 10,000 s for deposition and 5000 s for cycling. The cycling efficiency displayed a maximum at around 1 mA cm−2. Above ∼1.75 mA cm−2 the efficiency rapidly degraded. We attribute this to the onset of dendritic deposition and the formation of dead lithium. There are many examples in the literature describing the influence of current density and its relationship to the deposit morphology and the lithium cycling efficiency.32
33
34
35 Matsui and Takeyama,36 in particular, show the onset of highly dendritic lithium deposit morphologies under diffusion-limited conditions in a polymer electrolyte.
were used in each experiment. The deposition and cycling times differed for each experiment as a result of the differing current densities, thus for the 1 mA cm−2 experiment, the time to deposit 1 C cm−2 of lithium was 1000 s and the time to cycle (deposit and strip) 0.25 C cm−2 of lithium was 500 s. Similarly, for the 0.5 mA cm−2 experiment, deposition took 2000 s and cycling 1000 s. At low rates (i.e., 0.1 mA cm−2), the experiment was lengthy, requiring 10,000 s for deposition and 5000 s for cycling. The cycling efficiency displayed a maximum at around 1 mA cm−2. Above ∼1.75 mA cm−2 the efficiency rapidly degraded. We attribute this to the onset of dendritic deposition and the formation of dead lithium. There are many examples in the literature describing the influence of current density and its relationship to the deposit morphology and the lithium cycling efficiency.32
33
34
35 Matsui and Takeyama,36 in particular, show the onset of highly dendritic lithium deposit morphologies under diffusion-limited conditions in a polymer electrolyte.
The maximum cycling efficiency exhibited at 1 mA cm−2 is most likely a result of the competing influences of deposition/dissolution current density. At low values, deposition is uniform and at high values the deposit becomes dendritic. Low dissolution current density results in pitting and promotes the formation of dendrites during the subsequent deposition cycle. The maximum value at 1 mA cm−2 indicates that, under these conditions, deposition is not dendritic and that dissolution is not resulting in pitting.
The optical micrographs displayed in Fig. 5 serve to illustrate the dramatic influence of current density on deposit morphology in RTILs. The highly dendritic deposition morphology clearly sets in at current densities between 1.75 and 2 mA cm−2. Presumably at this current density, deposition is largely diffusion controlled. The optical cell experiments also illustrate the difference in the behavior of the lithium deposited on copper and that of the bulk lithium electrode. At high current densities, (∼3 mA cm−2) the lithium deposited on a copper substrate became highly dendritic (Fig. 5c and d). In contrast the counter lithium electrode (which operated at similar current densities) surface remained uniform and free of dendrites, presumably because of the difference in SEI composition. The optical cell experiments indicated a lower cycling efficiency on a copper substrate than could be acquired on platinum. To investigate the influence of this more practical substrate, a copper WE was fabricated. The cycling efficiency experiment shown in Fig. 6 highlights some differences observed when using a copper substrate. The dissolution potential is significantly less negative and a sharper end point is observed when the excess lithium is consumed (compare with Fig. 1). It is apparent from Fig. 6 that the dissolution potential never approaches a potential where the oxidation of copper could take place (e.g., to form a copper halide), which would occur at ∼+3 V vs.  The cycling efficiencies obtained from the experiments performed on the copper WE were significantly lower then those obtained on platinum. The example in Fig. 6 returned a value of 91.8% at 1 mA cm−2. Experiments performed in the range of 0.2-1.0 mA cm−2 in both
  and
and  on copper returned cycling efficiencies in the range of 85-95% with a significant amount of variability. We attribute this to the stochastic nature of the lithium deposit initiation and growth on a copper substrate. The CV shown in the inset of Fig. 6 indicates that a significantly more negative deposition potential (approximately −160 mV vs.
  is required to initiate the process on the copper surface when compared with a platinum substrate (approximately +100 mV vs.
  Fig. 1). To optimize the nucleation conditions, an experiment was performed at 0.1 mA cm−2 in
  on the copper substrate. The deposit cycled continuously for 330 cycles (98.8%) without any indication of failure; the deposition and dissolution potentials were tending toward zero as the experiment progressed. The average deposition potential for cycles 20-50 was ∼200 mV vs. ∼100 mV in cycles 300-330. After 330 cycles the current density was increased to 0.25 mA cm−2. The deposit continued to cycle at low and decreasing deposition and dissolution potentials for another 72 cycles (99.0% total and >95.0% at 0.25 mA cm−2). The current density was increased again to 0.5 mA cm−2, the deposit cycled for another 62 cycles (>93.9% at 0.5 mA cm−2) before the experiment terminated. The deposit cycled for a total of 464 cycles (99.1%). The experiment indicates that very high cycling efficiencies can be obtained at low rates on Cu. Given that the initial deposit cycled continuously for over 20 days, this experiment also indicates that the rate of any self-discharge process that may have been occurring was negligible. More significantly, the experiment demonstrates that after the formation of a deposit with a suitable SEI and morphology, improved cycling efficiencies can be obtained at higher rates.
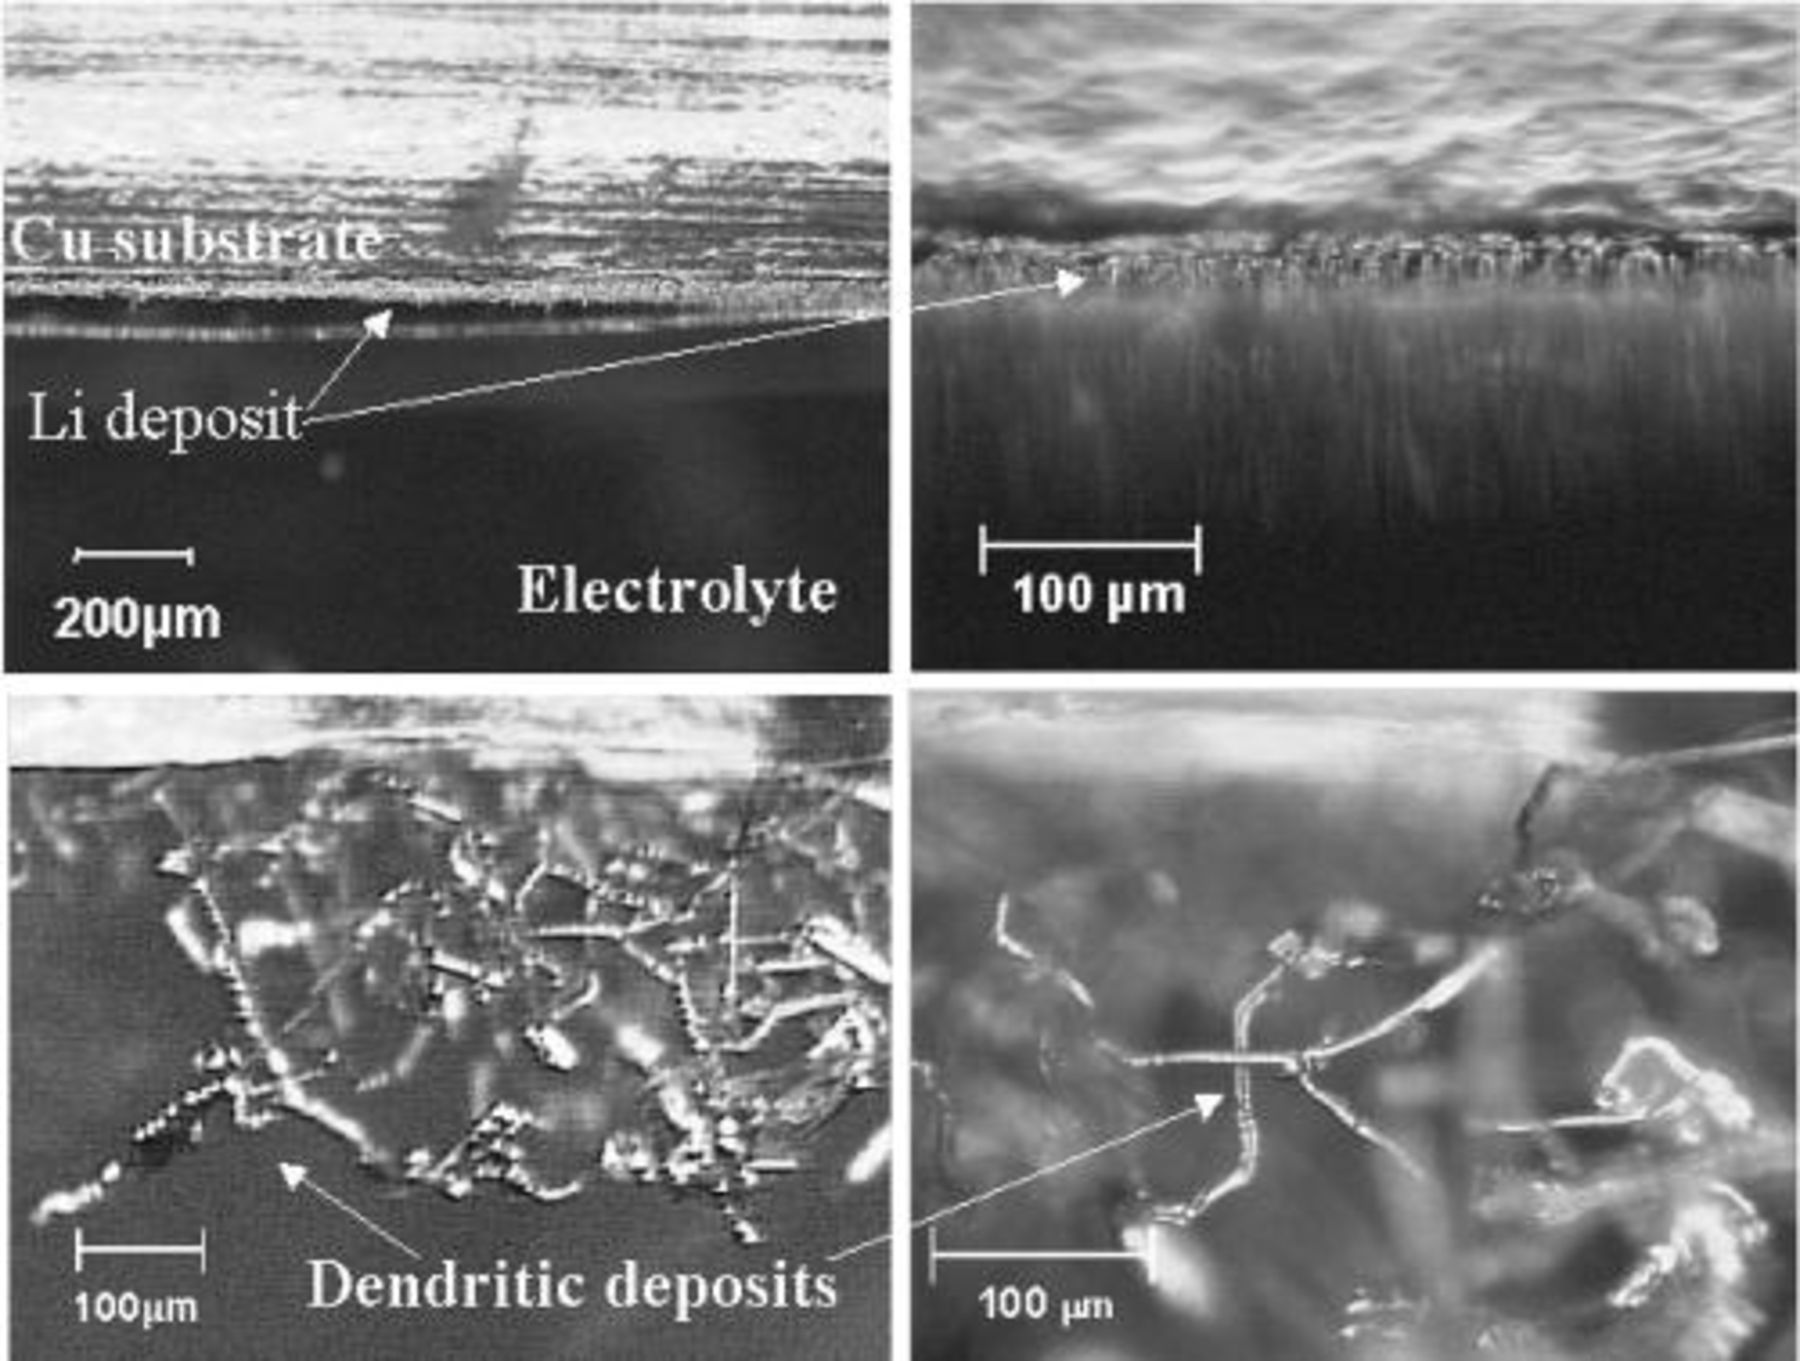
Figure 5. Optical micrographs of a lithium deposit on copper substrate. (a and b, top) Micrographs show uniform morphology deposited at ∼0.25 mA cm−2, ∼1.0 C cm−2 at 50°C in 0.5 mol/kg  (c and d, bottom) Micrographs show dendritic morphology deposited at ∼3 mA cm−2, 10.0 C cm−2 at 50°C in 0.5 mol/kg
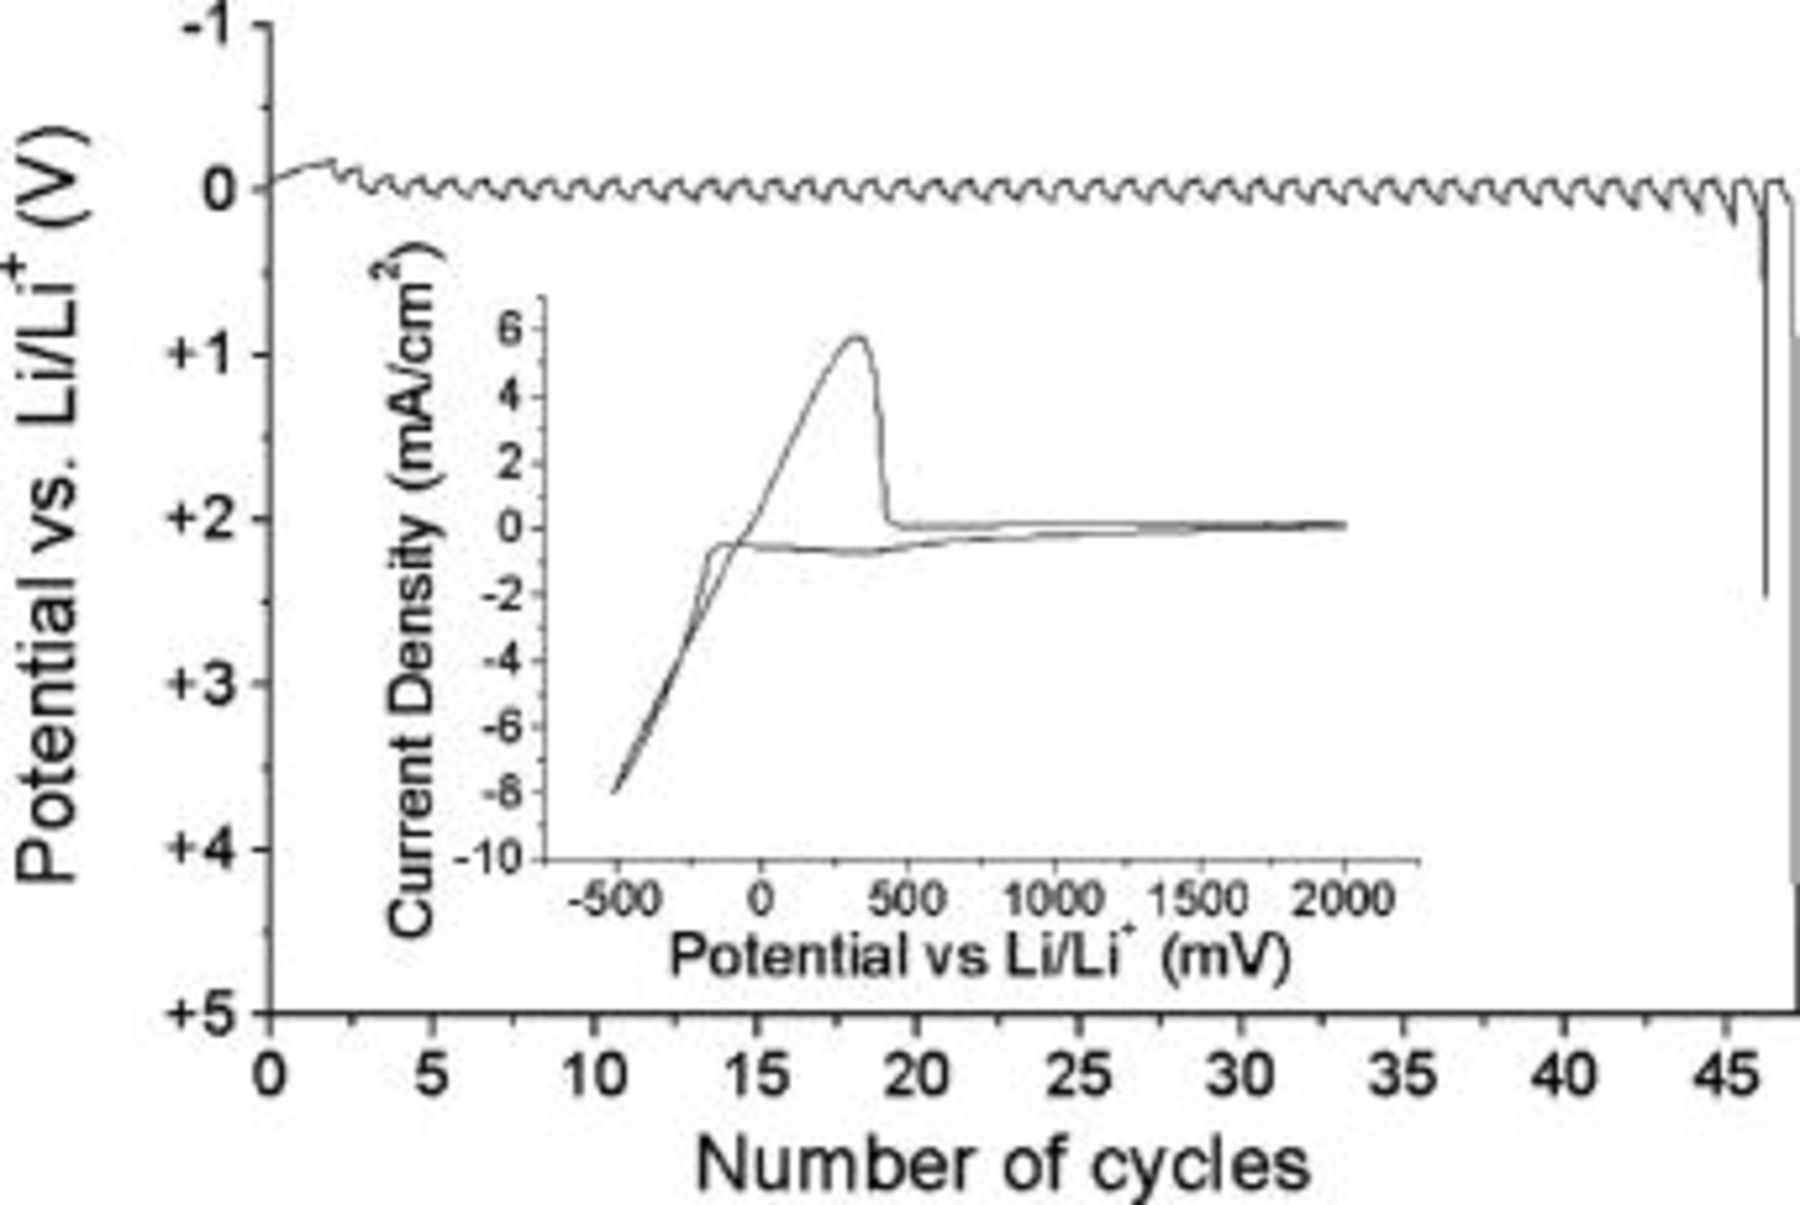
Figure 6. Potential profile plot obtained from a cycling efficiency experiment in 0.5 mol/kg  at 1.0 mA cm−2 on a copper working electrode at 50°C. Inset: CV for 0.5 mol/kg
  Copper working electrode, Li counter electrode, Li quasi-reference electrode at 100 mV s−1 and ambient temperature.
In recent work, Sakaebe and Matsumoto27 have compared the performance of  cells based on a range of quaternary ammonium cations including
  Their work, at much lower rates than those employed here (∼0.01 to 0.02 mA cm−2), showed that the piperidinium cation exhibited the most favorable cycling characteristics. In all cases shown, a severe capacity fade is evident, even at the very low current densities involved. Given the high cyclic efficiencies presented here for the Li anode, in this type of RTIL, it appears that the capacity fade is associated with the cathode.
Conclusion
The  RTIL system reported here allows lithium to be cycled with a high degree of reversibility. Uniform lithium deposit morphology over many cycles can be achieved at moderate current densities. Cycling efficiencies exceeding 99% have been obtained. The formation and cycling history of the deposit influences its cycling properties, particularly enabling cycling at increased rates following formation at lower rates. It is likely that careful control of deposition conditions and optimization of the system (e.g., choice of substrate, current density, overpotential, use of additives) will yield even higher efficiencies than reported here. The stable and reversible cycling appears to be in part related to the presence of the
  cation, which is stable at negative potentials. A stable SEI has been identified and characterized, which consists of reduction products of the anion. Further investigations into the cycling properties of the
  system are presently underway.
Acknowledgment
The authors thank Dr. Narelle Brack of the Center for Materials and Surface Science, La Trobe University, for her assistance with the acquisition and analysis of the XPS data.
CSIRO assisted in meeting the publication costs of this article.