
Abstract
High- and low-frequency pulse current (PC) and pulse-reverse current (PR) were employed to the plated-through-hole (PTH) process. To understand the role of additives in PC and PR, chloride ions, polyethylene glycol (PEG), and 3-mercapto-1-propanesulfonate (MPS) were used as additives and compared to baths without additives. Linear sweep voltammetry, cyclic voltammetry, and impedance analysis were employed to characterize this system on a rotating disk electrode. In the bath without additives, it was found that deposition uniformity in PTH with high-frequency PC and PR at 20 mA/cm2 average current density were better than that with low-frequency PC and PR, even better than that of dc at 10 mA/cm2. Based on impedance analysis, plating at low frequency is dominated by the diffusion of cuprous or cupric ion while plating at high frequency is dominated by  resulting in the deposition improvement by high-frequency PC and PR. In the presence of
  the uniformity improves with dc at 20 or 10 mA/cm2. The trend in the baths with additives using PC and PR plating at high and low frequency is similar to that in the bath without additives. However, the improvement by high-frequency PC and PR is insignificant, since the plating is under adsorption control. © 2003 The Electrochemical Society. All rights reserved.
Export citation and abstract BibTeX RIS
Recently, high-density interconnection (HDI) has been one of the major trends in printed circuit boards (PCBs). The HDI substrate uses microvias to connect adjacent conductive layers and plated-through-holes (PTHs) are naturally a major component.1 2 The trend in the manufacture of PCBs is toward more layers with smaller through-holes, which implies higher aspect ratio of through-holes and consequently, greater difficulty in achieving uniform copper deposition.
Generally, there are two ways to improve deposition uniformity in the PTHs. One is changing the current waveform; the other is adding additives into the plating bath. With pulse current (PC), a periodic relaxation time can enhance the mass transfer of cupric ions. With pulse-reverse current (PR), the reverse current causes copper dissolution that induces more copper deposition during the ON period. Both PC and PR are widely used in the PTH process.3 4 5 The additives used include brightener, leveler, and suppressor. These additives are generally organic compounds that act as inhibitors, grain refiners, and ductilizers and may be codeposited with copper.6 7
At a given potential, there always exits an electrical double layer at the metal-solution interface. The double layer influences the response of PC or PR when the PC or PR frequency is high (>200 Hz). Puippe and lbl8
9 proposed that the electrode response with high-frequency PC would approach that of a dc signal due to charging and discharging the double layer and the deposit properties were similar to those obtained by direct current (dc) plating. Holmbom and Jacobsson3 found that with high-frequency PC or PR, the uniformity in PTH was improved compared with that of dc, because the faradaic current from the discharge of the double layer would be more uniform since there is no ohmic drop in the solution during the OFF time. So far, the major influence of high-frequency PC or PR on the electrode response is that faradaic current is damped due to charging and discharging the double layer. Our previous study showed that although overpotential response at high frequency was affected by the double layer, the high frequency PC changed the rate-determining step of copper deposition.10 Until now, few reports in the literature have discussed the deposition property with high-frequency PC or PR. In the present study, high-frequency PC and PR of which the double-layer effect is significant are applied to the PTH process. The uniformity of copper deposit in the PTHs with high- and low-frequency PC and PR are compared. Since additives are used in the commercial plating bath, chloride ions  polyethylene glycol (PEG), and 3-mercapto-1-propanesulfonate (MPS) are used and compared to the bath without additives in order to understand the role of additives in PC and PR processes.
Experimental
Through-hole plating.—
The configuration of through-hole for this study is shown in Fig. 1. The circuit board is 3.3 mm thick. The holes connecting the board surface, which has a diameter of 0.42 mm, were predeposited with 15.6 μm electroless copper. Prior to plating, the substrate was cleaned with 5%  for 1 min. The anode was made of phosphorus-depolarized copper. The cathode was kept quiescent. The plating bath was operated at room temperature and was magnetically stirred at 300 rpm.
Figure 1. Dimension of through-hole and approximate locations where deposit thickness was measured.  is the thickness of copper at the edge and
  is the thickness of copper at the center.
Copper was deposited with dc, PC, or PR plating. The waveform of PC was controlled with a cathodic peak of 40 mA/cm2 and 0.5 duty cycle. The waveform of PR was controlled with a cathodic peak of 25 mA/cm2, an anodic peak of 75 mA/cm2, and 0.95 duty cycle. The pulse periods for both PC and PR were 200 and 0.02 ms for low and high frequency, respectively. The PC and PR were generated from a potentiostat/galvanostat (EG&G PARC model 362) which was controlled by a function generator (BNC Corp., model 625). The average current density of PC and PR was 20 mA/cm2. The dc current density was controlled at 20 or 10 mA/cm2. The plating time for the average current density of 20 and 10 mA/cm2 was 35 and 70 min, respectively. The copper deposit obtained was 20 μm thick. Further details regarding the waveform are listed in Table I.
Table I.
Characteristics of current waveform and the uniformity of deposition in through-holes. Where  is the cathodic peak current density, is the cathodic peak current density,  is the anodic peak current density, and is the anodic peak current density, and  is the average current density. is the average current density. | |||||||
|---|---|---|---|---|---|---|---|
| Sample | Additive | Pulse perioda (ms) | Dutycycle |
 (mA/cm2)
 |
 (mA/cm2)
 |
 (mA/cm2)
 | Uniformity ofdeposition (%) |
| DC10 | No | dc | 10 | 57 | |||
| DC20 | No | dc | 20 | 36 | |||
| PC200 | No | 200 | 0.5 | 40 | 0 | 20 | 53 |
| PC0.02 | No | 0.02 | 0.5 | 40 | 0 | 20 | 68 |
| PR200 | No | 200 | 0.95 | 25 | 75 | 20 | 47 |
| PR0.02 | No | 0.02 | 0.95 | 25 | 75 | 20 | 72 |
| ADC10 | Yes | dc | 10 | 60 | |||
| ADC20 | Yes | dc | 20 | 53 | |||
| APC200 | Yes | 200 | 0.5 | 40 | 0 | 20 | 55 |
| APC0.02 | Yes | 0.02 | 0.5 | 40 | 0 | 20 | 58 |
| APR200 | Yes | 200 | 0.95 | 25 | 75 | 20 | 48 |
| APR0.02 | Yes | 0.02 | 0.95 | 25 | 75 | 20 | 62 |
| a The frequency of pulse is the inverse of pulse period. The frequency of 200 and 0.02 ms pulse period are 5 Hz and 50 kHz, respectively. | |||||||
The basic composition of the plating bath was 0.2 M  and 0.45 M
  In the presence of additives, 80 ppm
  100 ppm PEG, with 4000 average molecular weight and 40 ppm MPS were added into the bath.
The uniformity of copper deposition in the through-hole was evaluated by measuring the copper thickness in the edge and the center locations of the hole as illustrated in Fig. 1. To make a quantitative comparison of the uniformity in the PTH, we define the uniformity of deposition, U, as follows
where  is the thickness of copper at the edge and
  is the thickness of copper at the center. Apparently a perfect uniform deposit would show a U of 100%.
Linear sweep voltammetry, cyclic voltammetry, and impedance.—
A three-electrode glass cell with a copper plate counter  and a saturated mercurous sulfate reference (SSE) electrode was used for all measurements. The temperature was controlled at 25°C. The working electrode was a Cu rotating disk electrode (RDE) 4 mm in diam. The disk rotation speed was set at 500 rpm for all measurements. When additives were needed, 80 ppm
  100 ppm PEG with 4000 average molecular weight, or 40 ppm MPS was added to the bath. Prior to measurement, the electrode surface was carefully polished with fine emery paper and then rinsed with deionized water. The electrode was then predeposited in the electrolytic solution at a constant of 25 mA/cm2 for 360 s. Linear sweep voltammetry (LSV) was carried out immediately after the predeposition using a Schlumberger Sl 1286 potentiostat at 1 mV/s starting from open circuit potential (OCP) to 175 mV vs. OCP in the anodic direction or to −300 mV vs. OCP in the cathodic direction. For cyclic voltammogram (CV) measurements, the scan rate was set to 1 mV/s with a scan range between −300 and 200 mV or 150 mV vs. OCP for five cycles.
The predeposition for impedance analysis was carried out at a constant 25 mA/cm2 and 500 rpm. The predeposition time was 360 s for cathodic analysis and 900 s for anodic analysis. Impedance measurements were conducted with an AUTOLAB Potentiostat 20 (Ecochemic, Holland). An ac amplitude of 5 mV rms was used in all studies. The frequency was swept from 50 kHz to 0.05 Hz. The steady potential was set at −150 mV vs. OCP for cathodic analysis and 75 mV vs. OCP for anodic analysis. All experiments were conducted at least twice to confirm the reproducibility of all measurements.
Results
Through-hole plating.—
The cross-sectional views of PTH from the baths with and without additives are shown in Fig. 2 and 3. A quantitative comparison of the uniformities of deposition in the through-hole under various conditions is listed in Table I. The frequency of pulse is the inverse of pulse period. The frequency of PC and PR with 200 and 0.02 ms pulse period arFe 5 Hz and 50 kHz, respectively. The uniformity of deposition with dc at 20 mA/cm2 is lower than that at 10 mA/cm2 because cupric ion is depleted more quickly in the though-hole at higher current density. With low-frequency PC (200 ms pulse period), the uniformity is improved due to the enhancement of mass transfer. The uniformity increases from 53 to 68% with frequency increasing from 5 Hz to 50 kHz. The same result is obtained in the PR plating. The uniformity increases from 47 to 72% with frequency increasing from 5 Hz to 50 kHz using PR plating. The reason for the improvement of uniformity using high-frequency PC and PR plating is discussed later. Previous studies3 5 generally claim that PR is more effective than PC for deposition uniformity. However, we found that with low-frequency PC and PR, the uniformity of PR (PR200) is 47%, which is actually lower than that of PC (PC 200). This is probably because the relatively short dissolution time in the PR process is not enough to dissolve the copper deposit near the opening, and the concentration gradient in the through-hole is higher without the effect of relaxation time which is present in the PC process.
Figure 2. Cross-sectional view of the plated through-hole from bath without additives.
Figure 3. Cross-sectional view of the plated through-hole from bath with 
When additives are used, the uniformity improves with dc at either 20 or 10 mA/cm2. For instance, the addition of additives can improve the uniformity from 36 to 53% at 20 mA/cm2. The effect of PC or PR when additives are present is similar to that without additives. For instance, the uniformity improves from 53 to 62% when dc is switched to high-frequency PR (APR0.02). However, the improvement is less significant when additives are present, the reason for which is discussed later.
Linear sweep voltammetry.—
The steady-state  characteristics of plating bath with various additives are shown in Fig. 4. The negative current stands for deposition of copper while the positive current stands for dissolution of copper. In agreement with previous studies,6
11
12
13 the addition of
characteristics of plating bath with various additives are shown in Fig. 4. The negative current stands for deposition of copper while the positive current stands for dissolution of copper. In agreement with previous studies,6
11
12
13 the addition of  significantly inhibits not only the deposition of copper but also the dissolution of copper, while the combination of
  accelerates the deposition and the dissolution rate.
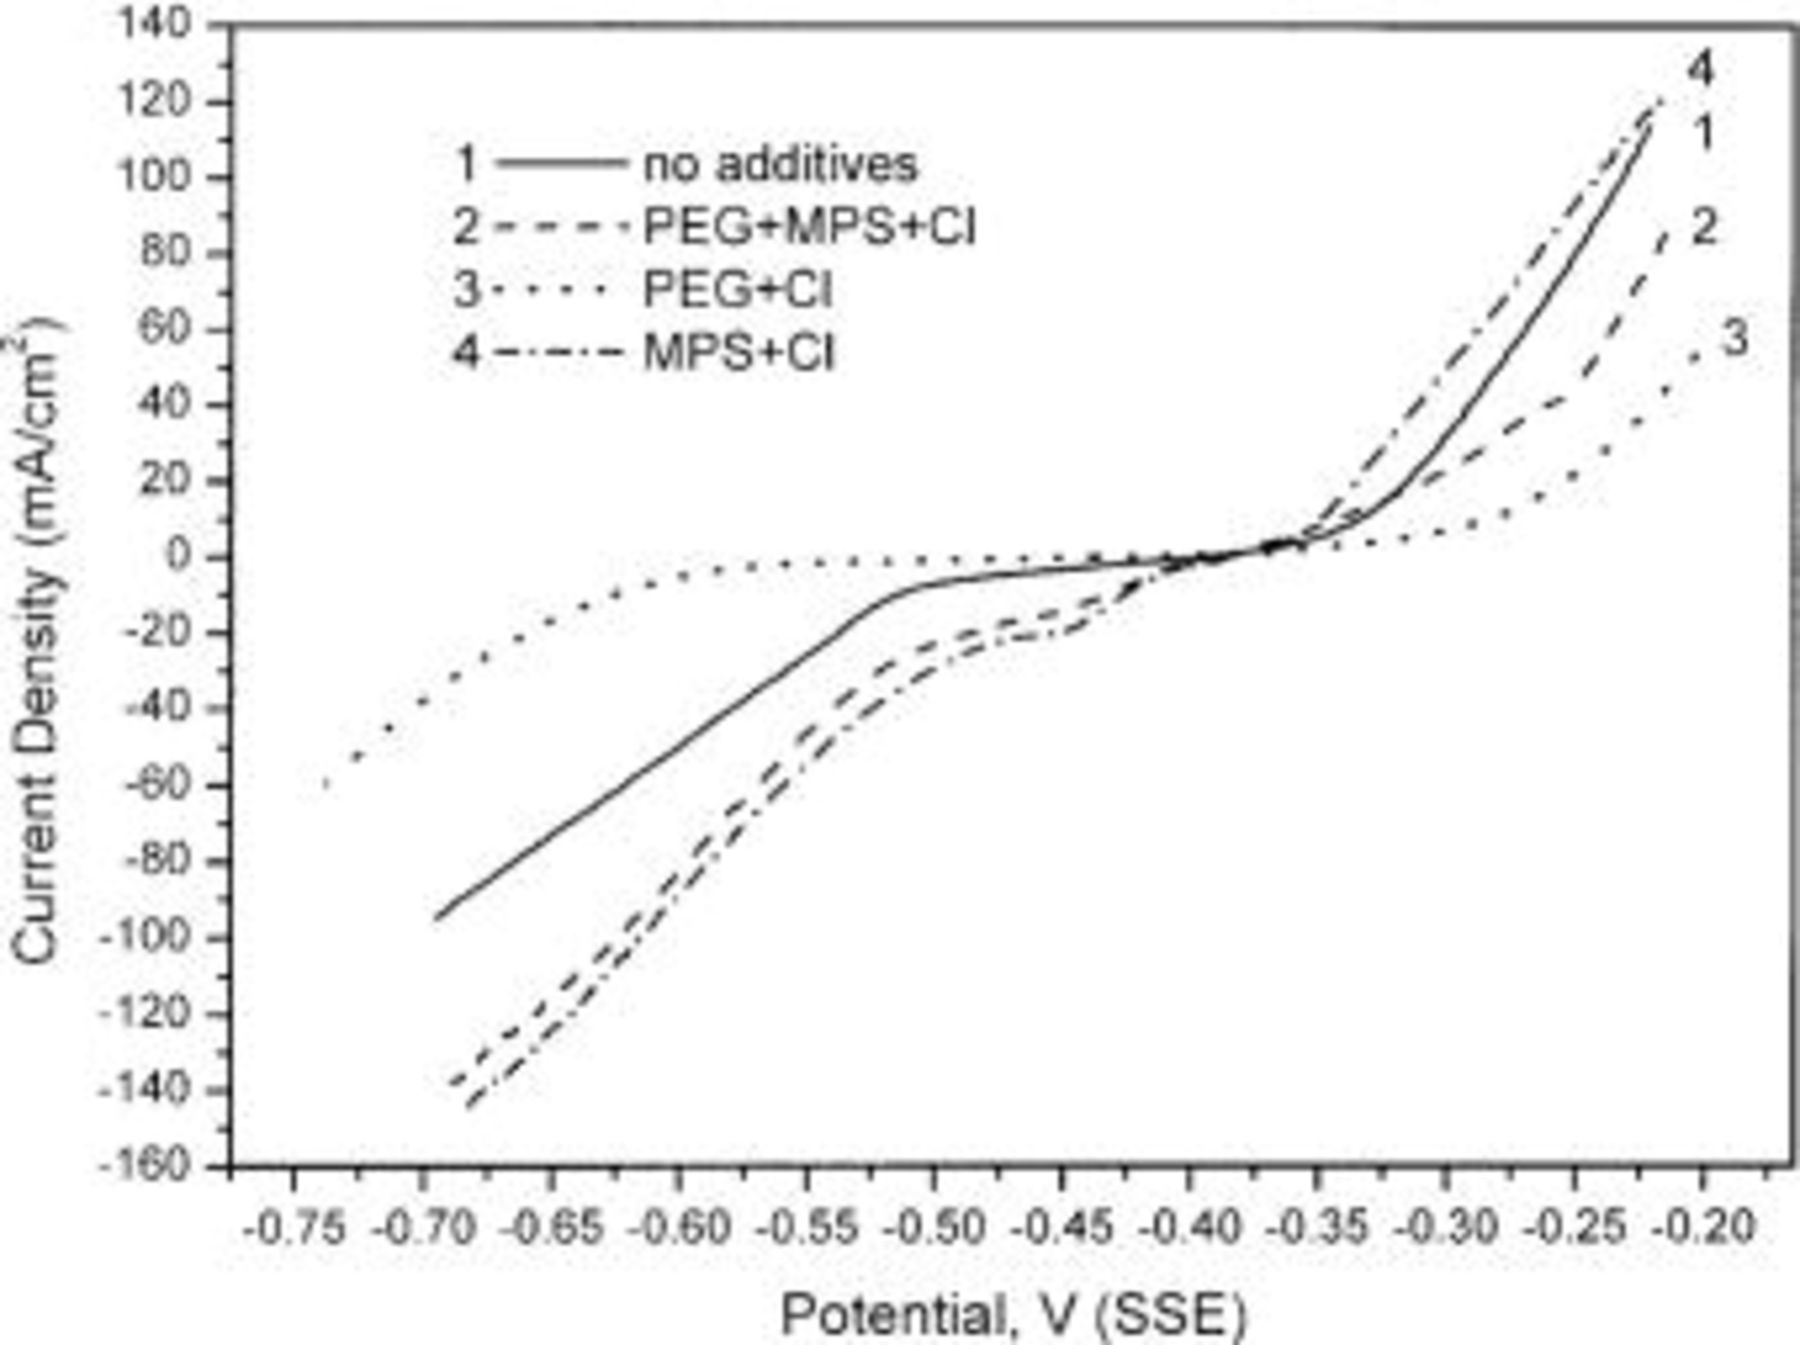
Figure 4. LSV curves obtained from a copper RDE at 25°C and 500 rpm in baths with various combinations of additives.
When all three additives are present, the copper deposition rate is less accelerated compared to the bath with  however, the copper dissolution rate is inhibited compared to additive-free electrolyte. The net acceleration of copper deposition is consistent with Pearson and Dennis' report.6 However, a net inhibition of copper deposition in the presence of
  was found by Moffat et al.13 with lower concentration of MPS and
  compared to this study. This seemingly inconsistent result implies that the concentration of MPS and
  may affect the competition between the effect of PEG and MPS.
Cyctic voltammetry.—
Figures 5 and 6 show the CV results of five cycles in baths with various additives. A hysteresis loop is apparent in the bath with  in all cycles and in the first cycle in the bath with
  According to Moffat et al. ,13 the lack of hysteresis indicates that no irreversible change of the surface chemistry occurs and a hysteresis loop corresponds to an irreversible change during the deposition and dissolution process. The hysteresis loop in the bath with
  indicates that the acceleration of
  is irreversible. However, when
  combines with PEG, the hysteresis loop disappears after the first cycle, indicating that the surface chemistry of the combined three additives does not change during deposition and dissolution.
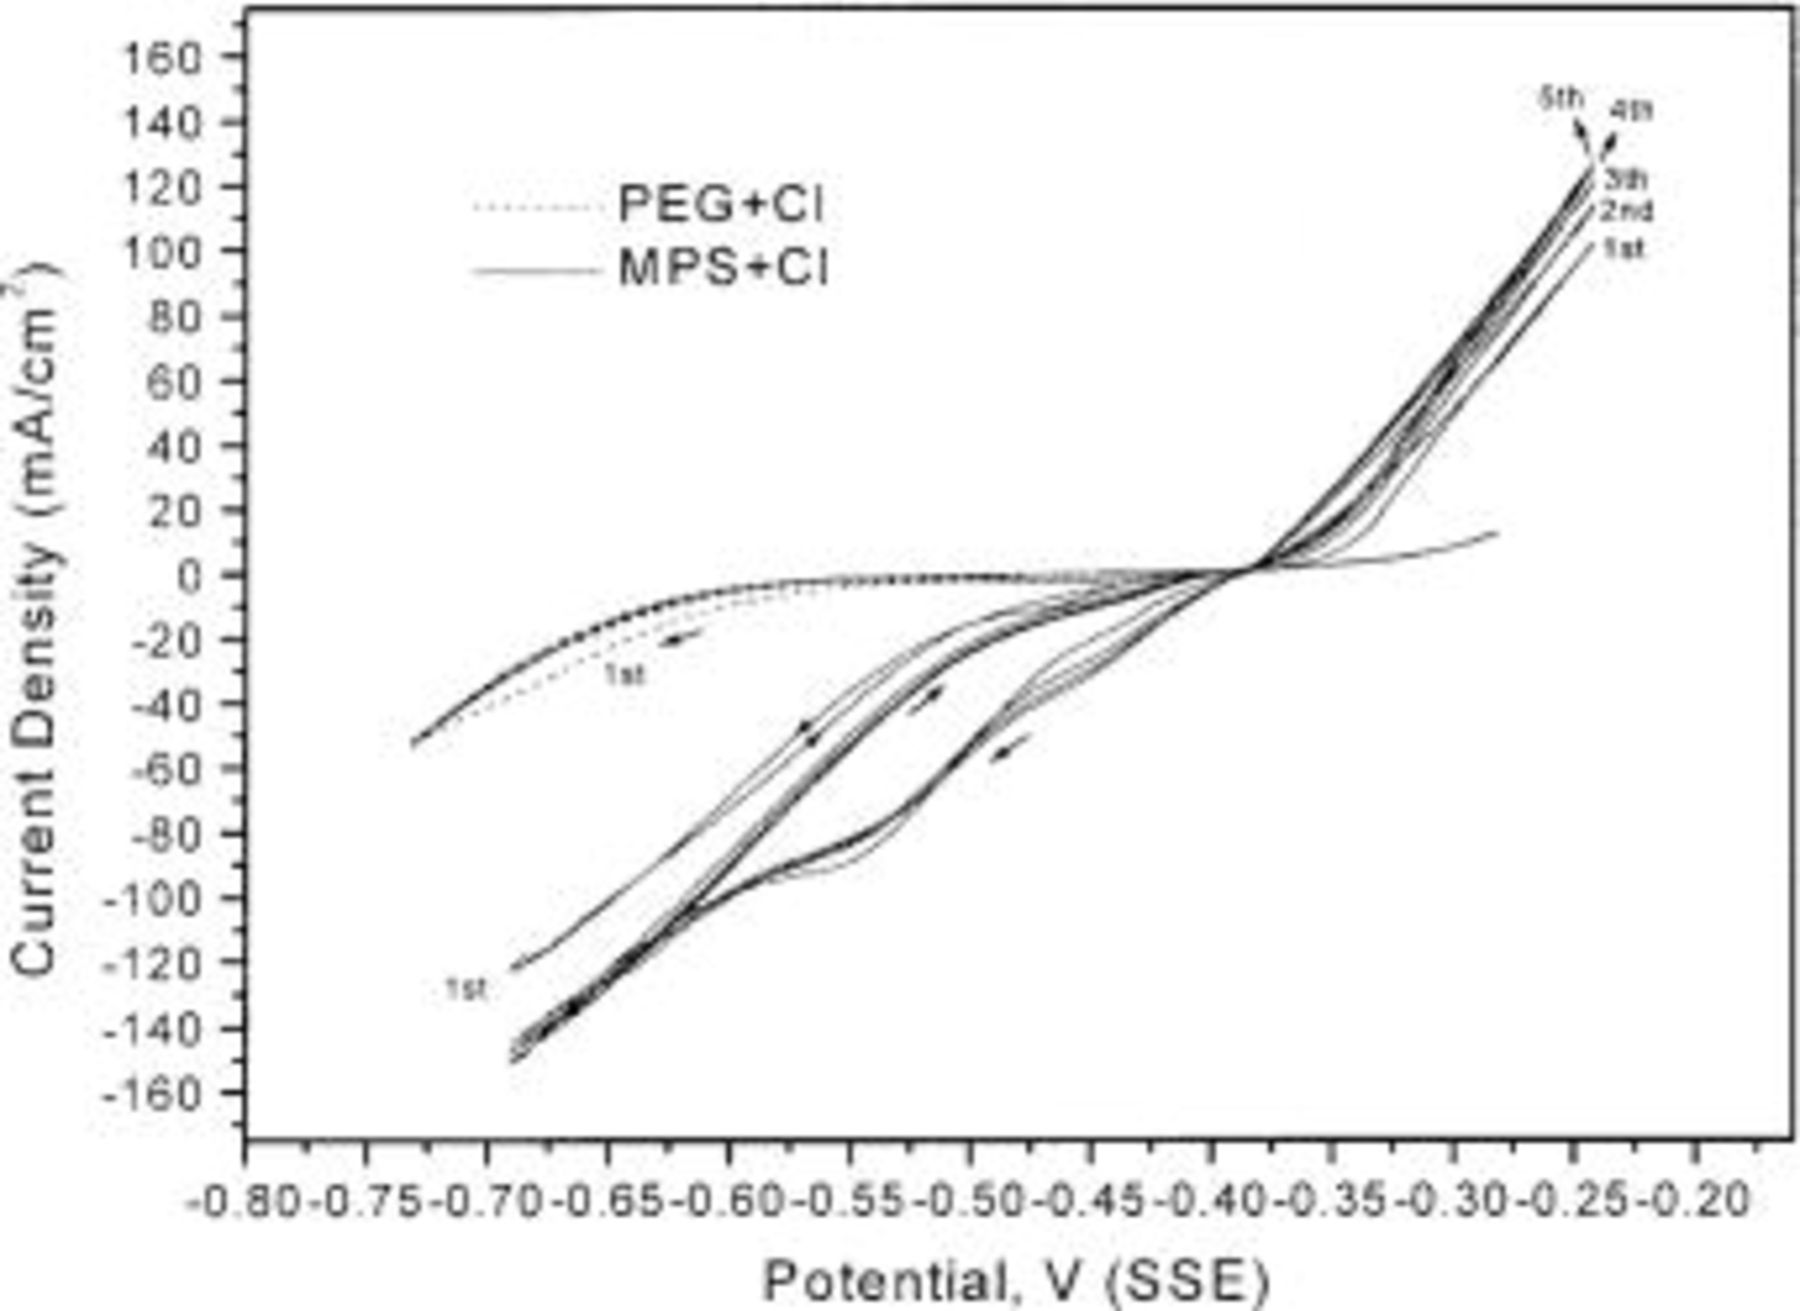
Figure 5. Five-cycle CV in the baths with  and
and  A hysteresis loop is observed in the baths with
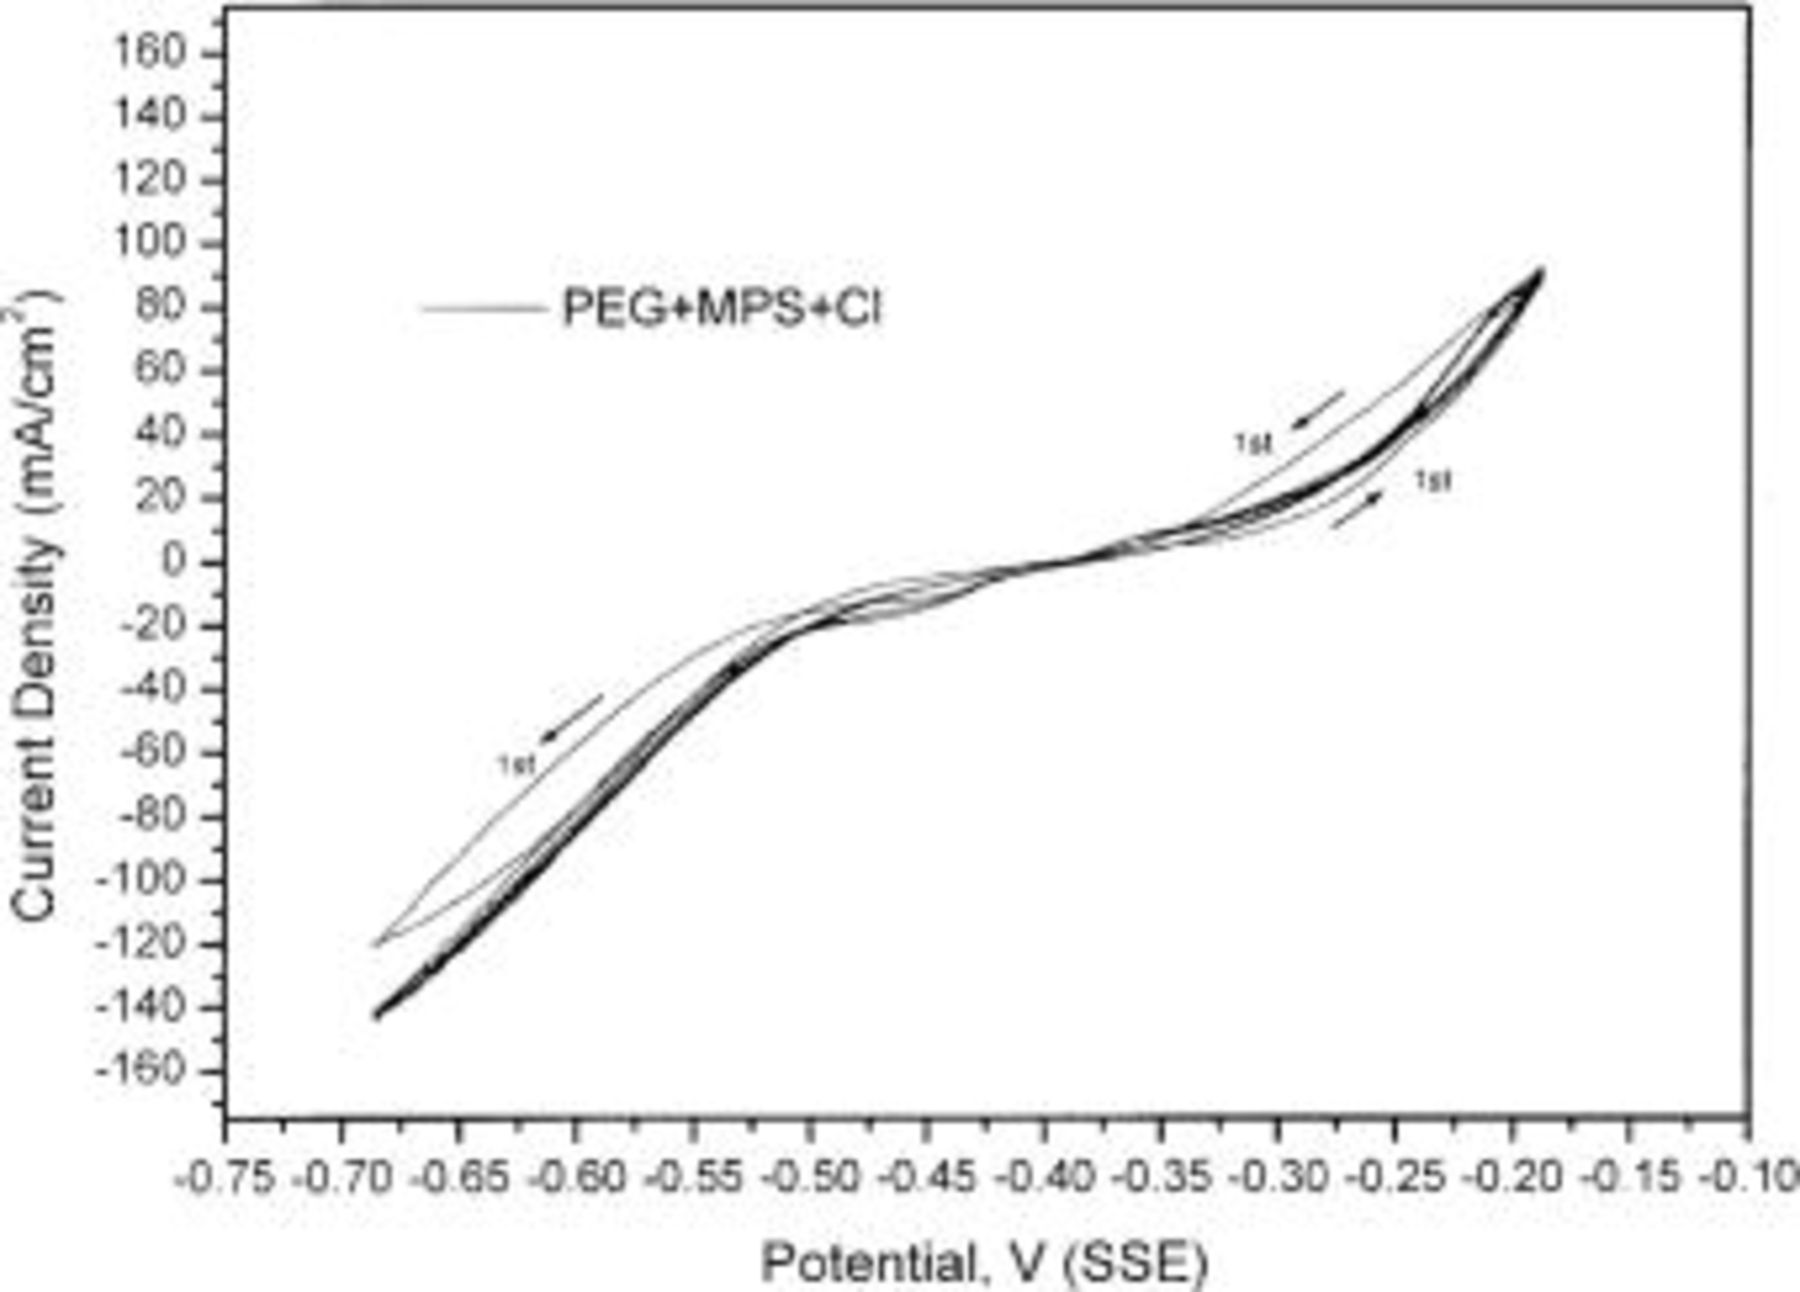
Figure 6. Five-cycle CV in the baths with  A hysteresis loop is only observed in the first cycle CV.
Impedance.—
For the PC and PR plating, a periodic square-wave was employed. In the impedance measurement, a sinusoidal potential or sinusoidal current was imposed to the cell. Our previous study showed that the analysis of pulse plating is similar to impedance.10 Since the measurement of impedance is more precise than the potential response of pulse plating, we used impedance to analyze the deposition and dissolution of copper in the baths with and without additives.
Impedance plane plots obtained in cathodic and anodic regions are shown in Fig. 7 and 8. For the cathodic overpotential, two semicircles along the horizontal axis are found in the baths with and without additives as shown in Fig. 7. According to Reid and David,14
15 the high-frequency semicircle corresponds to a charge-transfer step in parallel with the double-layer capacitance. The poorly resolved low-frequency section in the bath without additives (Fig. 7a) is attributed to the transfer of cuprous ion or cupric ion to the electrode surface. In the presence of additives (Fig. 7b-d), a larger semicircle and an inductive loop are found at the low-frequency loop, which might be attributed to diffusion through the adsorption layer of additives and/or to the adsorption of intermediate  ion linked to adsorbed additives on the copper surface.16 According to Reid and David,14
15 the diameter of the high-frequency semicircle corresponds to the resistance of charge transfer. The smaller the charge-transfer resistance, the faster the deposition rate. In Fig. 7d, the high-frequency semicircle of
ion linked to adsorbed additives on the copper surface.16 According to Reid and David,14
15 the diameter of the high-frequency semicircle corresponds to the resistance of charge transfer. The smaller the charge-transfer resistance, the faster the deposition rate. In Fig. 7d, the high-frequency semicircle of  is larger than that of additive-free electrolyte, implying that deposition is inhibited in the bath with
  In Fig. 7c, the smaller semicircle implies that the deposition rate is accelerated in the bath with
  Similarly, the combined action of all three additives (Fig. 7b),
  leads to a net acceleration of copper deposition relative to additive-free electrolyte. The result of impedance at cathodic overpotential is consistent with the result of LSV.
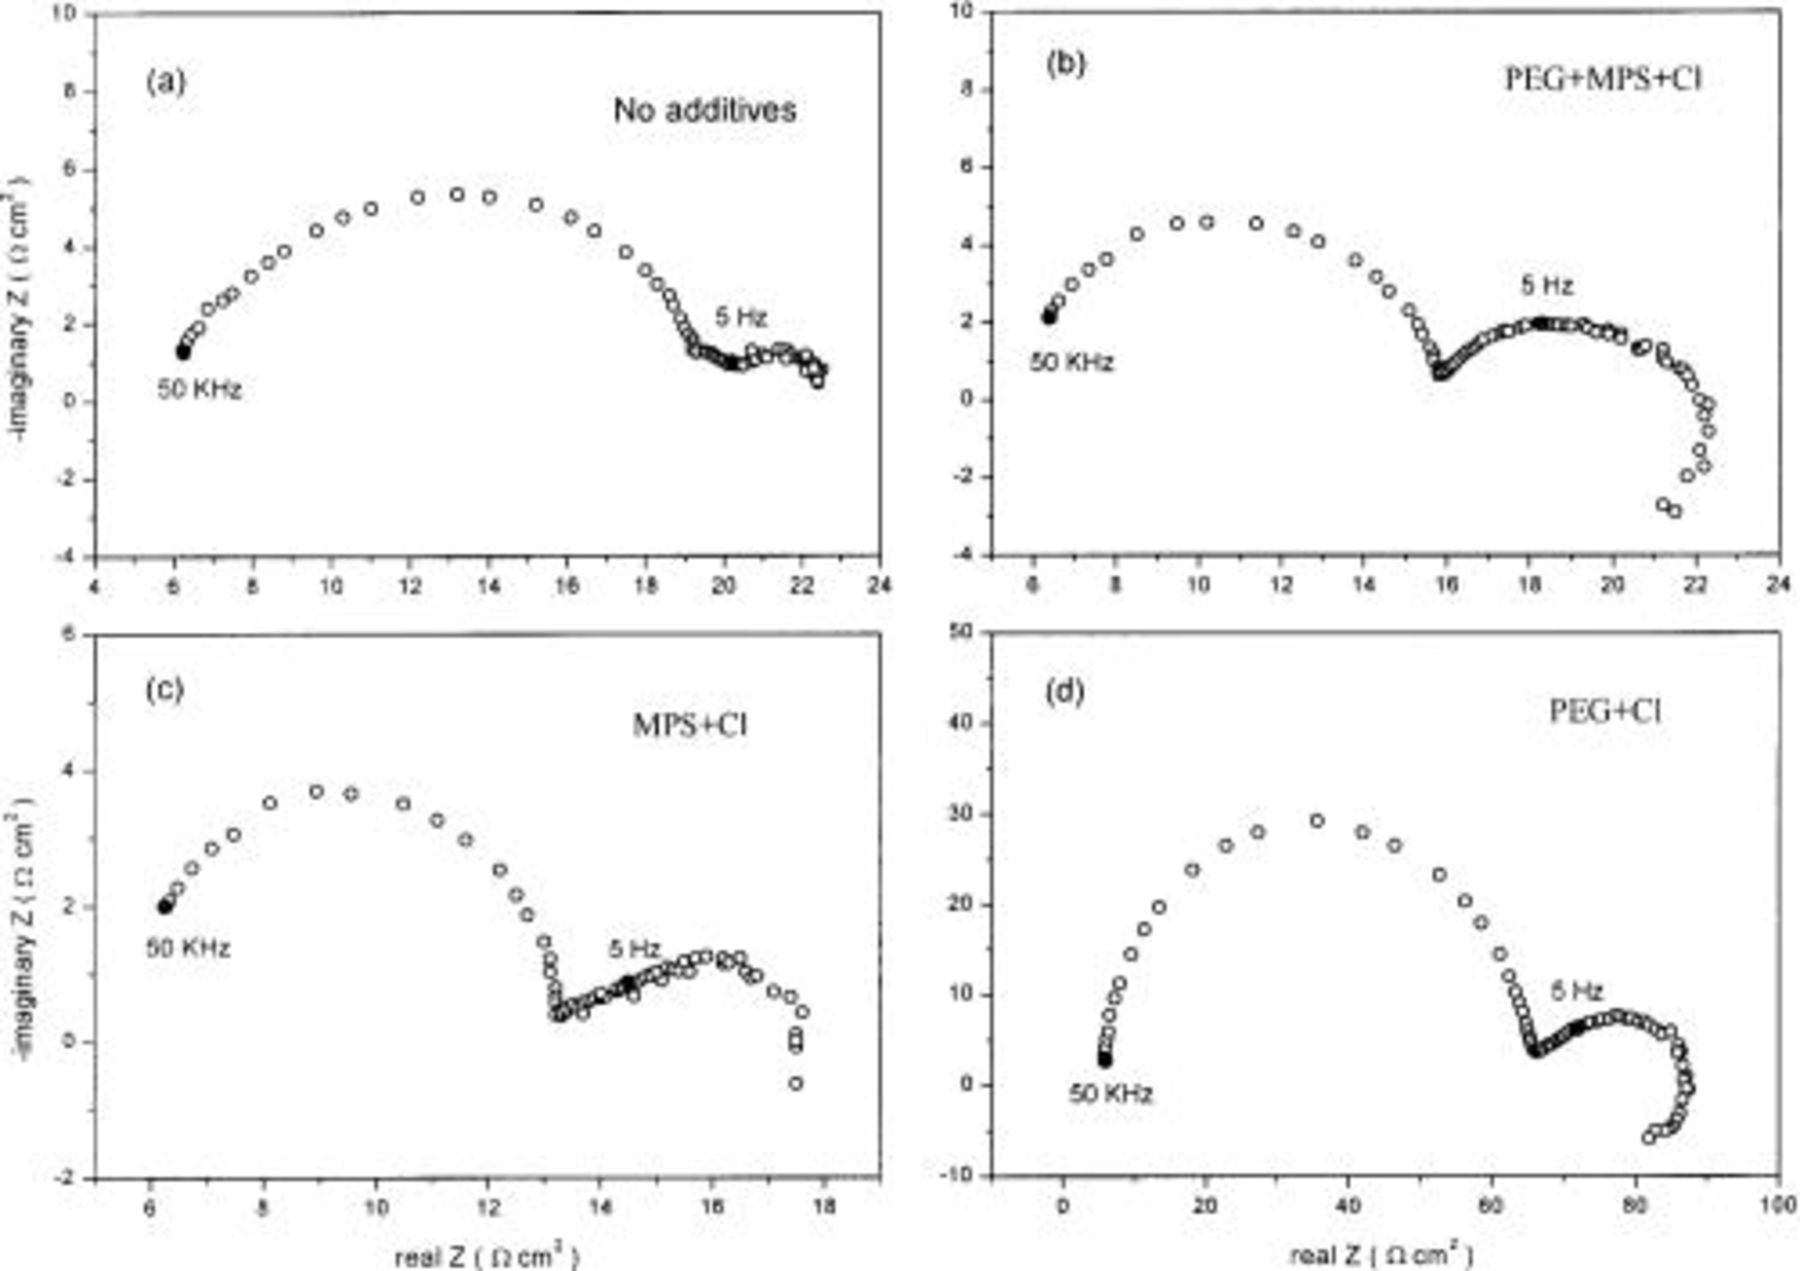
Figure 7. Impedance plane plots measured at cathodic overpotential (−150 mV) at 500 rpm RDE in the baths with various additives. Marked points represent the frequency of PC and PR in PTH process: (a) in the bath without additives, (b) in the bath with  (c) in the bath with
  and (d) in the bath with
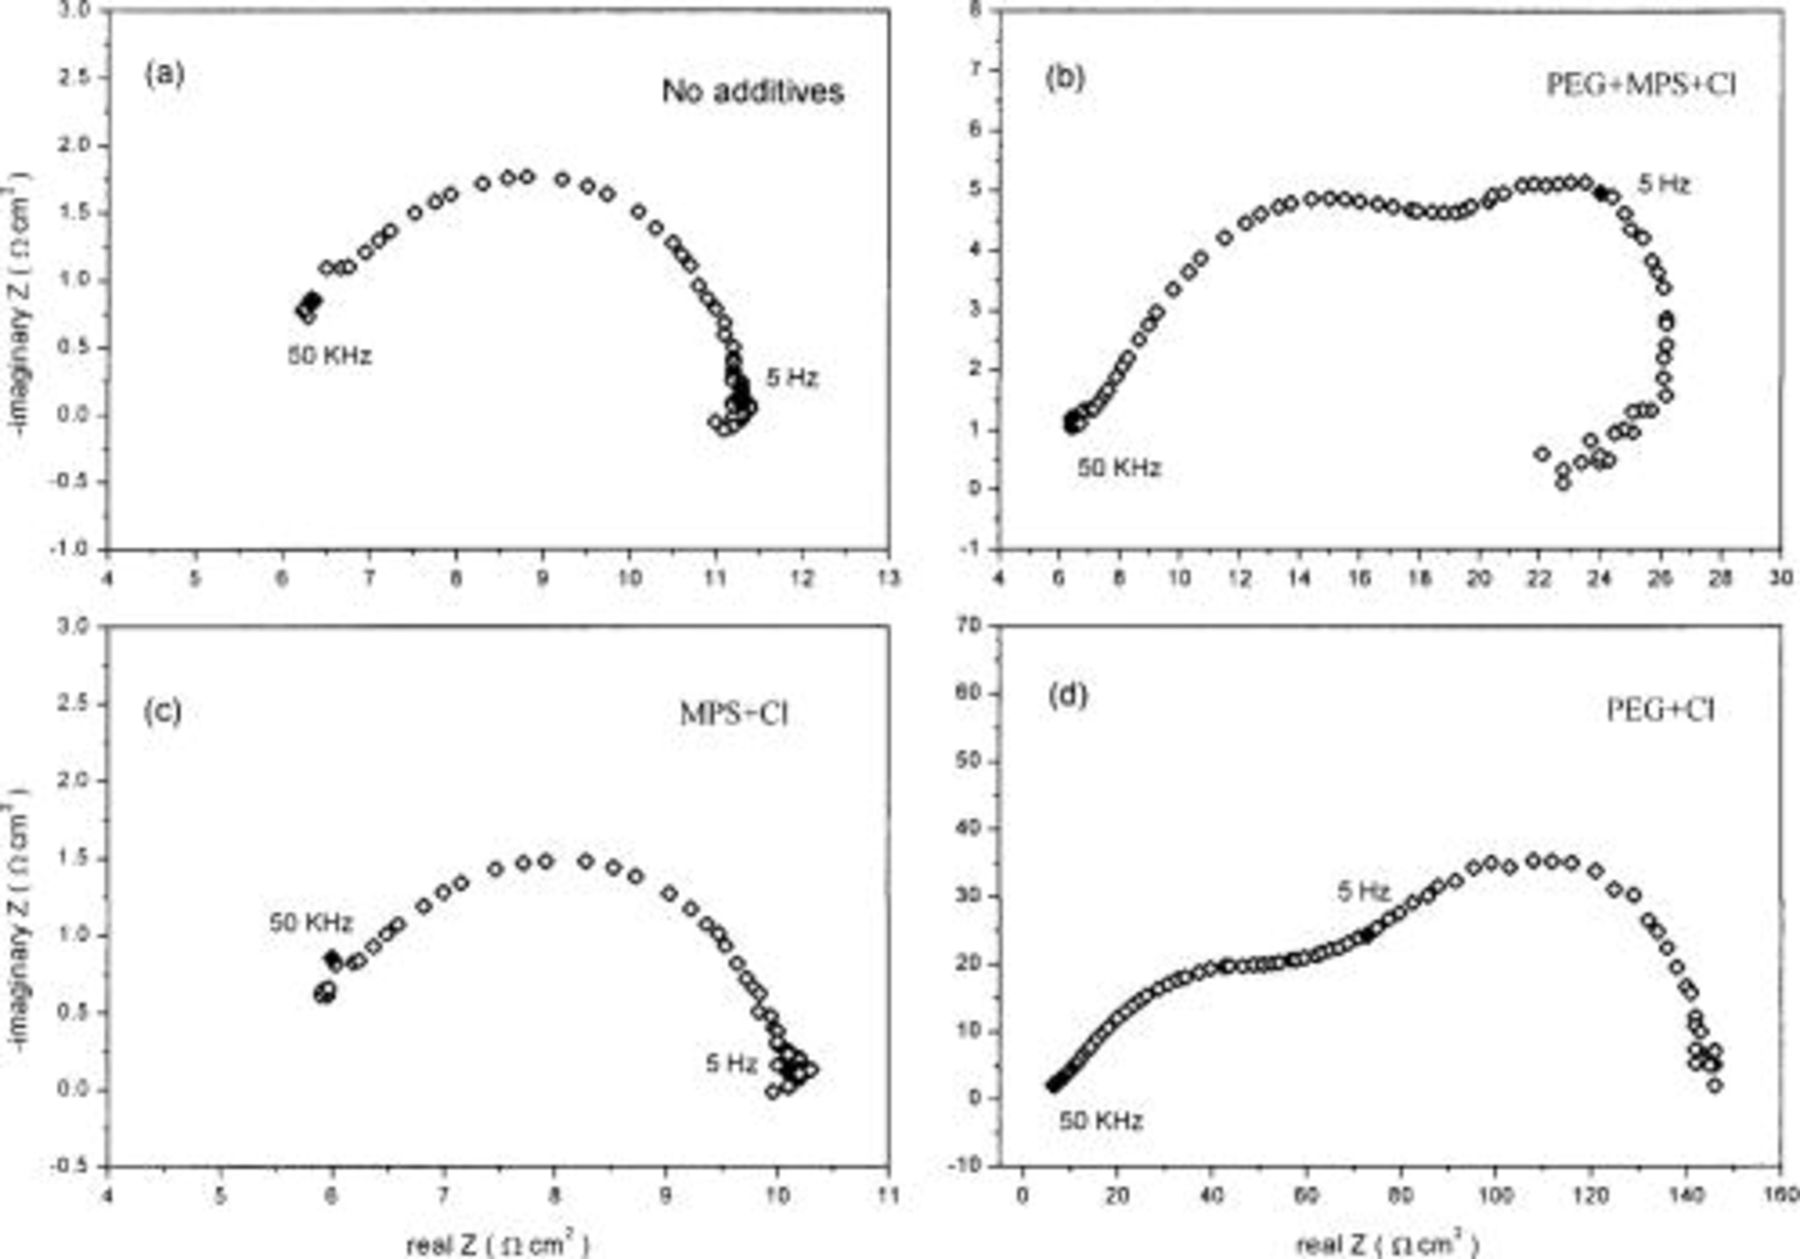
Figure 8. Impedance plane plots measured at anodic overpotential (+75 mV) at 500 rpm RDE in the baths with various additives. Marked points represent the frequency of PC and PR in PTH process: (a) in the bath without additives, (b) in the bath with  (c) in the bath with
  and (d) in the bath with
As for the measurement at anodic overpotential, the result is more complicated as shown in Fig. 8. A small inductive loop is observed at low frequency in the bath without additives (Fig. 8a), which may associate with the nucleation and growth of holes created by the copper dissolution on the metal surface.17 In the bath with  (Fig. 8d), a large and well-resolved second loop is observed while a small inductive loop is observed in the bath with
  (Fig. 8c). In the baths with
  (Fig. 8b), after the second semicircle, an inductive loop is found at very low frequency. Similar to cathodic analysis, the low-frequency region in the baths with
  could be attributed to the transfer of cuprous or cupric ion dissolved from the electrode through the adsorption layer of additives and/or the adsorption of
  ion linked to adsorbed additives on the copper surface.
Discussion
Puippe and Ibl8 observed that the deposit properties obtained with PC at high frequency are similar to those obtained by dc plating. In this study, the uniformities of PC and PR at high frequency at 20 mA/cm2 average current density are better than that of dc at 20 mA/cm2; even better than that of dc at 10 mA/cm2. Holmbom and Jacobsson3 also found that uniformity with high-frequency PC or PR is improved compared with that of dc with the same average current density. They believed that deposition at high frequency during OFF time is independent of the primary current distribution because no external electric field is applied during OFF time, which makes the deposition more uniform than by dc plating at the same current density. However, this explanation cannot account for why the uniformities of PC and PR at high frequency are even better than that of dc plating at 10 mA/cm2, as can be shown by a Wagner number analysis. The Wagner number, assuming Tafel kinetics,18 19 is defined as follows
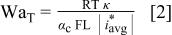
where L is a characteristic length of the system, κ is the specific conductivity of the electrolyte solution, and  is the average current density which is dependent on the primary current distribution. The value of Wagner number is an index of the relative influence of solution conductivity and surface kinetics over deposition distribution. The electrode response at high frequency approaches that of a dc signal due to charging and discharging the double layer as shown in Fig. 9. The current discharging from the double layer is independent of the primary current distribution according to Holmbom and Jacobsson.3 The
  of PC at high frequency is
  cycle, and equal to
  Hence, the Wagner number of PC at high frequency is the same as that of dc at 10 mA/cm2 as other parameters in Eq. 2 should be considered constant. With equal Wagner number, the current distribution of PC at high frequency should predictably be the same as that of dc at 10 mA/cm2. So the unusually uniform deposit of PC and PR at high frequency must result from some other reason.
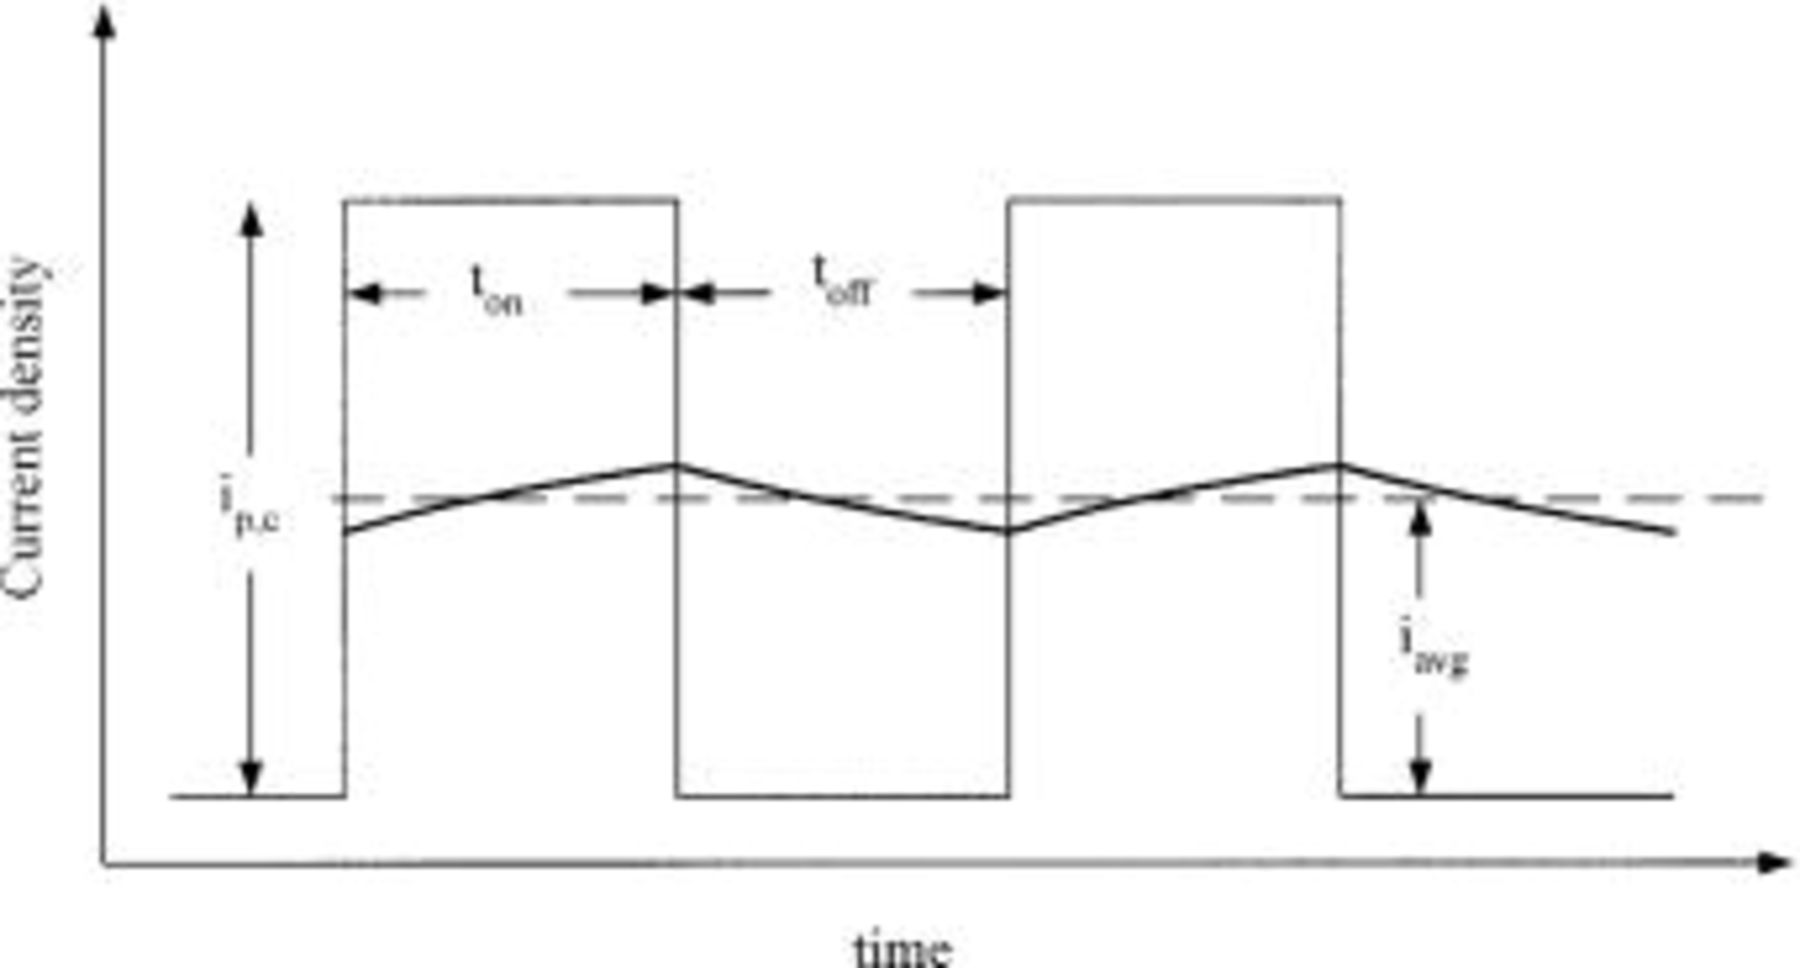
Figure 9. Schematic diagram of PC waveform at high frequency: (⎯) the pulse current, (⎯) the faradaic current affected by charging and discharging the double layer, and (—) the average current density.
Plating at high- and low-frequency PC and PR in additive-free electrolyte.—
For the electrochemical deposition and dissolution of copper, the reaction in the acid sulfate system proceeds in two steps15 17 20
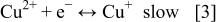
where Reaction 3 is the rate-determining step. The marked points in the impedance plane plot shown in Fig. 7 and 8 depict the frequency response of PC and PR in the PTH process. As shown in Fig. 7a, with low-frequency PC, the plating process corresponds to the poorly resolved portion, implying that the diffusion of cuprous ion or cupric ion is an important step in low-frequency PC plating. As for PR plating, the process corresponds to the poorly resolved region during deposition shown in Fig. 7a and to the small inductive loop during dissolution shown in Fig. 8a, implying the diffusion of cuprous or cupric ion is also important in low-frequency PR plating. With high-frequency PC and PR, the plating is located in the high-frequency semicircle, which corresponds to  implying that the charge-transfer step dominates the overall reaction in high-frequency PC and PR. Plating in high-aspect-ratio PTH easily causes a concentration gradient in the through-hole due to the depletion of cupric ions. When plating is under diffusion control, the deposition depends on the concentration of cupric ion and less uniform deposition is thus obtained. However, if plating is under charge-transfer control, the uniformity improves since the transfer of cuprous or cupric ion is not so important in this case. Hence, the uniformities of high-frequency PC and PR are better than that of low-frequency PC and PC. For the same reason, the uniformities of high-frequency PC and PR are better than that of dc at 10 mA/Cm2, because a concentration gradient can still be developed even at low current density, and the transfer of cuprous or cupric ions is still important for the process with dc. So the key step for uniform plating in PTH is to render the process to fall in the charge-transfer-controlled region.
Plating with high- and low-frequency PC and PR and with additives.—
The consumption of additives must result from either being incorporated into the deposit or being reduced during metal deposition. Pearson and Dennis reported that the consumption of MPS is not detectable.6 Our previous study shows that the incorporation of PEG is very low.21 So the consumption of  is minimal and the surface coverage of the blocking additives is under adsorption control, which can be confirmed by the result of CV. By CV analysis, no hysteresis is observed after the first cycle in the bath with
  The lack of hysteresis is interpreted as the surface chemistry of the three-additives formulation and does not change during deposition and dissolution.
In the presence of additives, the deposition is accelerated and the dissolution is inhibited as shown in the result of LSV. Figures 7(b) and 8(b) depict that the process is controlled by the diffusion of cupric ion through the adsorbed additives when plating with low-frequency PC and PR. However, when plating with high-frequency PC and PR, the reaction rate is controlled by charge transfer between cupric and cuprous ions. Hence, the uniformities of high- and low-frequency PC and PR in the presence of additives are similar to that without additives. However, the improvement of high-frequency PC and PR is not obvious in comparison with additive-free electrolyte as shown in Table I. This can be explained in terms of the adsorption control of additives. The electrode kinetics is strongly affected by the adsorbed additives. Since the plating is under adsorption control, the transfer of cuprous or cupric ion is not as important as the additive-free system. Hence, as shown in Fig. 3 and Table I, the uniformity of low-frequency PC is little improved compared to that of dc at 20 mA/cm2, and the improvement of high-frequency PC and PR is not apparent compared to that of dc at 10 mA/cm2 or low-frequency PC and PR, although the charge-transfer step is still the rate-determining step at high frequency.
Conclusions
Deposition uniformity can be improved with high-frequency PC and PR. The uniformity of high-frequency PC and PR at 20 mA/cm2 average current density is better than that of dc at 10 mA/cm2. From the impedance analysis in additive-free electrolyte, plating at low frequency is controlled by the diffusion of cuprous or cupric ion, while plating at high frequency is controlled by charge transfer. Changing the rate-determining step from diffusion control to charge-transfer control results in an improved metal distribution.
In the presence of  the uniformity with dc at 20 or 10 mA/cm2 is better than that without additives. The trend in the baths with additives using PC and PR plating at high and low frequency is similar to that in the bath without additives. From the LSV results,
  accelerates the deposition of copper and inhibits the dissolution of copper. Additives like PEG, MPS, and
  are developed for the dc process, so their effect on PC or PR processes is not as significant. A new additive system should be developed for PC or PR processes.
National Tsing-Hwa University assisted in meeting the publication costs of this article.