
Abstract
An acid-copper plating bath containing chloride ions, polyethylene glycol (PEG), bis(3-sulfopropyl) disulfide (SPS), and Janus Green B (JGB) has been characterized by electrochemical methods and by fill studies on electrode surfaces patterned with trenches ranging in size from 200 to 600 nm, with aspect ratios between 2 and 4. The electrochemical methods employed include linear sweep voltammetry (LSV), chronoamperometry (CA), and cyclic voltammetric stripping (CVS) on a rotating disk electrode. Comparison of the methods shows that in all the cases an analysis of LSV and CA gives consistent estimates of an effective surface coverage of additives. CVS results are consistent with the other results only in baths that are free of JGB. The ability to produce void-free deposits of a bath containing all of the additives can be understood in part with LSV and CA results. However a very good superfilling can also be obtained from a plating bath containing chloride ions, PEG, SPS, but no JGB. This observation cannot be easily interpreted with measurements within the context of established leveling theories. © 2001 The Electrochemical Society. All rights reserved.
Export citation and abstract BibTeX RIS
Commercial acid-copper plating baths may contain many organic additives. 1 2 3 4 Detailed knowledge of the function of each additive, as well as the interactions between these additives, is lacking despite the advanced state of the technology. The complexity of the bath chemistry, coupled with the incomplete understanding of the mechanisms, makes difficult theoretical predictions of the efficacy of an electrolyte with an arbitrary composition. Industry requires the development of experimental protocols for investigating the influence of composition of perhaps every component of an additive cocktail. The screening method should be fast, reproducible, easy to operate, and with easily interpretable results.
We discuss possible screening methods as applied to an acid-copper electrolyte with chloride ions, polyethylene glycol (PEG), bis(3-sulfopropyl) disulfide (SPS), and Janus Green B (JGB). The leveling capability of submicrometer, patterned trenches by this electrolyte has been reported. 1 2 In this paper, we characterize this system by cyclic voltammetric stripping (CVS), linear sweep voltammetry (LSV), and chronoamperometry (CA) studies on a (nonpatterned) rotating disk electrode (RDE). Additionally, we investigate the influence of current density, additive composition, and the fluid-flow conditions on the superfilling effect. We show that the LSV and CA methods can sometimes provide a consistent explanation for trench filling experiments; in a companion article in this issue, 5 we show the measurements can be interpreted quantitatively to provide thermodynamic, mass transfer, and kinetic parameters for use in shape-change simulations.
Experimental
Fill studies
The pretreatment of the patterned wafer as well as the deposition procedure is described in Ref.
2
. In the present study, copper deposition was carried out under a well-mixed condition, instead of in a stagnant solution. The wafer fragment was placed inside an RDE adapter. The schematic illustration is shown in Fig. 1. The electrical contact between the seed layer (only on the front side of the wafer) and the RDE stainless steel shaft was made by fixing the wafer fragment onto a thin brass plate with a single sided copper conductive adhesive tape (Electron Microscopy Sciences). The resistance of this contact was measured and found to be negligible. A small rubber O-ring was placed between the wafer and the Teflon cap of the RDE adapter in order to maintain a good seal. To test the performance of the RDE assembly, a platinum plate fixed in the adapter was used to measure the limiting current of the  redox couple. A good agreement with a commercial RDE was obtained. The cross section of the copper films was examined by a JEOL 5600 scanning electron microscope (SEM).
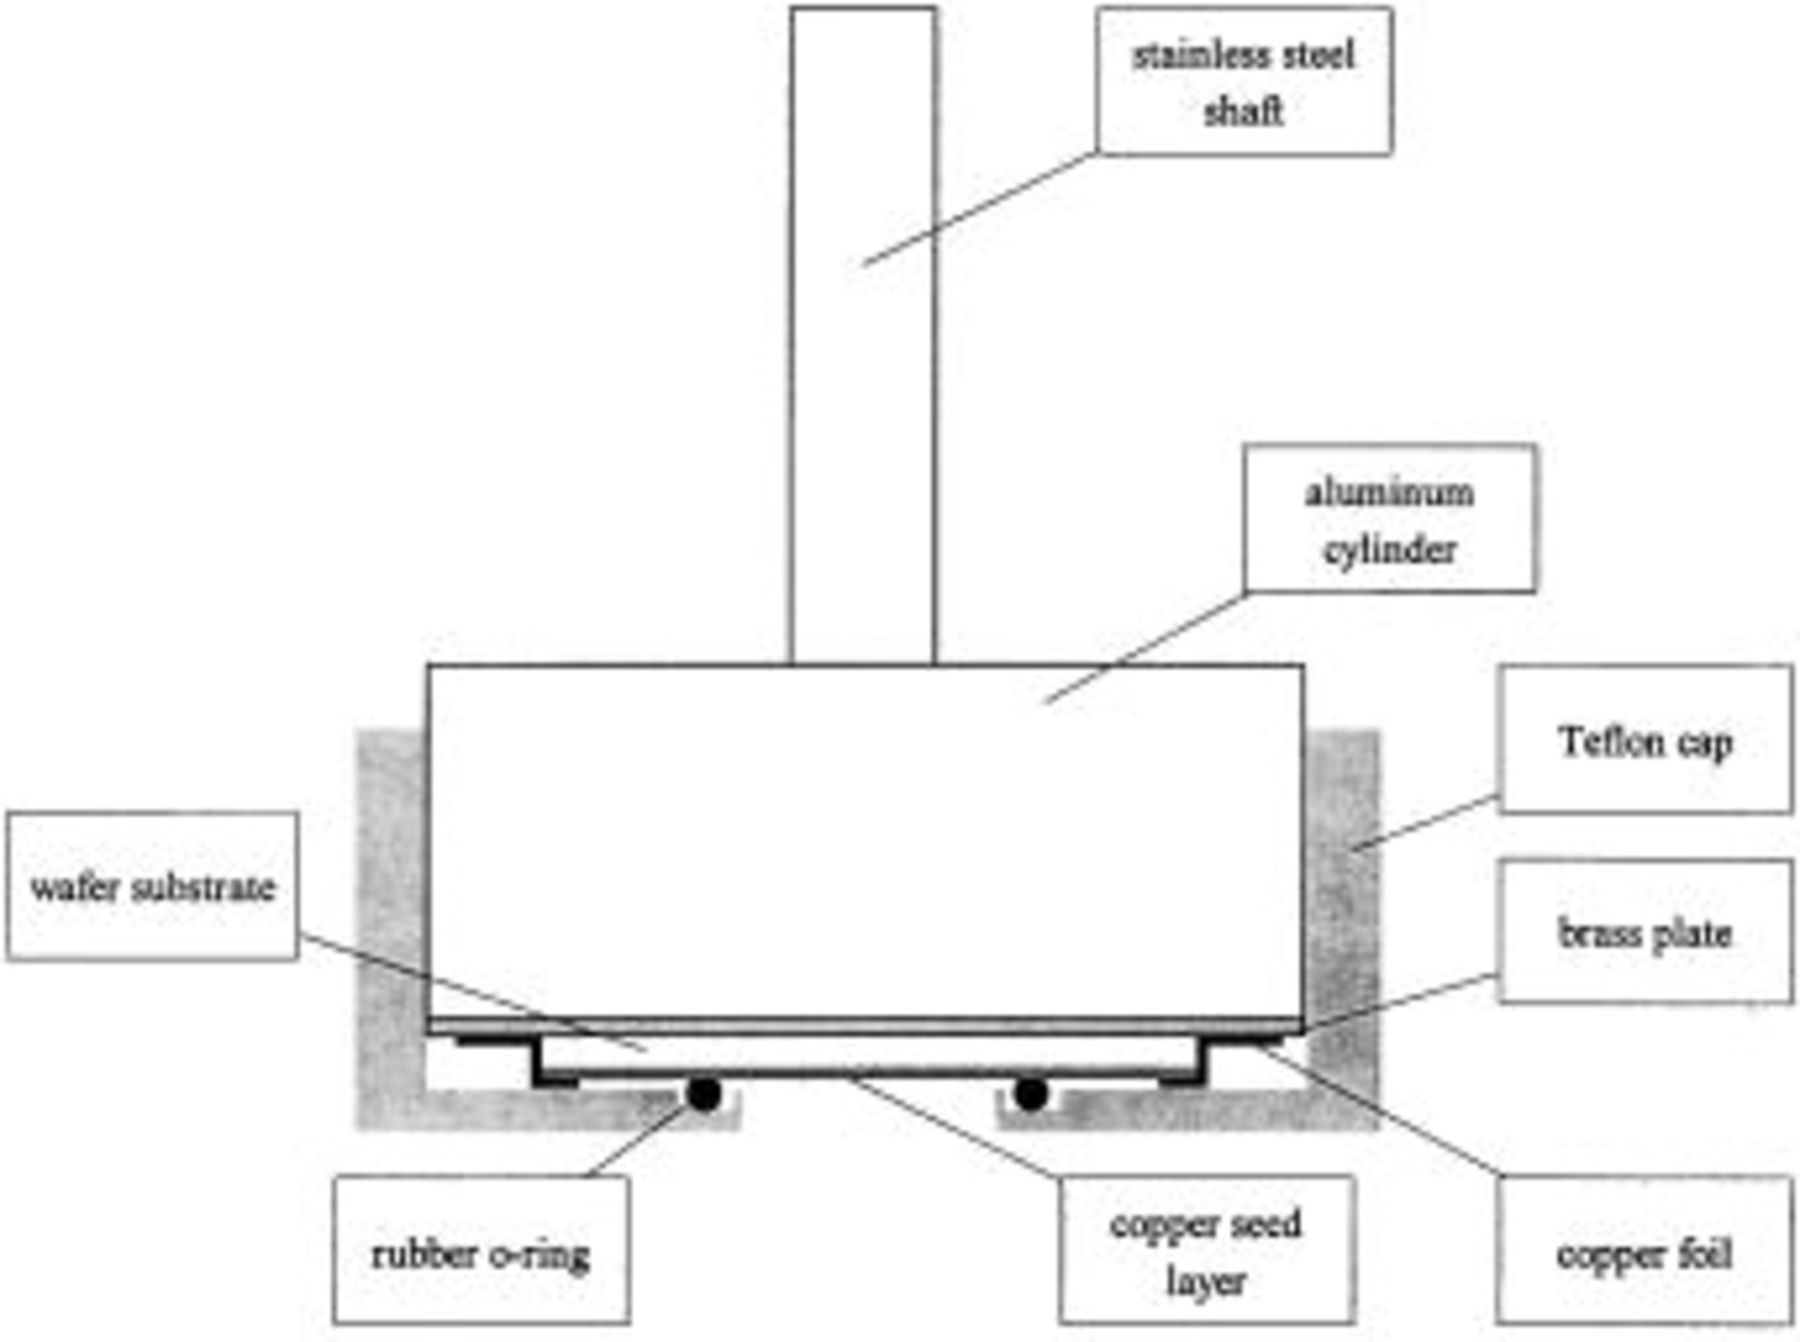
Figure 1. Schematic illustration of the rotating disk electrode adapter utilized for copper deposition onto patterned wafer fragments.
CVS
CVS was developed as a process control tool.
6
7
8
9
Its ubiquity in the industry, as well as the ease-of-use of commercial systems that enable automated adjustment of additive concentration, would make it an ideal tool for additive screening. Initial attention was thus focused on this method. A commercial CVS system interfaced to the Qualiplate QP-4000 software (both by ECI technology) was used for this study. For all the CVS measurements, the scan rate was set to 100 mV/s, with a scan range between −0.225 and 1.575 V vs. Ag/AgCl reference electrode. Prior to each measurement, the working electrode was conditioned in a solution made of 75 g/L  O, 10% of 95 wt %
  by volume, and 50 ppm chloride ion for at least 10 cycles.
LSV
In all polarization experiments, an approximately 500 nm thick copper layer was predeposited onto the Pt RDE, at a constant current density of 10  at 900 rpm for about 150 s. The LSV measurement was carried out immediately after the predeposition at 1 mV/s from approximately 50 mV negative to the open circuit potential (OCP) to
  V vs. mercurous sulfate electrode (MSE). After each polarization measurement, the copper was completely stripped in the same bath. The Pt RDE was taken out of the solution and immersed in concentrated
  for 2 to 5 min followed by a thorough rinse with deionized water (18 MΩ). For each plating bath, the polarization measurements were carried out at several different rotation speeds from 100 to 2500 revolutions per minute (rpm).
CA
The pretreatment of the electrode and copper predeposition process were the same as that employed in the LSV experiments. A constant potential of −0.725 V vs. MSE was employed for all plating baths. Three rotation speeds, 100, 900, and 2500 rpm were used in each experiment. The rotation speed was held constant until the measured current reached a plateau (2 to 5 min, depending on the bath composition). Generally, the CA measurements were independent of the order of the chosen rotation speeds.
The working electrode used for LSV and chronoamperometry experiments was a platinum RDE with surface area 0.2  (Pine Instrument Inc.). The counterelectrode was a 99.99% copper bar (Johnson Mathey). The reference electrode was a commercial
  MSE, which was calibrated by a hydrogen electrode and its potential was
  V vs. saturated hydrogen eletrode (SHE). A PAR270 (EG&G) potentiostat/galvanostat was used for all the copper deposition experiments.
Chemicals
The standard copper sulfate solution was made of 60 g/L  O (Fisher, ACS) and 98 mL/L 95%
  (Fisher, ACS). PEG (Mw 3350) came as powder and was weighed individually and dissolved into the standard copper sulfate solution. Chloride ions were introduced from a 50,000 ppm HCl stock solution. JGB (Aldrich) and SPS (Raschig GmbH, Germany) were first dissolved in deionized water to make a 500 ppm concentrated stock solution. These additives were well mixed 30 min before experiments, and used only within 12 h.
Results of Electrochemical Characterization
LSV
Typical LSV curves for copper deposition from plating baths with various additives are shown in Fig. 2. Compared to the polarization characteristics for copper deposition from the bath containing only chloride ions, the presence of PEG greatly suppresses the deposition of copper. 10 It has also been verified by a CVS study that chloride or PEG individually does not suppress copper deposition.
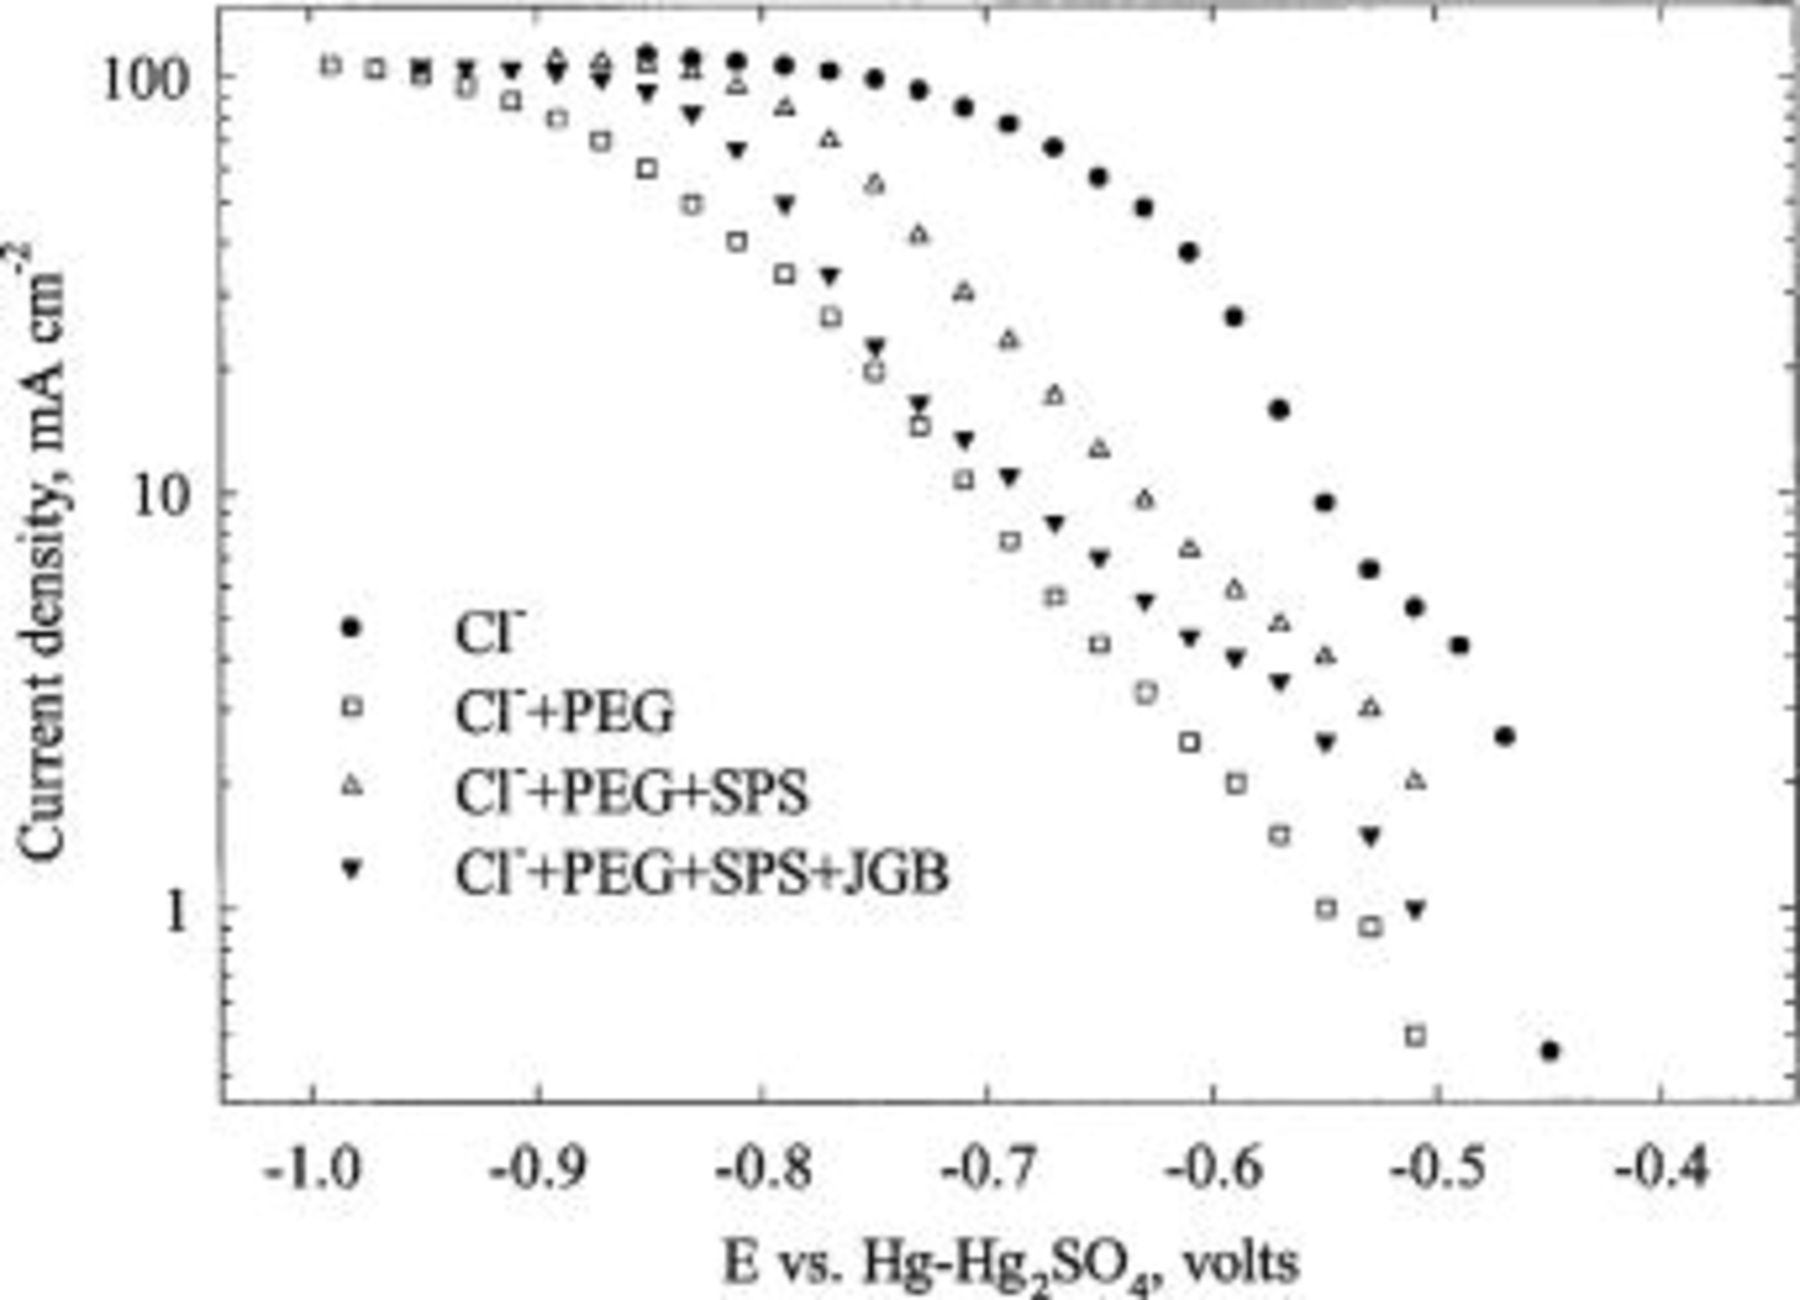
Figure 2. LSV curves obtained at a rotation speed of 400 rpm on a copper-predeposited platinum RDE in the baths with various combinations of additives. All electrolytes contain 0.24 M  and 1.8 M
  . In addition, the curve labeled
  has 50 ppm
  ;
;  50 ppm
  and 300 ppm PEG (Mw 3350);
  : 50 ppm
  , 300 ppm PEG (Mw 3350), and 2 ppm SPS;
  : 50 ppm
  , 300 ppm PEG (Mw 3350), 2 ppm SPS, and 2 ppm JGB.
When chloride, PEG, and SPS are all present, copper deposition is much less inhibited. However, note that (i) copper deposition from a Cl-PEG-SPS electrolyte is inhibited compared to deposition from a Cl-only bath; and (ii) without PEG in the electrolyte, SPS has an insignificant influence on current density.
When all the additives (Cl-PEG-SPS-JGB) are present, the copper deposition rate is suppressed again relative to that from a Cl-PEG-SPS bath. Depending on the concentration of JGB (Fig. 2 shows a result for  ppm), copper deposition can be more or less inhibited than that from the bath containing chloride and PEG only.
Cyclic voltammetric stripping
The influence of PEG on the CVS response is shown in Fig. 3 in the presence of and in the absence of chloride ions. The area under the anodic copper stripping peak of the CVS diagram  is normalized by the area
 under the anodic peak when the PEG concentration is zero. Clearly, PEG does not suppress copper deposition rate when there is no chloride in the bath, and it inhibits copper deposition only when chloride is present.
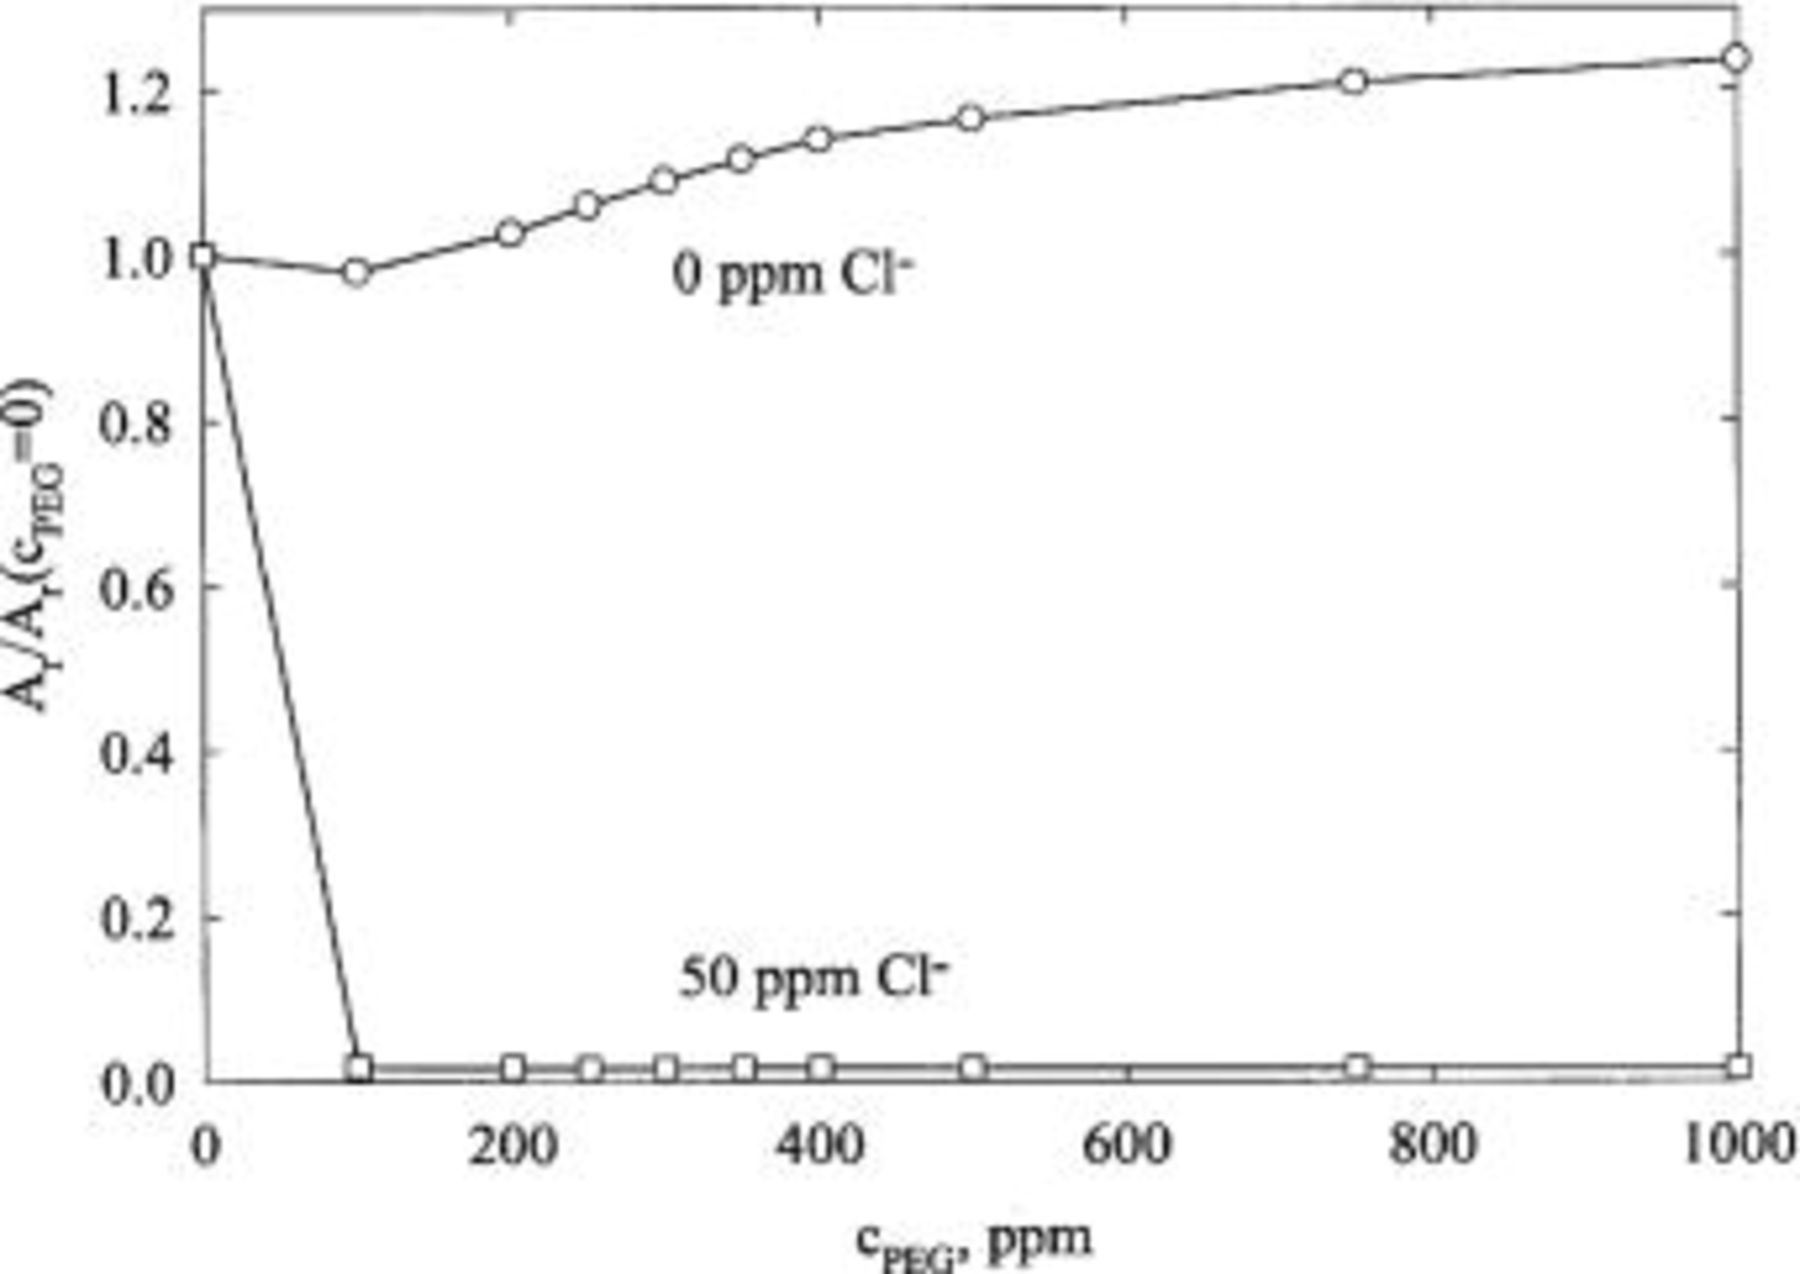
Figure 3. Effect of PEG concentration on the ratio of copper stripping peak area  with and without chloride ions. The electrolyte composition is 0.24 M
  , 1.8 M
  , and either 0 or 50 ppm
  . The rotation speed was 2500 rpm for both cases.
Figure 4 shows the effect of SPS on copper deposition. The deposition rate is enhanced with increasing concentration of SPS and with increasing rotation speed. In Fig. 5, the suppression of copper deposition, as estimated by CVS, is proportional to the concentration of JGB at high concentration, but shows a much weaker dependence at low concentration. This behavior is inconsistent with LSV and CA data, as discussed below.
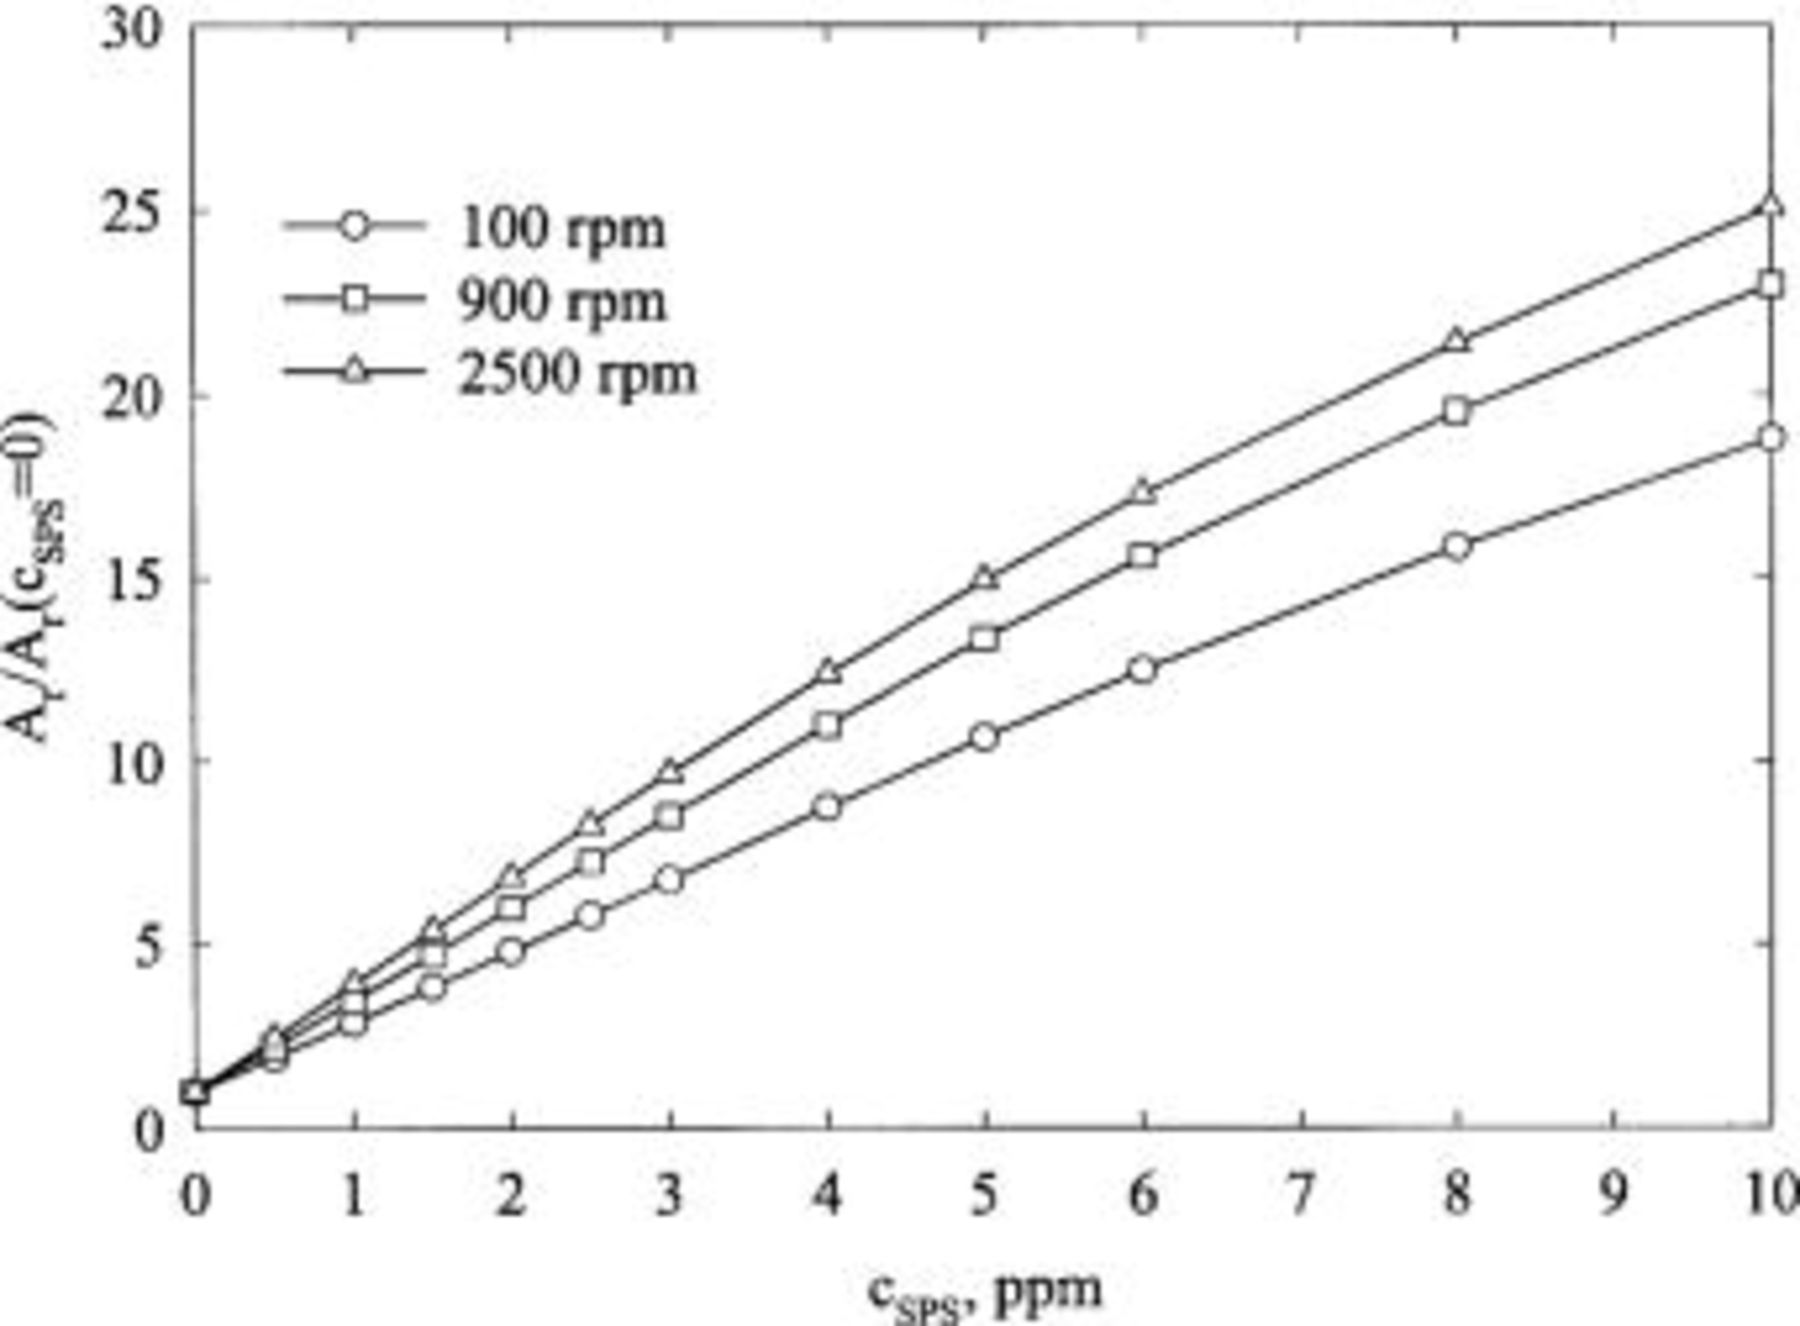
Figure 4. Effect of SPS concentration, as well as rotation speed, on the normalized copper stripping peak area. The base electrolyte composition is 0.24 M  , 1.8 M
  , and 50 ppm
  .
.
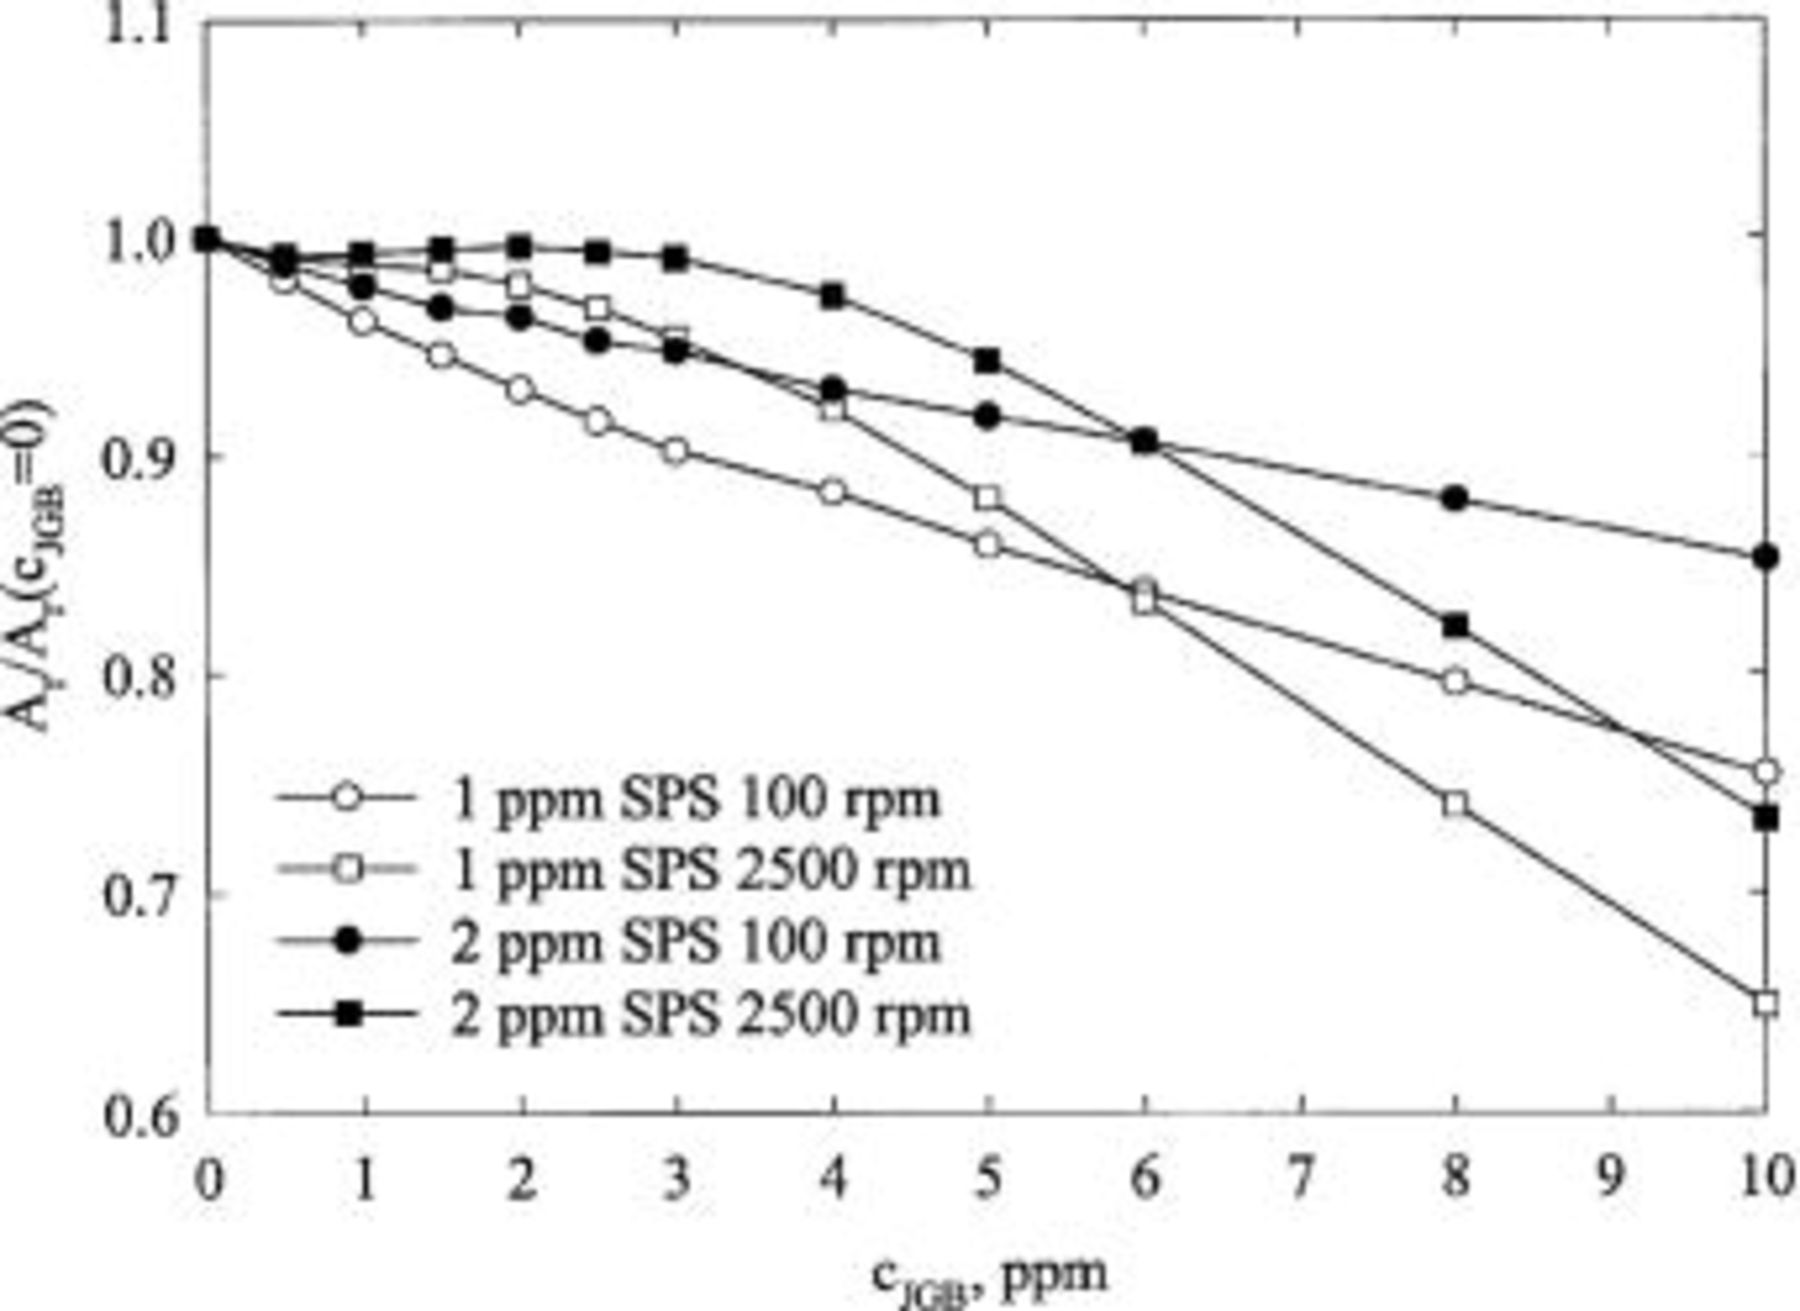
Figure 5. Effect of JGB concentration, as well as rotation speed, on the normalized copper stripping peak area. The base electrolyte composition is 0.24 M  , 1.8 M
  , 300 ppm PEG (Mw 3350), 50 ppm
  and SPS, whose concentration is indicated in the figure.
Chronoamperometry.—Figure 6 shows the dependence of the copper deposition rates from electrolytes containing Cl-PEG-SPS and Cl-PEG-SPS-JGB on the disk rotation speed. Apparently the acceleration by SPS and the inhibition by JGB both depend on the rotation speed, i.e., the rates at which the additives are brought to the electrode. The impact of rotation speed on deposition rate indicates that it is necessary to account for variations of both SPS and JGB concentrations inside the features.
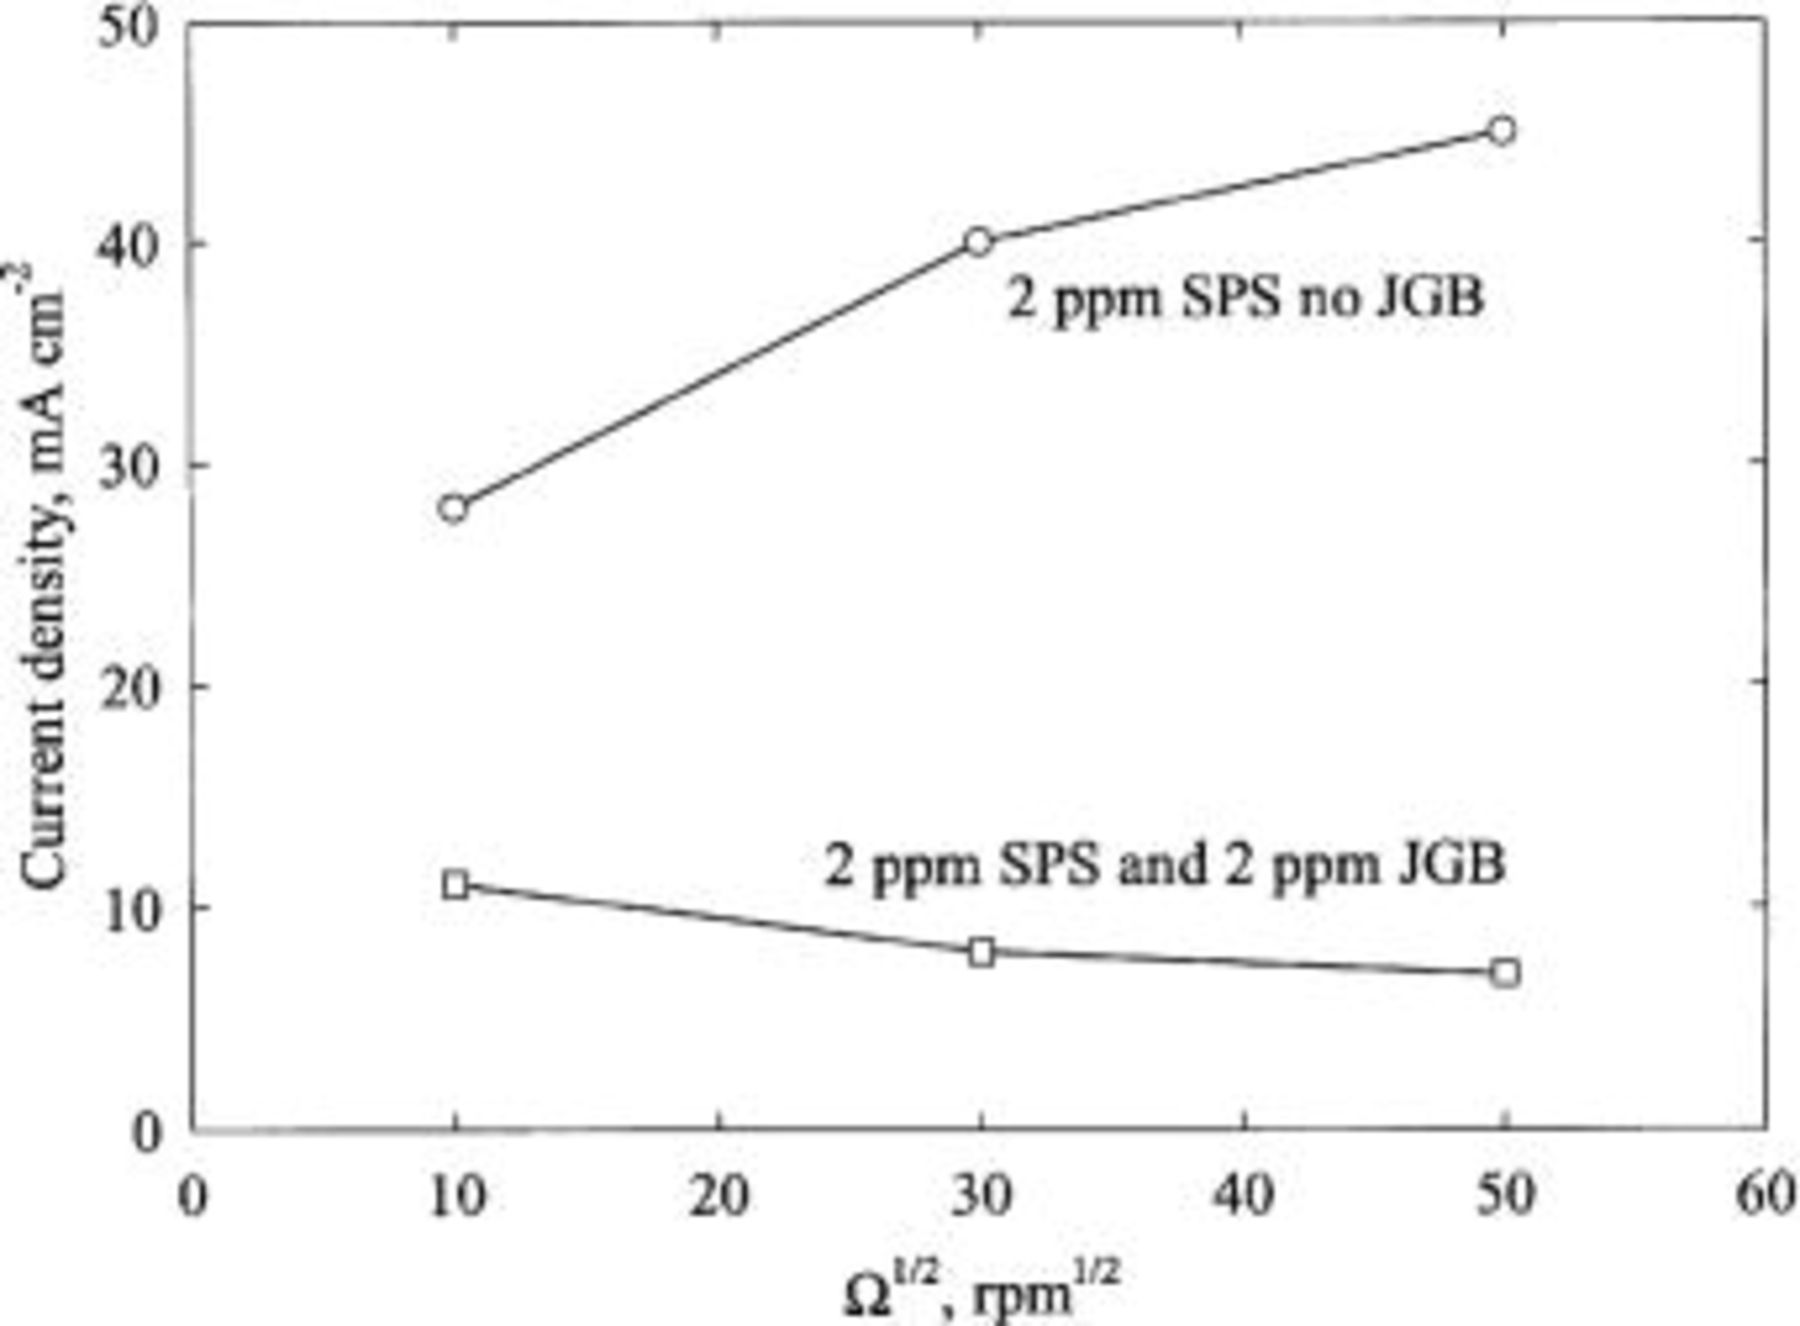
Figure 6. Effect of the rotation speed on deposition rate. In addition to the concentrations of SPS and JGB indicated in the figure, the base electrolyte is 0.24 M  , 1.8 M
  , 300 ppm PEG (Mw 3350), and 50 ppm
  .
.
Results of Fill Studies
The wafer fragments used in the present study contain an array of trench sizes and aspect ratios. The dimensions and spacing of the trenches, as measured by SEM cross sections, used for the fill study are summarized in Table I. We have carried out copper damascene pattern plating on wafers supplied by two manufacturers. With one wafer (type A), a large variation in the filling capability of apparently identical features is seen. 2 We tentatively attribute such behavior to the degradation of the seed layers when it is exposed to air for a long time. The present study indeed confirms that reported 80-90 percent for PEG-Cl-SPS-JGB are closer to 100% with type B wafers. However, type A wafers filling percentages less than 30% remain low on type B wafers. For the second wafer supply, feature-to-feature consistency was excellent, and we can less ambiguously state that voids are present or not. Nevertheless, in these wafers, there are two types of observed voids. One type can be described as an elongated, ellipsoidal void that is centered inside the trench (see Fig. 7). The other is a void, which is fairly randomly but preferentially distributed next to the feature walls. We interpret the first type of void as being related to suboptimal electrolyte composition. The second type of void is assumed to be related to seed layer defects and were not considered in the analysis.
Table I.
| Characteristic dimensions of the trenches used for the fill study. The aspect ratio represents the ratio of the trench height (from the top of the exterior seed layer to the top of the bottom seed layer) to the average width (measured from the tops of the sidewall seed layers). | ||||||||
|---|---|---|---|---|---|---|---|---|
| Wafer type | Width (including seed layer) (nm) | Height (nm) | Seed layer thickness (nm) | Trench-to-trench spacing (nm) | Aspect ratio | |||
| Bottom | Mouth | Bottom | Sidewall | |||||
| Type A | Feature 1 | 380 | 630 | 830-880 | 100 | 50-80 | 720 | 2 |
| Feature 2 | 280-300 | 300-380 | 830-880 | 80 | 50 | 670-1050 | 4 | |
| Type B | Feature 1 | 400 | 510-530 | 700 | 30 | 15-20 | 150 | 2 |
| Feature 2 | 240 | 310-330 | 700 | 30 | 15-20 | 190 | 3 | |
| Feature 3 | 190 | 210 | 700 | 30 | 10-15 | 220 | 3.5 | |
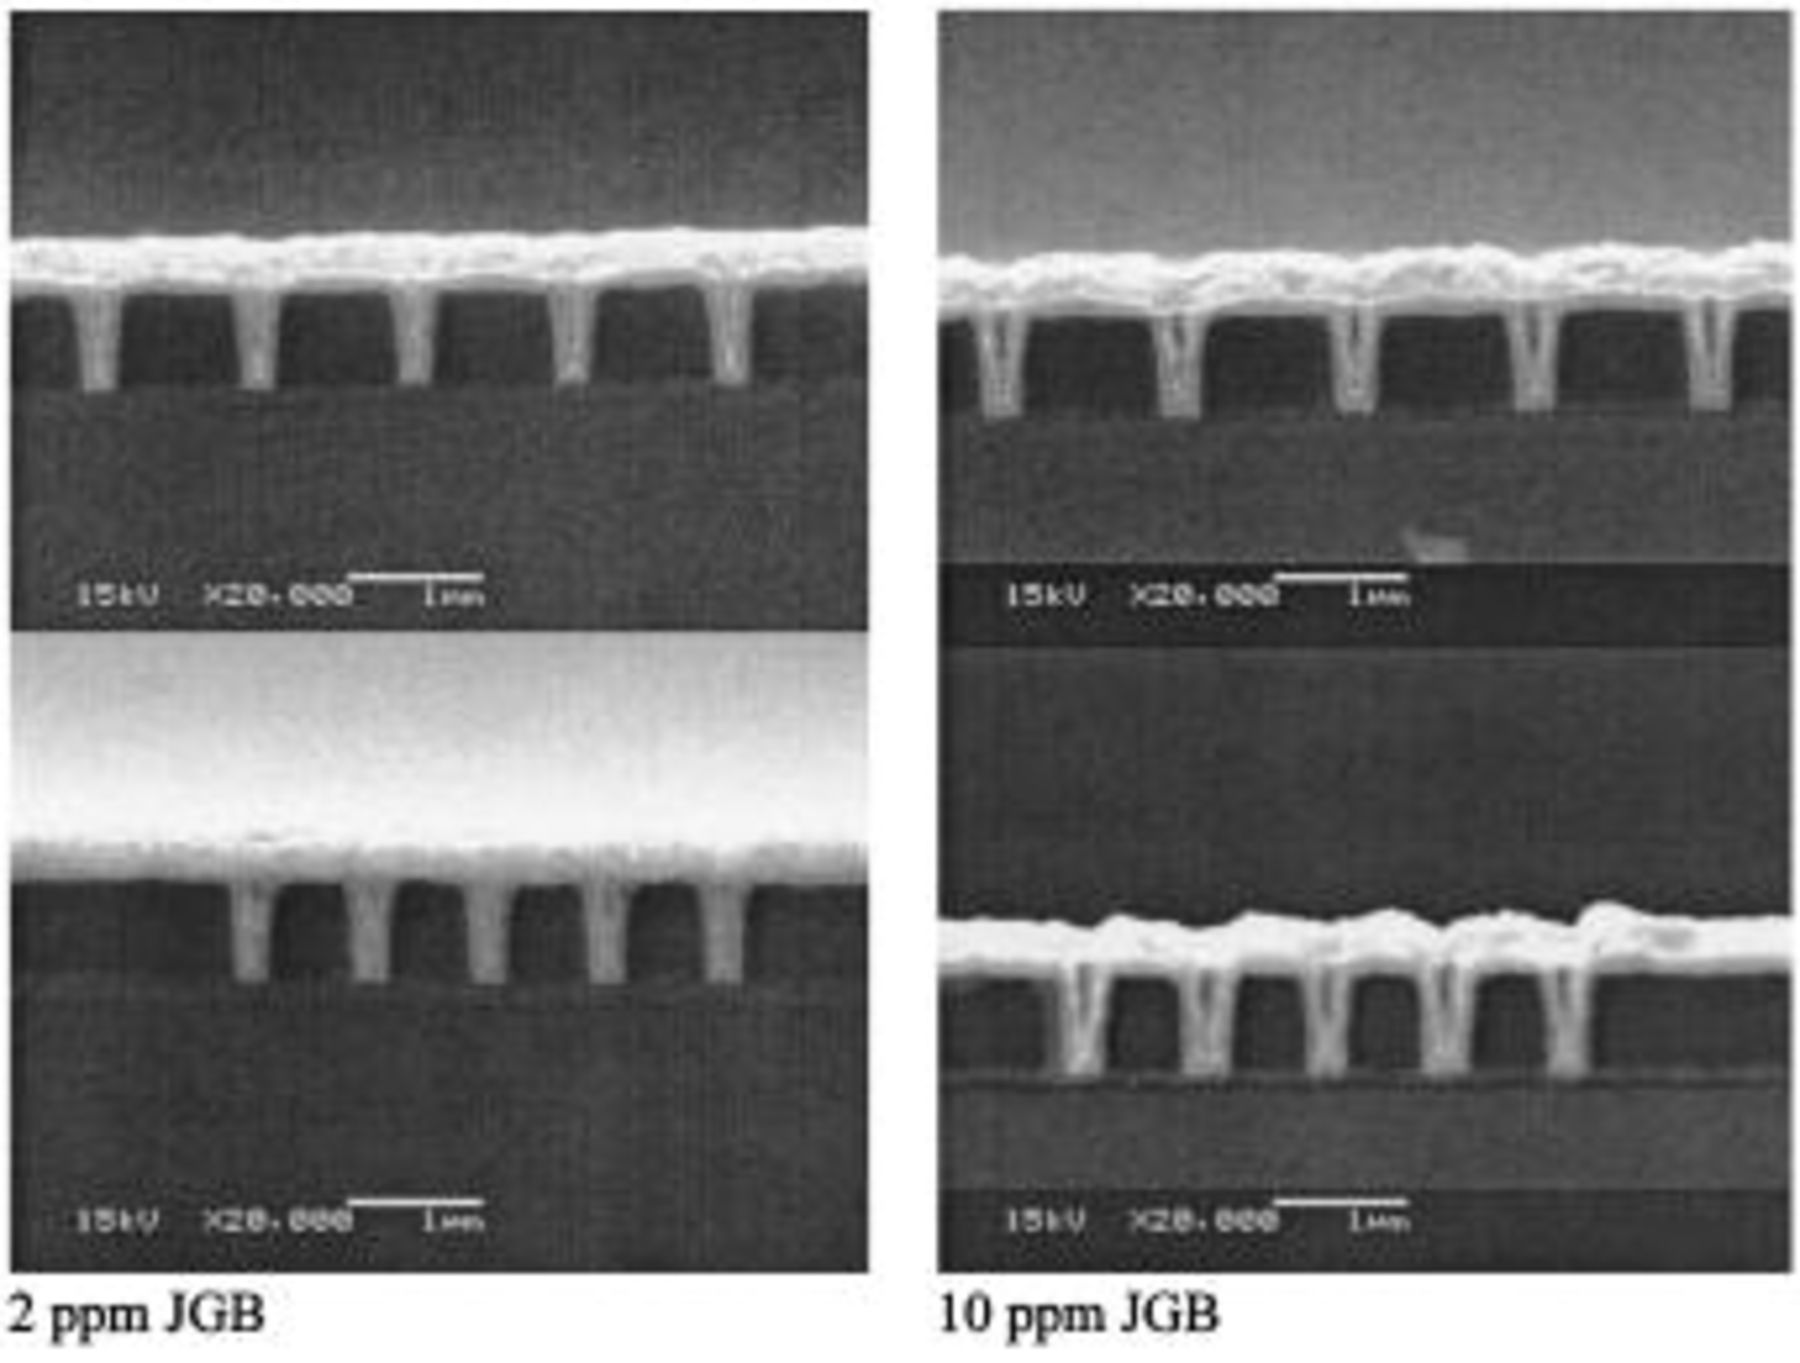
Figure 7. SEM cross sections of trenches deposited in the presence of different levels of JGB. The two pictures on the left are for  ppm, and the two on the right are for
  ppm. The base electrolyte composition is 0.24 M
  , 1.8 M
  , 300 ppm PEG (Mw 3350), 50 ppm
  and 2 ppm SPS. The rotation speed was 200 rpm and the current density was 10 mA
  .
.
The results of copper filling studies on damascene patterned wafer are summarized in Table II. In Table II, fill results labeled as excellent imply that all observed trenches are free of symmetrically centered voids, poor implies that nearly all observed trenches of this type contain symmetric voids, and good implies that between 60 and 90% of the trenches are void-free. A rating of good in the fill results is only seen with type A wafers.
Table II.
| Results of copper fill on patterned wafer fragments. | ||||||||
|---|---|---|---|---|---|---|---|---|
 (ppm) (ppm) |
 (ppm) (ppm) | Current density (A 
| Rotation speed (rpm) | A(1) | A(2) | B(1) | B(2) | B(3) |
| 1 | 1 | 0.010 | 200 | excellent | good | excellent | excellent | excellent |
| 1 | 2 | 0.010 | 200 | excellent | good | |||
| 1 | 5 | 0.010 | 200 | poor | poor | |||
| 1 | 10 | 0.010 | 200 | poor | poor | |||
| 2 | 2 | 0.010 | 200 | excellent | good | excellent | excellent | excellent |
| 2 | 3 | 0.010 | 200 | excellent | good | |||
| 2 | 10 | 0.010 | 200 | poor | poor | |||
| 4 | 5 | 0.010 | 200 | poor | poor | poor | ||
| 9 | 5 | 0.010 | 200 | excellent | excellent | excellent | ||
| 1 | 1 | 0.005 | 200 | excellent | good | |||
| 1 | 1 | 0.010 | 200 | excellent | good | |||
| 1 | 1 | 0.015 | 200 | excellent | good | |||
| 1 | 1 | 0.020 | 200 | excellent | good | |||
| 1 | 1 | 0.010 | 2000 | excellent | good | |||
| 2 | 2 | 0.010 | 2000 | good | poor | |||
| 2 | 0 | 0.010 | 200 | excellent | excellent | excellent | ||
| 4 | 0 | 0.010 | 200 | excellent | excellent | excellent | ||
| 9 | 0 | 0.010 | 200 | excellent | excellent | excellent | ||
Concentration of JGB
The concentration of JGB has a strong impact on the process's ability to produce void-free copper films. The SEM cross sections in Fig. 7 show results of four fill studies obtained with all experimental conditions, except for the concentration of JGB, they are identical. The superfilling capacity of the bath decreases dramatically at high concentrations of JGB. However, at low concentrations of JGB, good filling is obtained. These trends are consistent with a theoretical prediction, 11 and can be anticipated from an interpretation of the LSV and CA measurements.
Effect of SPS
The level of SPS in the electrolyte also has an important influence on the process. For example, when  ppm, voids are observed when
  ppm. However, at
  ppm, void-free deposits result at
  ppm. In short, the optimal range of
  is affected by the
  value used. It is interesting that, in the bath containing only Cl-PEG-SPS, void-free deposits are observed, especially for small features. However, for larger features, a fairly conformal filling is observed, where the deposition rate at the bottom of the trench is the same as the rate at the top. Bump formation above the original feature mouth is also observed only when the deposition is performed in the Cl-PEG-SPS solution with no JGB.
The mechanism of superfilling in baths that are free of JGB is not well understood at this moment. Several conjectures have been proposed. 12 13 14 15 Nevertheless, superfilling by accelerator alone cannot be explained under the framework of established leveling theories, which require that deposition rate (at a constant applied potential) in a leveling bath should decrease as the rotation speed of an RDE increases. 11 16 17 Figure 6 demonstrates that the opposite trend is observed.
Fluid flow
The filling of copper into submicrometer features with rotation at 200 and 2000 rpm was compared to that without rotation for the case of  ppm,
ppm,  ppm, and
  ppm,
ppm,  ppm. Results in a stagnant electrolyte are shown in Ref.
2
. At a current density of 10 mA
ppm. Results in a stagnant electrolyte are shown in Ref.
2
. At a current density of 10 mA  , there were few quantitative differences in filling capability for these three mixing conditions. The one observed difference is for
  ppm,
ppm,  ppm at rotation speeds of 200 and 2000 rpm, which indicate a slight deterioration in filling capability at the higher rotation speed. This possibly counterintuitive result is predicted by numerical simulations.
5
Even though differences are seen for this one case, we should emphasize that the influence of flow for these two electrolyte compositions is relatively weak.
ppm at rotation speeds of 200 and 2000 rpm, which indicate a slight deterioration in filling capability at the higher rotation speed. This possibly counterintuitive result is predicted by numerical simulations.
5
Even though differences are seen for this one case, we should emphasize that the influence of flow for these two electrolyte compositions is relatively weak.
Current density
It is found that the filling efficiency of a bath is reduced at a current density of 20 mA  and a rotation speed of 200 rpm. Filling results, however, were not found to depend on deposition rate in the range from 5 to 15 mA
  when
when  ppm and
  ppm. However, only for
  mA
mA  was the influence of additive composition systematically varied.
Discussion
It has been hypothesized that the additives inhibit copper deposition by blocking the electrode surface.
11
16
17
If this is true, the surface coverage of the additives can be estimated by the ratio of the current density in the presence of additives to current density measured without any additives. Consistent with this hypothesis, if the current density in the bath, which contains no organic additives, but does contain 50 ppm  , is written as
the deposition rate in the presence of additives is
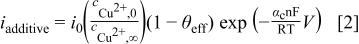
where the ratio of surface-to-bulk concentration of cupric ions can be estimated by the fraction of the limiting current at which one is operating
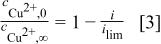
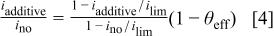
Combining Eq. 1, 2, and 3 gives the effective surface coverage of the additives
The diffusion coefficient of cupric ions in a copper sulfate bath by limiting-current measurement is around 

 . This value was used in the Levich equation to estimate
  as a function of rotation speed,
Equation 4 can be directly applied to LSV or CA data. Application of Eq. 4 to CVS data can be made if the ratio of current densities is assumed to be equal to the ratio of stripping areas. This assumption yields consistent results when applied to a PEG-Cl-SPS electrolyte but not when applied to the complete PEG-Cl-SPS-JGB electrolyte.
PEG
Figure 8 shows the estimate of the effective surface coverage obtained by LSV as a function of electrode potential. The apparent coverage remains relatively constant in a fairly wide range of potential and nearly independent of the electrode rotation speed. The average value of the surface coverage of PEG is around 97%, which is in good agreement with Kelly and West's results 16 and the CVS measurements (Fig. 3). The relative independence of the surface coverage of PEG on the electrode potential and the disk rotation speed may imply that the PEG consumption on the electrode is negligible. This is consistent with the experimental observation by Moffat, who found that copper film deposited from electrolytes containing no additives and Cl-PEG showed identical resistance/time behavior. 12

Figure 8. The effective surface coverage of PEG during copper deposition as a function of the electrode potential calculated from the LSV measurements according to Eq. 4 for three rotation speeds.
SPS
Figure 9 shows the effective surface coverage obtained from Eq. 4 when both PEG and SPS are present. Generally, the presence of SPS lowers the effective surface coverage. A plateau from −0.60 V to −0.75 V vs. MSE is observed at low concentrations of SPS. The effective surface coverage plotted vs. SPS concentration for various rotation speeds is shown in Fig. 10 for an electrode potential of −0.725 V vs. MSE. This potential was chosen to correlate data, as it is representative of the measured potential during galvanostatic deposition onto patterned wafer (see Fig. 2). The effective coverage, as obtained from CVS, can be estimated from Fig. 4. However, limiting current corrections are not made in these data. Thus a quantitative comparison is best at the highest rotation speed. For this curve, the interpretation of the CVS data is consistent with LSV results.
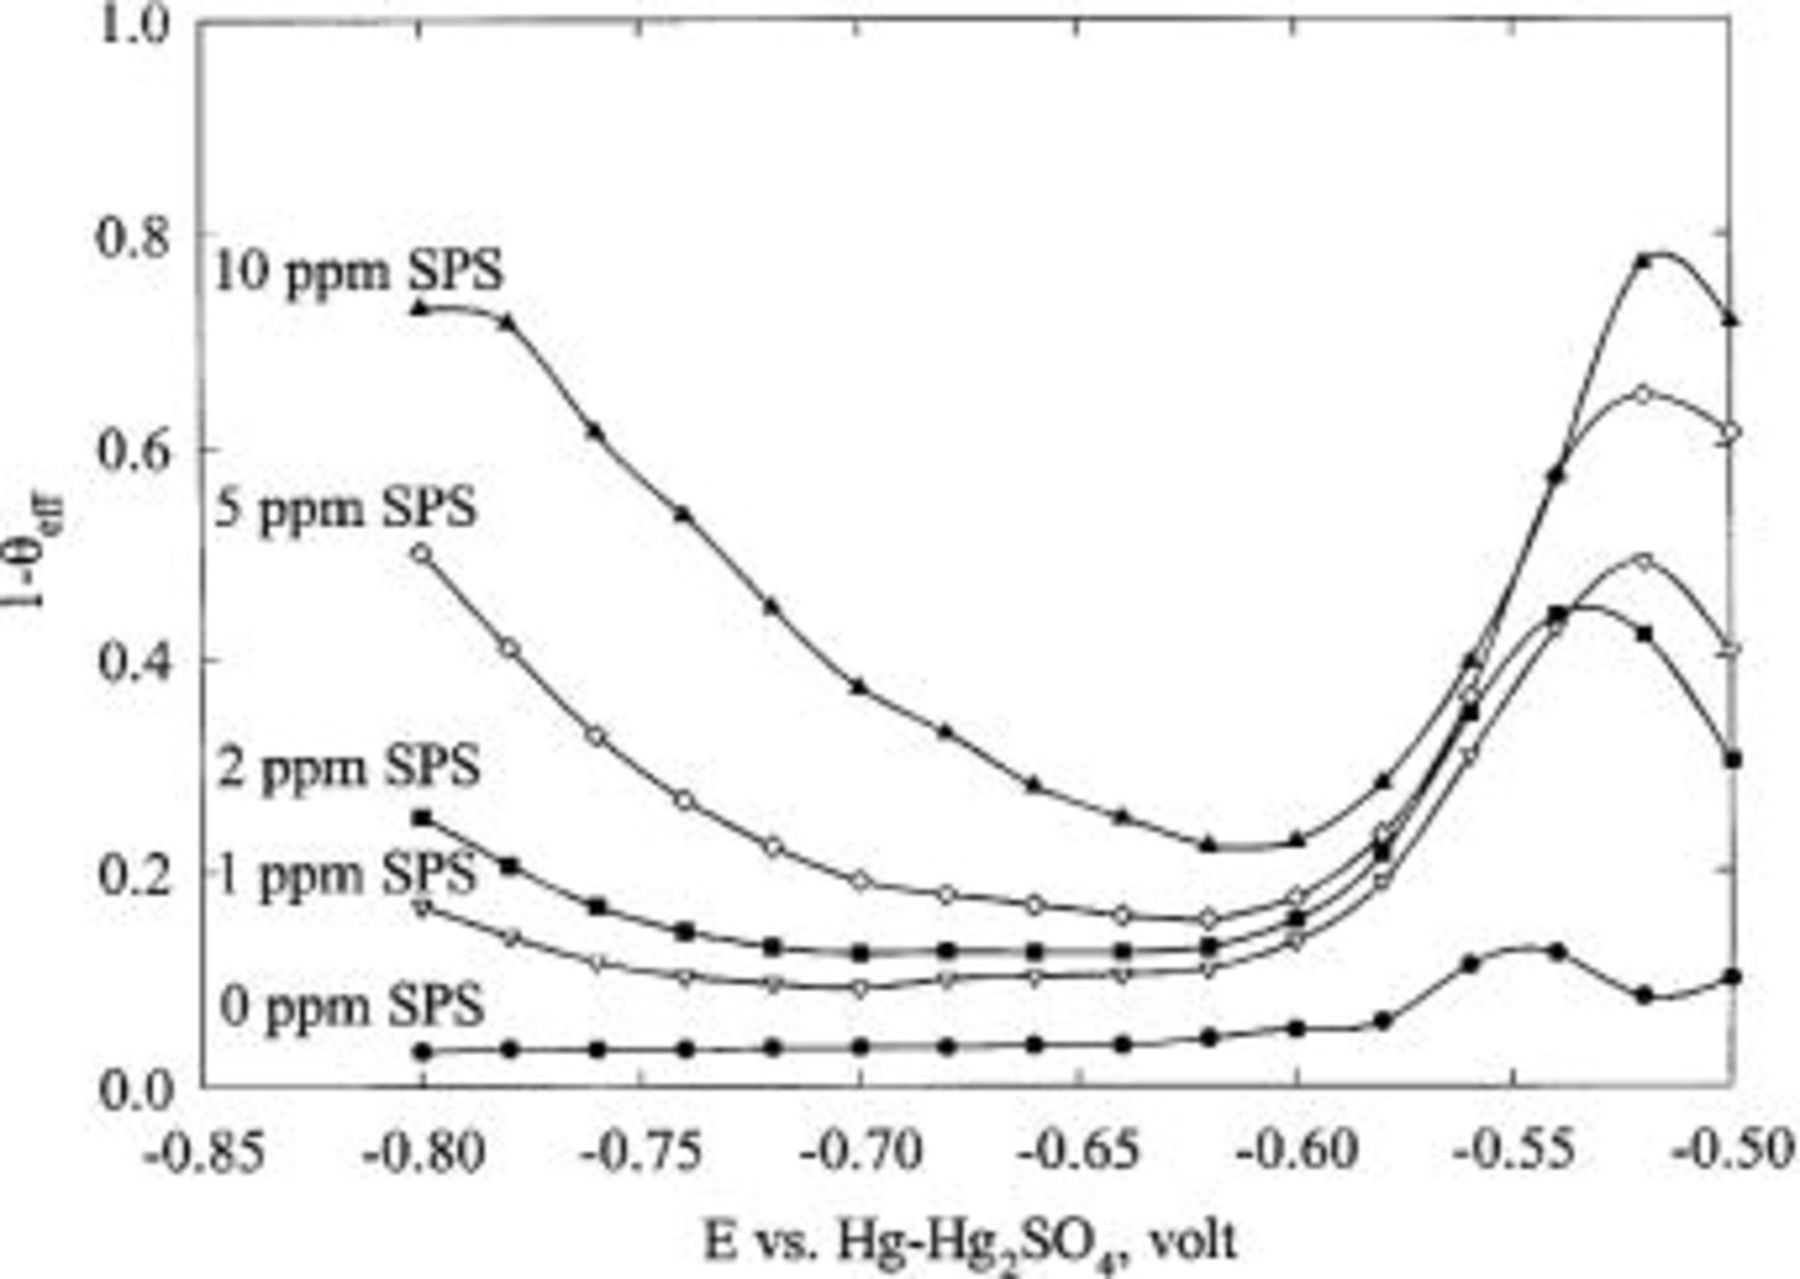
Figure 9. The effect of SPS concentration on the effective surface coverage. The base electrolyte is 0.24 M  , 1.8 M
  , 300 ppm PEG (Mw 3350), and 50 ppm
  . The rotation speed was 2500 rpm in all cases.
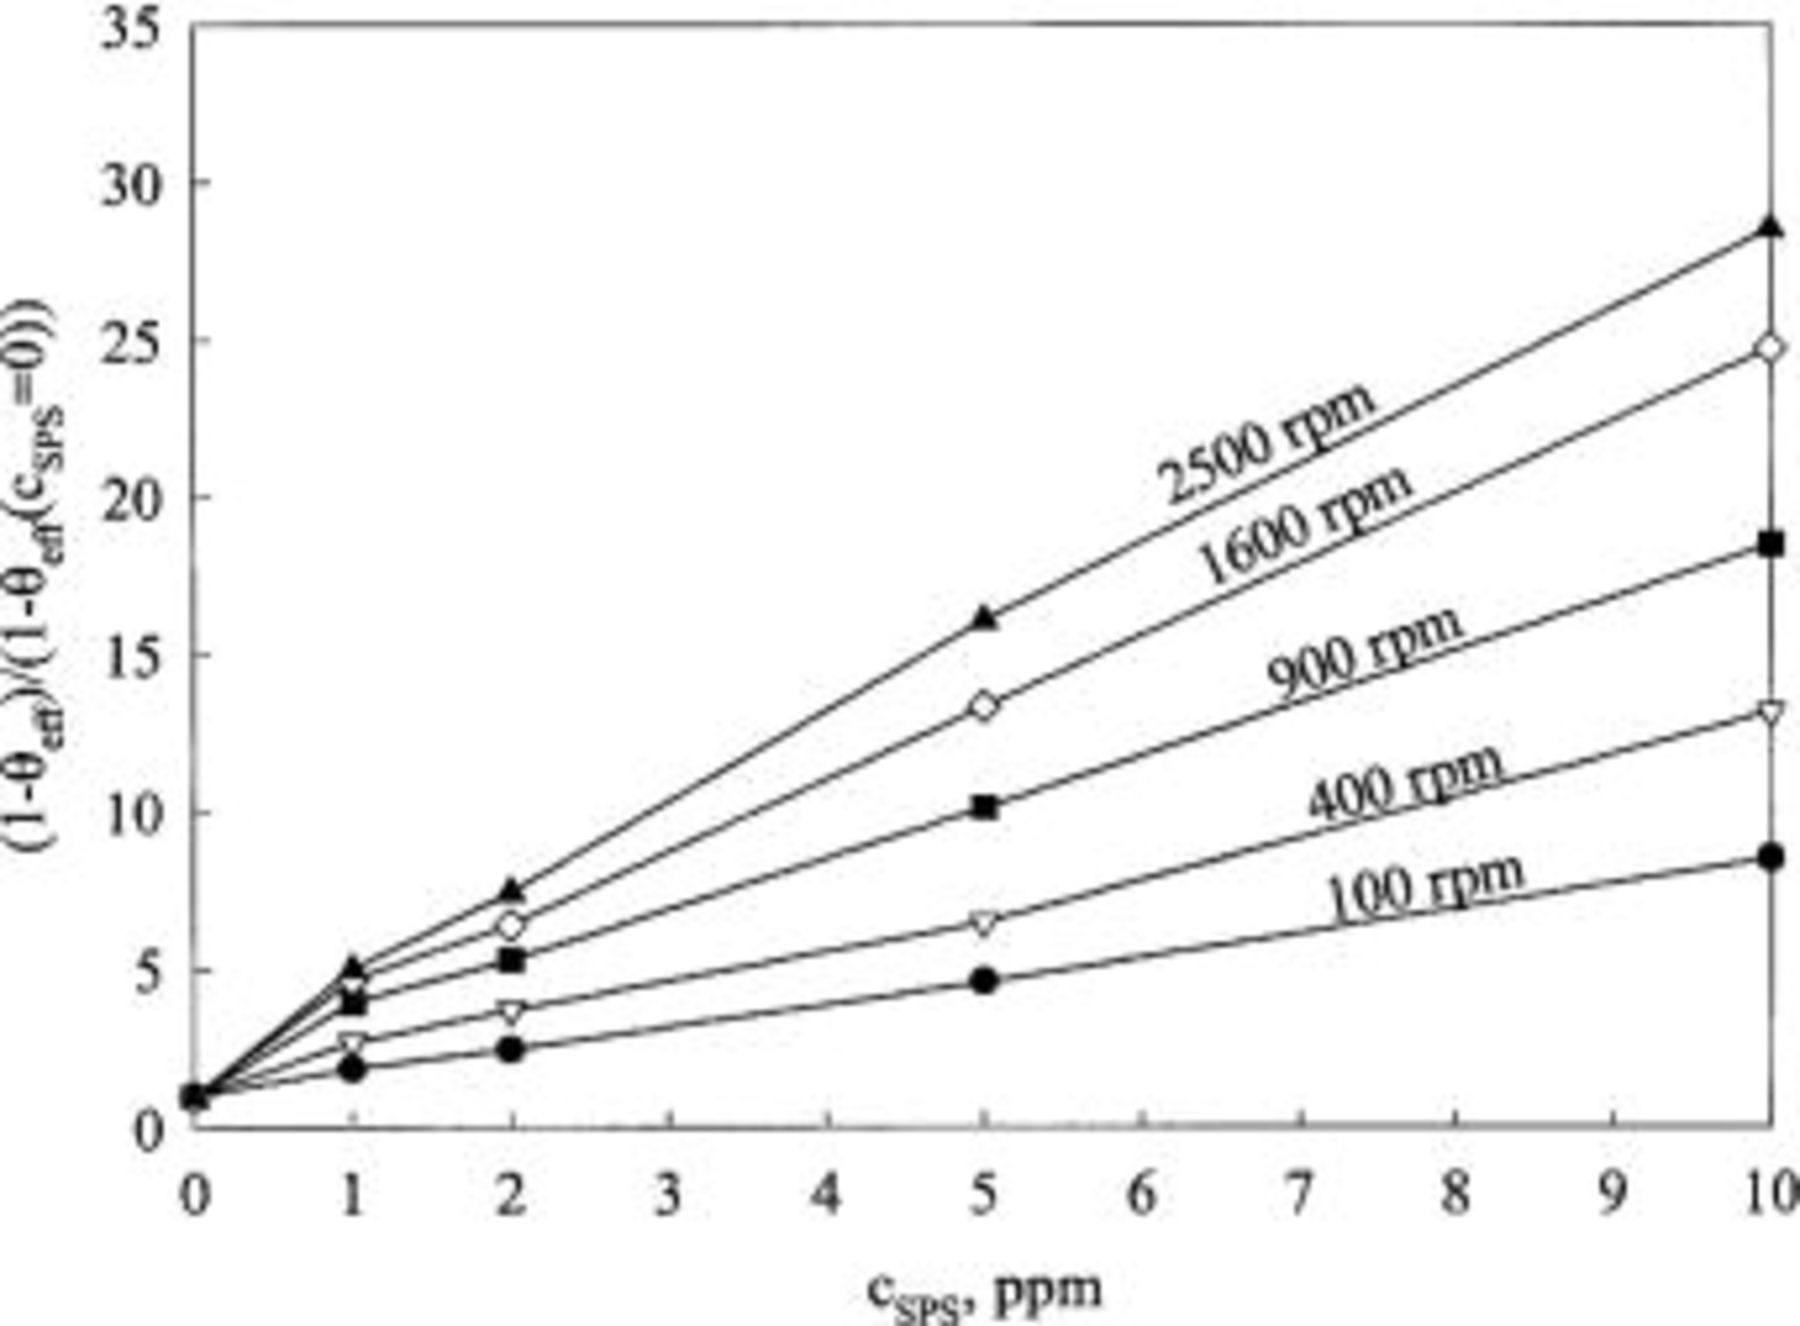
Figure 10. The normalized, effective surface coverage as a function of SPS concentration for 5 rotation speeds. The base electrolyte composition is 0.24 M  , 1.8 M
  , 300 ppm PEG (Mw 3350), and 50 ppm
  .
.
JGB
The effective surface coverage in the presence of all the additives is shown in Fig. 11 for  ppm. The surface coverage increases quickly with an increase of the concentration of JGB. The shape of the curve is similar to a Langmuir isotherm. Indeed, a plot of
  vs. the concentration of JGB is fairly linear over a large range of concentrations. The value of surface coverage calculated from the chronoamperometric results are also seen to show consistent trends, although some discrepancies in estimated values exist. Analogous data were analyzed for
  ppm, and qualitatively similar behavior is found. In contrast, CVS curves are quite different, as can be seen in Fig. 5. The suppression of the copper deposition is insensitive to changes in concentration of JGB at low values according to CVS results, while the opposite is true for LSV and CA results, as shown in Fig. 11.
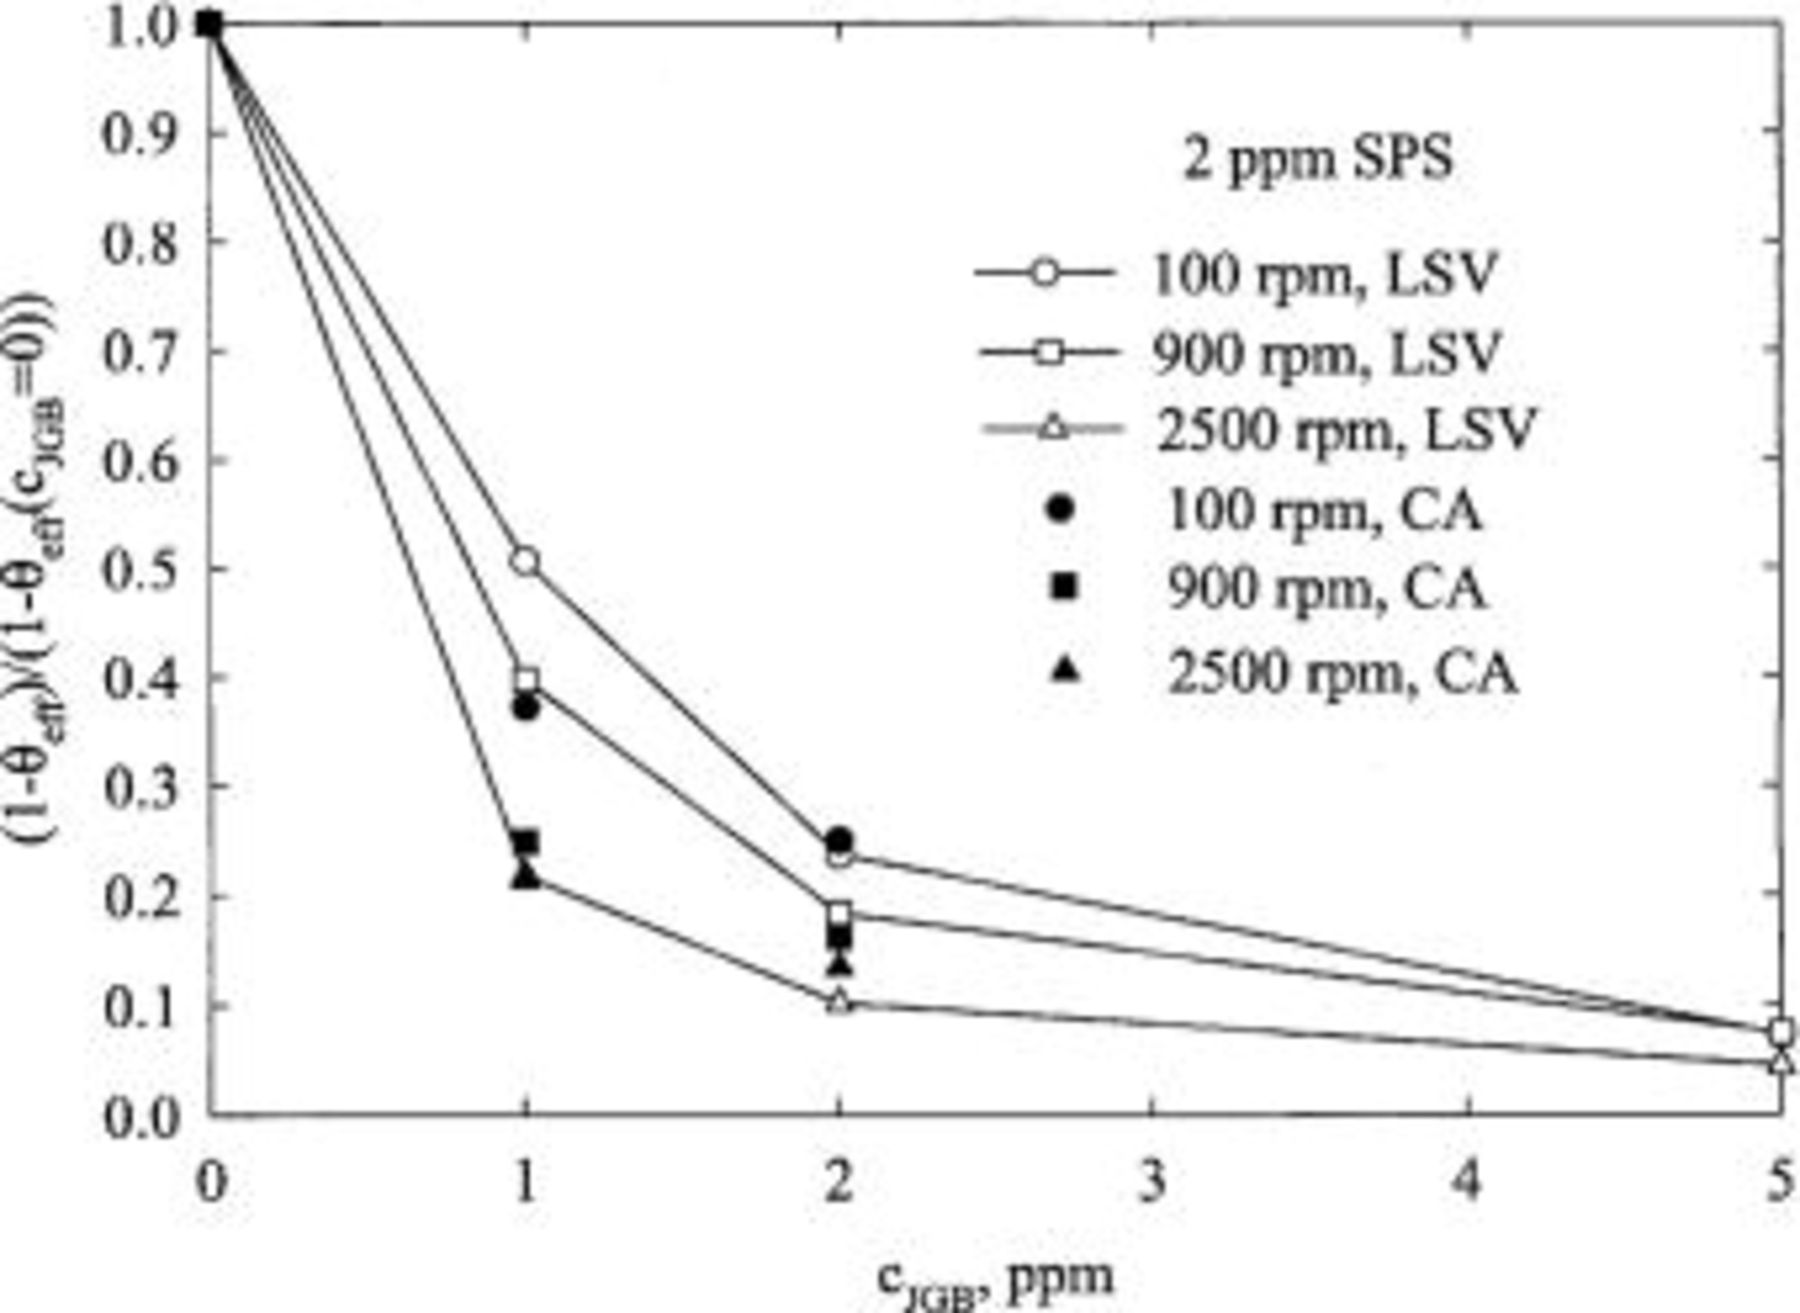
Figure 11. The normalized, effective surface coverage as a function of JGB concentration for 3 rotation speeds as estimated by LSV and CA. The base electrolyte composition is 0.24 M  , 1.8 M
  , 300 ppm PEG (Mw 3350), 50 ppm
  , and 2 ppm SPS.
From Cu leveling experiments, it is found that voids are formed in baths containing 5 ppm JGB and 1 ppm SPS. According to the established leveling mechanisms,
11
17
a concentration gradient of leveling agent (presumably JGB) inside the trench is required to achieve a spatial variation in additive surface coverage, resulting in preferential deposition at the trench bottom. Figure 11 would suggest that, as JGB concentration increases, the surface coverage saturates; in other words, the concentration gradient no longer significantly alters the surface coverage. Therefore, superfilling cannot be achieved at high concentrations of JGB. Similar qualitative analysis of the electrochemical measurements can be used to rationalize all of the fill study results (with or without voids), except for the results obtained at  We present a quantitative analysis in Ref.
5
that indeed shows a direct connection between the electrochemical measurements and the fill studies.
We present a quantitative analysis in Ref.
5
that indeed shows a direct connection between the electrochemical measurements and the fill studies.
Conclusions
Electrochemical methods can be used to characterize the influence of additive composition on deposition rate. Interpretation of changes in deposition rate as a measure of an effective surface coverage may provide insight into an optimal composition range of additives. The effective surface coverage obtained by interpretation of CA and LSV results provides similar conclusions, while the same interpretation of CVS measurements does not seem appropriate when applied to an electrolyte containing all four additives.
Fill studies on patterned wafer have shown that the leveling capacity of the electrolyte disappears at high concentration of the leveling agent JGB. The critical concentration at which voids are observed depends on the SPS concentration. Such observations can be rationalized by the measured relationship between JGB bulk concentration and the effective surface coverage.
Acknowledgment
The authors are very grateful to The Semiconductor Research Corporation for their financial support under the task identifier 448.049. We would also like to thank Blessen Samuel for help with fill studies and CVS measurements.
Columbia University assisted in meeting the publication costs of this article.
List of Symbols

| the area under the stripping peak in the presence of additives, C |

| the area under the stripping peak in the absence of additives, C |

| surface concentration of cupric ion , 
|

| bulk concentration of cupric ion, 
|

| Faraday's constant, 96487 C/equiv |

| exchange current density, 
|

| current density in the presence of additives, 
|

| limiting current density, 
|

| current density in the absence of additives, 
|

| number of electrons involved in a reaction |

| universal gas constant, 8.314 J/mol K |

| absolute temperature, K |

| potential of an electrode, V |

| cathodic transfer coefficient |

| effective surface coverage of additives |