Article Text

Abstract
Background Triple-negative breast cancer (TNBC) is the most aggressive breast cancer subtype with no effective standard therapy. Breast cancer stem-like cells (BCSCs) in primary TNBCs are reported to be responsible for metastatic spread of the disease and resistance to chemotherapy, but no available therapeutic tools target BCSCs. We previously reported that the ganglioside GD2 is highly expressed on BCSCs and that inhibition of its expression hampers TNBC growth. We therefore hypothesized that the anti-GD2 antibody dinutuximab (ch14.18) targets GD2+ BCSCs and inhibits TNBC growth.
Method To test our hypothesis, we first determined GD2 expression via immunohistochemistry in frozen primary tumor samples from patients with TNBC (n=89). Then, we examined the effects of dinutuximab on TNBC cell adhesion, migration, and mammosphere formation in vitro and on tumor growth in vivo using TNBC cell-line and patient-derived xenograft (PDX) models.
Results We found that GD2 was expressed in around 60% of primary TNBC tumors at variable levels and was associated with worse overall survival of patients with TNBC (p=0.002). GD2 was found to be expressed in tumors and stroma, but normal ducts and lobules in adjacent tissues have shown low or no GD2 staining, indicating that GD2 is potentially a novel biomarker for tumor and its microenvironment. Treatment with dinutuximab significantly decreased adhesion and migration of MDA-MB-231 and SUM159 TNBC cells. Moreover, dinutuximab treatment inhibited mTOR signaling, which has been shown to be regulated by GD2 in BCSCs. Dinutuximab also reduced tumor growth in nude mice bearing TNBC cell-line xenografts. Finally, dinutuximab in combination with activated natural killer cells inhibited tumor growth in a TNBC PDX model and improved overall survival of tumor-bearing mice.
Conclusions Dinutuximab successfully eliminated GD2+ cells and reduced tumor growth in both in vivo models. Our data provide proof-of-concept for the criticality of GD2 in BCSCs and demonstrate the potential of dinutuximab as a novel therapeutic approach for TNBC.
- antibodies
- neoplasm
- biomarkers
- tumor
- tumor biomarkers
This is an open access article distributed in accordance with the Creative Commons Attribution Non Commercial (CC BY-NC 4.0) license, which permits others to distribute, remix, adapt, build upon this work non-commercially, and license their derivative works on different terms, provided the original work is properly cited, appropriate credit is given, any changes made indicated, and the use is non-commercial. See http://creativecommons.org/licenses/by-nc/4.0/.
Statistics from Altmetric.com
Background
Cancer stem-like cells (CSCs) make up a fraction of the cells in primary and metastatic tumors. They share biological characteristics with normal stem cells and are believed to emerge via mutational changes to primary tumor cells or normal tissue-specific stem cells.1–3 These changes confer a survival advantage to cancer cells by allowing self-renewal, enhancing resistance to conventional chemotherapy and radiation therapy, permitting metastatic dissemination, and conferring other tumor-promoting attributes, which together contribute to tumor recurrence and ultimately to poor clinical outcomes.4–6 Targeting CSCs is, therefore, an important strategy to prevent the metastatic spread of cancer and sensitize tumors to chemotherapy by limiting tumors’ regrowth potential. However, a lack of specific markers makes identifying and targeting CSCs in primary tumors difficult. These cells can stay quiescent for extended periods under metabolic or therapy-related stress and quickly transform into a highly proliferative state under the right growth conditions. These attributes pose major challenges for the development of CSC-specific therapeutics.7 8
Al-Hajj et al9 were the first to report that breast CSCs (BCSCs) can be identified by cell-surface expression of epithelial-specific antigen, high expression of CD44, low or negligible expression of CD24, and a lack of lineage-specific markers. Later, different groups reported that BCSCs are also characterized by increased aldehyde dehydrogenase activity.8 Gene expression profiling studies suggested that aldehyde dehydrogenase expression is associated with epithelial-like BCSCs, whereas the CD44highCD24low phenotype is more specific for mesenchymal-like BCSCs.10 However, the high abundance of these proteins on normal stem cells and variations in the expression of CD44 and CD24 on tumor cells limit the potential of these markers as therapeutic targets.5
We previously showed that ganglioside GD2-positive breast cancer cells display molecular and functional properties of CSCs.11 A ganglioside is a sialic acid-bearing glycosphingolipid composed of a ceramide base with an extracellularly protruding oligosaccharide chain.12 13 GD2 is a b-series acidic glycosphingolipid with two residues of sialic acid on its carbohydrate moieties. It is found on the outer side of the plasma membrane in domains known as lipid rafts. It is produced from GD3 precursors by the enzymatic activity of GD2 synthase.14 15 A recent analysis of a primary breast cancer tissue microarray demonstrated a strong association between high GD2 expression and advanced cancer stage; it also demonstrated correlations between high GD2 expression and larger tumor size and nodal invasion.16 In other solid tumors, such as small cell lung cancer and osteosarcoma, GD2 enhances tumor proliferation and invasiveness.17 18 In addition to its function as a marker for BCSCs, its tumor-specific expression and stability after binding to a specific antibody makes GD2 an excellent target for antibody-based therapy.19
Tumor-targeted monoclonal antibody–based therapy is effective against many solid tumors and hematological malignancies. Over the past two decades, researchers have developed several anti-GD2 antibodies. In 2015, dinutuximab became the first US Food and Drug Administration-approved monoclonal antibody for the treatment of neuroblastoma; it is now used as a first-line therapy in pediatric patients with high-risk neuroblastoma.20 21 Moreover, previous studies demonstrated that combining dinutuximab with activated natural killer (NK)1 cells potentiates the therapeutic effect of dinutuximab via antibody-dependent cell-mediated cytotoxicity (ADCC), thereby improving survival in mice with disseminated neuroblastoma.22 Despite several studies in which GD2+ tumors were targeted by dinutuximab, there are no reports of dinutuximab being used in the treatment of GD2+ breast cancer subtypes. Hence, in this study, we hypothesized that treatment with dinutuximab targets GD2+ BCSCs and inhibits tumor progression. To test this hypothesis, we measured the expression of GD2 in primary tumor tissues and correlated it with the overall survival of patients with triple-negative breast cancer (TNBC). We further demonstrated the effects of dinutuximab on BCSC function and tumor growth in vitro and in vivo using TNBC cell lines and xenograft models.
Materials and methods
Antibodies, and cell lines and PDX models
Information on the antibodies used for flow cytometry, western blotting, and immunohistochemistry (IHC) studies along with the therapeutic anti-GD2 antibodies is provided in online supplemental table 2. All TNBC cell lines were purchased from American Type Culture Collection (ATCC). Non-TNBC cell lines were a kind gift from Dr Naoto Ueno’s laboratory, and TNBC PDX models were obtained from the laboratory of Dr Helen Piwnica-Worms (MD Anderson Cancer Center) (online supplemental table 3). Cell lines were maintained according to ATCC’s recommendations. PDX models maintained and expanded in Nonobese diabetic/severe combined immunodeficiency gamma (NSG) mice. In addition, HIM3 patient-derived TNBC cells were propagated in vitro in complete Roswell Park Memorial Institute (RPMI) medium.23
Supplemental material
Primary NK cell culture
Primary NK cells were isolated from peripheral blood mononuclear cells obtained from healthy human donors (Gulf Coast Regional Blood Center and The University of Texas MD Anderson Cancer Center). NK cells were expanded and activated ex vivo via coculture with irradiated K562 cells expressing interleukin (IL)-21 in IL-2-containing media for 2 weeks, as described previously.24 On day 14, the expanded NK cells were analyzed for expression of the NK cell-specific marker CD56 and its activation marker CD16 by using flow cytometry (online supplemental figure 7).
Flow cytometry
Single-color staining of cells was performed as described previously.25 Briefly, 1×10⁶ cells were washed twice with flow cytometry buffer, incubated in the dark with an Allophycocyanin (APC)-conjugated anti-GD2 antibody for 30 min on ice, washed again in flow cytometry buffer, and counterstained with 4',6-diamidino-2-phenylindole (DAPI) (0.5 μg/mL; Thermo Fisher) to exclude any dead cells. Acquisition was performed using LSR-II (BD Biosciences) and Gallios (Beckman Coulter) flow cytometers; results were analyzed using FlowJo software (BD Biosciences). At least 1×10⁴ events were measured in cell lines and 1×10⁵ events in NK cells.
Cell adhesion assay
SUM159 and MDA-MB-231 TNBC cells were cultured overnight in serum-deprived Dulbecco’s modified Eagle’s medium (DMEM), and then 8×10⁵ cells were plated in a 12-well dish with serum-free DMEM. The cells were treated with or without dinutuximab (United Therapeutics) or rituximab (Pharmacy, MD Anderson) at different concentrations. Rituximab is a chimeric anti-CD20 antibody that was used as a nonspecific control antibody. Following treatment, the cells were incubated for 8 hours and washed with phosphate-buffered saline (PBS) to remove nonadherent cells. The remaining adherent cells were trypsinized and counted using a Vi-CELL cell counter (Beckman Coulter).
Transwell cell migration assay
To determine the effect of dinutuximab on cellular migration, cell migration assays were performed using 24-well transwell chambers as described previously.11 Briefly, the bottom chambers were filled with complete DMEM (Corning). In the upper chambers, 1.5×10⁵ MDA-MB-231 cells were suspended in serum-free DMEM containing dinutuximab or rituximab at concentrations of 0, 100, 1000, or 5000 ng/mL and incubated for 8 hours. The cells that migrated to the other side of the membrane were fixed with 2% formalin, stained with H&E, and counted on images captured using an EVOS-Auto cell imaging system (Thermo Fisher Scientific).
Mammosphere assay
To investigate the effect of dinutuximab and rituximab on the mammosphere formation potential of MDA-MB-231 and BT-549 cells, 5×10³ cells were plated in ultralow-attachment 24-well dishes containing 1 mL of mammosphere growth medium (Stemcell Technologies). The cells were treated with dinutuximab or rituximab at concentrations of 0, 100, 1000, or 10,000 ng/mL. After 10–12 days of culture, the resulting mammospheres were counted using the GelCount automated colony counter (Oxford Optronix) as described previously.11
Western blotting
Western blotting was performed as described previously.26 Briefly, 1×10⁶ MDA-MB-231 or SUM159 cells were treated with or without dinutuximab or rituximab at various concentrations (0, 500, 1000, or 5000 ng/mL) for 24 hours, and protein lysates were prepared. The antibodies used for western blotting are listed in online supplemental table 2. Glyceraldehyde 3-phosphate dehydrogenase (GAPDH) served as a loading control.
Immunohistochemistry of frozen primary tumor tissues
IHC analyses for GD2 expression were performed on frozen TNBC tissue sections (Tissue bank, MD Anderson). A request for retrospective collection of frozen TNBC tissue samples was approved by MD Anderson Cancer Center’s Institutional Review Board (Protocol # PA19-073). Briefly, tissue sections 7–10 µm in thickness were generated using a cryotome and placed on positively charged slides, followed by fixation in precooled absolute ethanol for 10 min. Endogenous peroxidase activity was blocked by incubating the slides in 3% H2O2 for 10 min. Nonspecific antibody binding was blocked by incubating the slides with blocking buffer for 1 hour at room temperature. The slides were then incubated with an unconjugated anti-GD2 primary antibody (1:250) for 1 hour at room temperature followed by a horseradish peroxidase-conjugated secondary antibody for 30 min at room temperature. The antibodies used for IHC are listed in online supplemental table 2. A 3,3′-diaminobenzidine (DAB) substrate solution was then applied to the sections for color development. Slides were counterstained with hematoxylin (Leica Biosystems) for less than 4 min at room temperature, then washed and dehydrated through 4 changes of alcohol (95%, 95%, 100%, 100%) for 5 min each. Tissue slides were then cleared in three changes of xylene for 5 min each, and coverslips were applied using mounting solution. The images were acquired by a Vectra Polaris multispectral imager (PerkinElmer). We performed whole-slide digital image analysis using Visiopharm pathology image analysis software to quantify GD2 expression. The expression data were independently validated by a pathologist at MD Anderson Cancer Center.
Apoptosis assay
For live cell apoptosis assays, green fluorescent protein (GFP)-expressing SUM159 or MDA-MB-231 cells were incubated with annexin V-red reagent and with different concentrations of dinutuximab, rituximab, or a vehicle control in the presence or absence of NK cells at different effector-to-target cell ratios. Time-lapse fluorescence imaging was performed using an IncuCyte live cell imaging system (Essen BioScience) to assess apoptosis induction every 2 hours for 48 hours. The percentage of green or red cells was normalized to the percentage of confluence and expressed as annexin V-positive counts.27
Effect of dinutuximab on in vivo tumor growth in a TNBC cell line xenograft model
All experiments involving animals were approved by and conducted in accordance with the policies of the MD Anderson Institutional Animal Care and Use Committee. MDA-MB-231 cells (3×10⁶ cells/mouse) expressing GFP and firefly luciferase were suspended in 50 μL of Matrigel diluted with DMEM at a 1:1 ratio and implanted into the abdominal mammary glands of female nude mice (Foxn1null; n=10) (Jackson laboratories). Tumor volume was measured weekly with calipers. Once all mice had palpable tumors (0.3×0.3×0.3 cm), which occurred about 3 weeks after implantation, they were given dinutuximab or rituximab at 1.4 mg/kg/mouse via tail vein injection wo times a week for 7 weeks. Once the tumor volume reached 2 cm, mice were euthanized by CO2. Tumor progression was tracked by approximating the tumor volume via caliper measurements and by bioluminescence imaging with an IVIS imager (PerkinElmer) as described previously.
Effect of dinutuximab on TNBC patient-derived xenograft growth
To generate TNBC patient-derived xenografts (PDXs), 3×10⁶ PIM-005 cells were mixed with 100 µL of Matrigel and implanted into the mammary fat pads of female NOD scid gamma mice (Il2rgnull; n=50) (Jackson Laboratories). Tumor incidence and volumes were checked weekly using calipers. Once all mice had palpable tumors (0.3×0.3×0.3 cm), which occurred about 3 weeks after implantation, mice were randomized into five treatment groups: (1) control (PBS), (2) NK cells alone, (3) dinutuximab alone, (4) NK cells plus rituximab, and (5) NK cells plus dinutuximab. Dinutuximab and rituximab were administered at 1.4 mg/kg/mouse via tail vein injection once a week for 4 weeks starting at week 5 after cell transplantation. NK cells (1×10⁷ cells/mouse) were injected via the tail vein in combination with intraperitoneal injection of IL-2 (Proleukin) at 3 µg per mouse once a week for 4 weeks starting at week 5 after cell transplantation. Tumor growth was measured weekly using calipers.
Data acquisition and statistical analysis
Characteristics of patients from whom frozen tissue samples were obtained were extracted from MD Anderson’s electronic health records system (Epic Systems). GD2 expression was evaluated in 89 TNBC tumor samples and 14 matched adjacent normal breast tissues. The median percentage of GD2-expressing cells was compared between matched tumor and normal-tissue samples using the Wilcoxon rank sum test. The percentage of GD2 expression (GD2%) was reported as mean±SD for all categorical variables. An independent t-test was used to compare the mean GD2% for binary categorical variables. One-way analysis of variance was used to compare the mean GD2% across categorical variables with more than two groups. GD2% was then categorized into a binary variable (high-expression versus low-expression groups) by using a receiver operating characteristic curve to choose an appropriate cut point of 10.378%. Multivariate logistic regression was performed to assess variables associated with mortality. The log-rank test was used to generate Kaplan-Meier overall survival curves based on GD2 expression level. All analyses of patient data were performed using IBM SPSS software for Windows (V.26).
Differences in tumor growth between treatment groups were determined using two-way analysis of variance for repeated measures. All other group differences were evaluated using a two-tailed unpaired Student’s t test. Figures and analyses were generated using Prism software V.8 (GraphPad Software), except figures and analyses of flow cytometry experiments, which were generated using FlowJo software (V.10.6.1). P<0.05 were considered significant.
Results
GD2 is upregulated in TNBC cell lines, PDX models, and primary TNBC tissues
We previously reported that expression of the ganglioside GD2 identifies cells with stem-like properties in breast tumors.11 Thus, in the present study, we assessed GD2 expression in over 25 breast cancer cell lines, including TNBC, estrogen receptor (ER)+, progesterone receptor (PR)+, and human epidermal growth factor receptor 2 (HER2)+ cell lines, as well as in cells derived from 5 TNBC PDXs (table 1, online supplemental figures 1–3). We found that GD2 was expressed in most breast cancer cell lines, though at variable levels. The median (±SD) percentage of GD2+ cells was 6.2% (±0.7%) in TNBC cell lines and 2.1% (±0.2%) in ER+PR+ and HER2+ cell lines. Although most of the TNBC cell lines displayed substantial percentages of GD2+ cells (>1%), some cell lines (MDA-MB-453, HCC1806, BT-20, and HCC1599) exhibited no or very low (<0.5%) levels of GD2 expression. Interestingly, in two TNBC cell lines (Hs 578T and HCC1395), more than 90% of cells expressed GD2, suggesting that GD2 can be considered a tumor-specific marker in addition to a BCSC marker in some TNBC cell lines. Interestingly, we also observed variable levels of GD2 expression in TNBC-derived PDX cells, ranging from 0.5% to 35% (online supplemental figure 3).
Percentages of GD2+ cells among breast cancer cell lines and in TNBC PDX models
Next, to assess the clinical significance of GD2 expression in TNBC, we performed IHC on frozen primary tumor tissue samples from patients with TNBC (n=89) and matched adjacent normal tissue samples (n=14). The patients’ mean (±SEM) age was 59 (±14) years. Among the 89 tumor samples, 63 (70.7%) were invasive ductal carcinoma, 12 (13.5%) were metaplastic cancer, and 4 (4.5%) were ductal carcinoma in situ. Most patients had high-grade (grade III) tumors (69, 77.5%), 17 (19.1%) had grade II tumors, and the remaining 3 (3.4%) had grade I tumors (online supplemental table 1). In line with our findings in cell lines and PDX models, we observed variable GD2 expression in TNBC patient samples (figure 1A,B). Of 89 samples, 60 (67.42%) had detectable levels of GD2 staining, with variable staining intensity (figure 1B,C). In contrast, mammary ducts in the adjacent normal tissues exhibited low or no GD2 staining (figure 1A). GD2 expression was significantly higher in tumor tissues than in matched normal tissues, suggesting that GD2 is a tumor-specific marker in patients with TNBC (n=14, p<0.001; figure 1D).
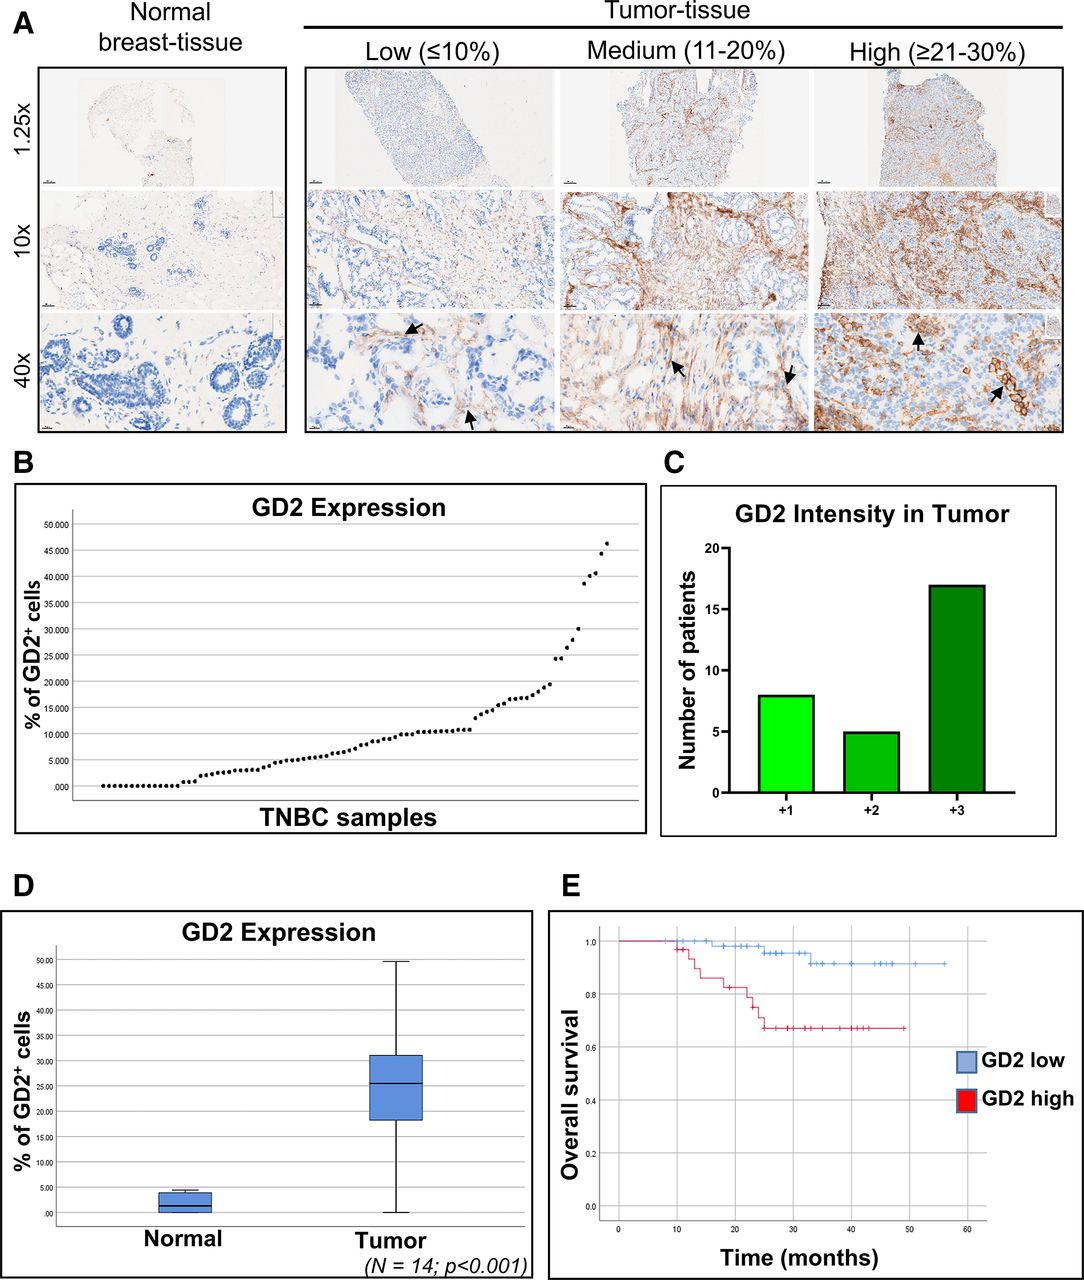
GD2 is expressed at variable levels in frozen TNBC patient samples. (A) Immunohistochemical analysis of GD2 expression in frozen primary TNBC patient tissue samples (n=89) and matched adjacent normal tissue (n=14) using an unconjugated anti-GD2 antibody. Images were taken at 1.25×, 10×, and 40× magnification. Black arrows indicate GD2 staining. (B) Percentage of GD2-expressing cells in individual TNBC tumor samples (n=89) ranged from 0% to 45%. (C) Intensity scores for GD2 expression in TNBC tumor samples with GD2 expression in tumor or both tumor and stroma. Scores are +1 for low, +2 for moderate, and +3 for high intensities. (D) Mean (±SD) GD2 expression in matched tumor tissue and adjacent normal tissue (n=14) from patients with TNBC. Significantly higher expression was observed in tumor tissue than in the adjacent normal tissue (p<0.001). (E) Kaplan-Meier survival plot demonstrating the overall survival rates in the patients with TNBC stratified by GD2 expression level. TNBC, triple-negative breast cancer.
Approximately 60% of the GD2+ tumors had strong positive staining for GD2 (figure 1C). GD2 expression was not significantly correlated with patient age, patient race, tumor stage, or tumor grade (online supplemental table 1). However, tumors from patients who had received neoadjuvant chemotherapy had higher GD2 expression than did untreated tumors, though this was not statistically significant (p=0.095, (online supplemental figure 4A). This finding was also validated in SUM159 cells treated with paclitaxel (online supplemental figure 4B). Moreover, our analysis demonstrated that patients whose tumors exhibited low GD2 expression (n=58) had significantly better overall survival than did patients with high GD2-expressing tumors (n=31) (p=0.002) (figure 1E). These data suggested that GD2 is a tumor-specific marker in TNBC cell lines and primary tumors and that high GD2 expression is associated with poor prognosis and can thus serve as a potential therapeutic target in TNBC.
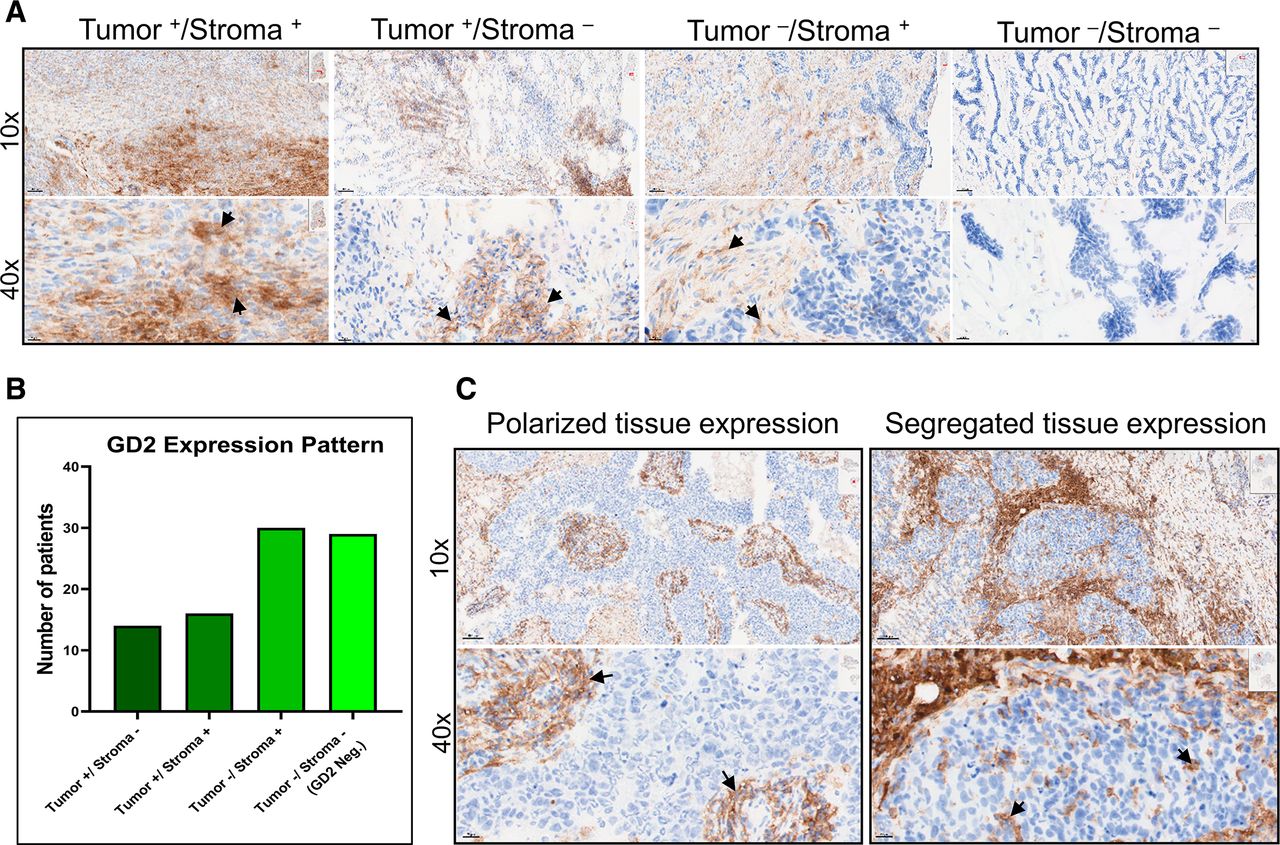
Interestingly, we observed GD2 expression in tumors and in the tumor-associated stroma (figure 2A). Out of 60 GD2+ tumors, 30 expressed GD2 in tumor only or in both tumor and the surrounding stroma, while in the remaining 30 tumor samples, GD2 was expressed only in the tumor-associated stroma (figure 2B). Furthermore, we found polarized and segregated expression of GD2 within tumors (figure 2C), suggesting that microenvironmental factors contribute to GD2 expression on both tumor and stromal cells.

GD2 is differentially expressed in tumor and stroma of TNBC tissue. (A) Images at 10× and 40× magnification showing specific GD2 expression in tumor and stroma (Tumor+/Stroma+), tumor only (Tumor+/Stroma-), stroma only (Tumor-/Stroma+), and no expression (Tumor-/Stroma-) in TNBC tissue samples. (B) Number of patient samples with each GD2 expression pattern. Of 89 samples analyzed, 60 showed detectable GD2 expression. In 30 samples, GD2 was expressed in tumor or in both tumor and stroma, while in the remaining 30 samples, GD2 was expressed only in tumor-associated stroma. (C) Polarized and segregated expression of GD2 in primary tumor samples (magnification 10× and 40×). Specific GD2 expression is indicated by black arrows. TNBC, triple-negative breast cancer.
Dinutuximab binds to GD2 on breast cancer cells and inhibits cell adhesion
To assess the binding of the anti-GD2 monoclonal antibody dinutuximab to GD2+ cells in breast cancer cell lines, we indirectly stained two TNBC cell lines with relatively low (SUM159; ~10%) and high (Hs 578T; ~100%) GD2 expression with dinutuximab and then conducted flow cytometry. We also stained cells with a commercially available fluorochrome-conjugated mouse monoclonal anti-GD2 antibody (clone 14.G2a) as a positive control or with rituximab (an anti-CD20 antibody) as a negative control. GD2 expression levels were nearly identical in cells stained with dinutuximab or 14.G2a, whereas rituximab did not bind to the breast cancer cell lines tested (figure 3A), suggesting that dinutuximab selectively identifies GD2+ breast cancer cells.
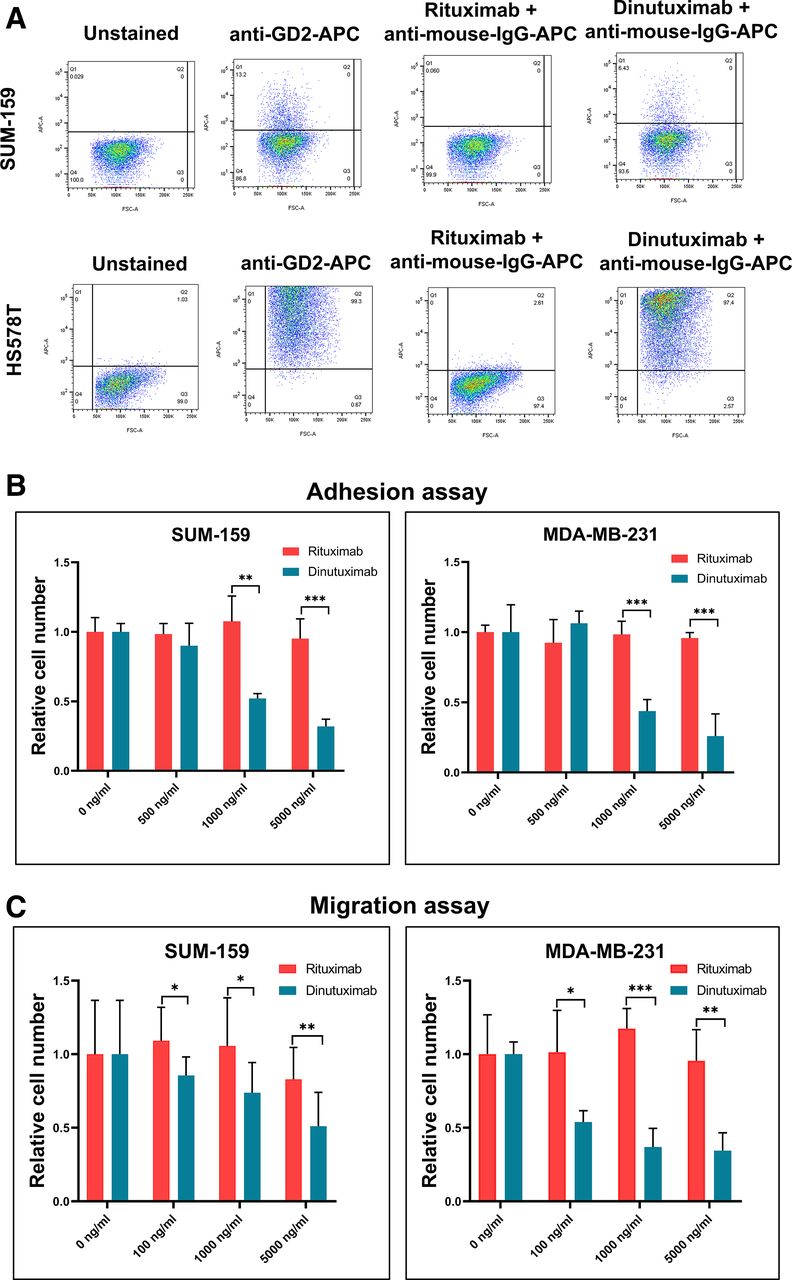
Dinutuximab targets GD2+ stem cells in TNBC cell lines and inhibits cell adhesion and migration. (A) Flow cytometry results showing GD2 expression in TNBC cell lines. SUM159 and Hs 578T cells were stained with an APC-conjugated anti-GD2 antibody (clone 14.G2a), dinutuximab, or rituximab (anti-CD20 antibody). An antihuman IgG secondary antibody was used for staining cells treated with rituximab and dinutuximab primary antibodies. An APC-conjugated antimouse IgG2a antibody served as an isotype control for 14.G2a. (B) Results of cell adhesion assays. SUM159 and MDA-MB-231 cells were treated with varying concentrations of dinutuximab or rituximab (0, 500, 1000, or 5000 ng/mL). The bar graphs show the relative adhesion of dinutuximab-treated and rituximab-treated cells. **P<0.001; ***p<0.0001. (C) Results of cell migration assays. Serum-starved SUM159 and MDA-MB-231 cells were trypsinized and treated with dinutuximab or rituximab at 0, 100, 1000, and 5000 ng/mL. The bar graph shows the relative numbers of migrated cells under each treatment condition. *P<0.05; **p<0.001; ***p<0.0001. TNBC, triple-negative breast cancer.
Several investigators have demonstrated the role of GD2 in cell adhesion.18 28 29 To determine dinutuximab’s effect on cell adhesion, we treated MDA-MB-231 and SUM159 cells with dinutuximab or rituximab and found that dinutuximab inhibited cell adhesion by at least 50% and in a dose-dependent manner (p<0.001) (figure 3B; online supplemental figure 5A). In contrast, treatment with rituximab did not affect the ability of cells to adhere to plastic, suggesting that binding of dinutuximab to GD2 reduces the adhesion of TNBC cells.
Dinutuximab reduces BCSC migration and mammosphere formation by inhibiting the mTOR pathway
TNBCs are highly metastatic breast cancers; as migration is a key aspect of metastasis, we performed a transwell migration assay to investigate dinutuximab’s effect on TNBC cell migration. MDA-MB-231 and SUM159 cells were treated with or without dinutuximab or rituximab. Compared with rituximab, exposure to dinutuximab significantly decreased the number of migratory MDA-MB-231 cells in a dose-dependent manner (p<0.001) (figure 3C). Because mammosphere formation is a characteristic of BCSCs, we next performed a mammosphere assay to determine the effect of dinutuximab on the sphere-forming ability of BCSCs. MDA-MB-231 and BT-549 cells were grown with or without dinutuximab or rituximab. We observed a 50% reduction in mammosphere formation at the highest concentration of dinutuximab, suggesting that dinutuximab has modest efficacy against mammosphere formation (p<0.001) (online supplemental figure 5B).
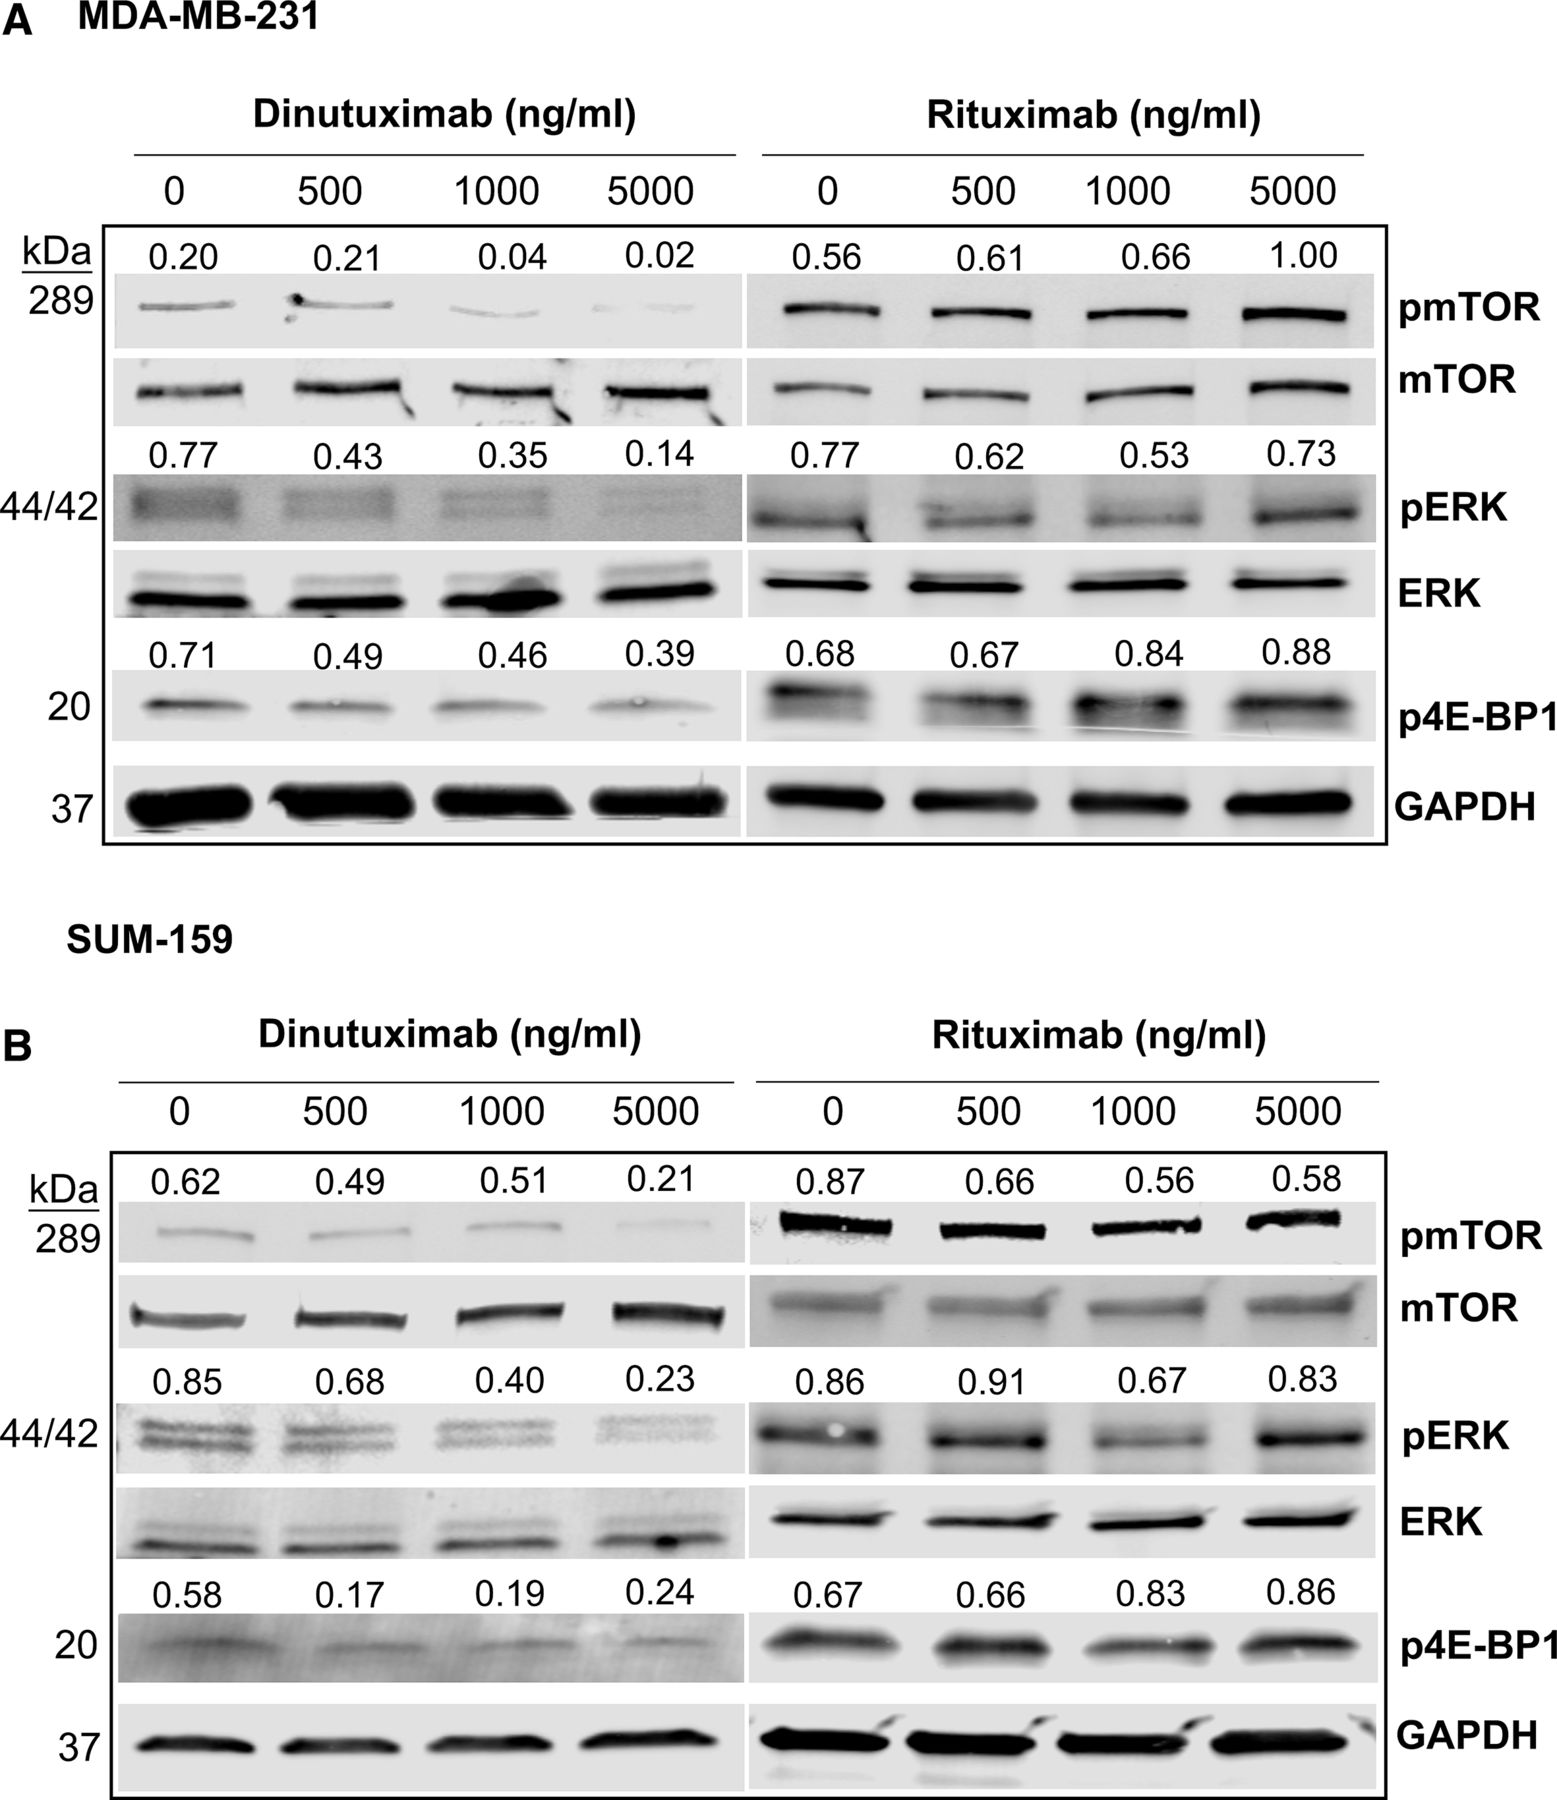
We previously showed that mTOR signaling is highly activated in GD2+ cells and that inhibition of GD2 expression by targeting GD3 synthase (ST8SIA1) blocks the mTOR/4E-BP1 signaling pathway.26 Since dinutuximab binds to GD2 and inhibits its functions, including cell adhesion and migration, we hypothesized that dinutuximab regulates cell signaling by inhibiting the downstream mTOR signaling pathway in BCSCs. We analyzed MDA-MB-231 and SUM159 cells treated with dinutuximab or rituximab using western blotting to assess the expression and activation of mTOR signaling pathway–associated proteins (figure 4A,B). Treatment with dinutuximab inhibited phosphorylation of mTOR, ERK, and 4E-BP1 in a dose-dependent manner. Specifically, we observed reductions of approximately 60%, 50%, and 40% in levels of phosphorylated mTOR, phosphorylated ERK, and phosphorylated 4E-BP1, respectively. Conversely, no differences in the phosphorylation of these proteins were observed in rituximab-treated cells. These findings suggest that dinutuximab inhibits the mTOR/MAPK signaling pathways in GD2+ cells (figure 4A,B). This observation was further supported by western blotting analysis comparing pmTOR, pERK, and p4E-BP1 expression in sorted GD2+ and GD2- SUM159 and MDA-MB-231 cells treated with dinutuximab or rituximab (online supplemental figure 6).

Treatment with dinutuximab inhibits the mTOR signaling/MAPK pathway. (A) MDA-MB-231 cells were treated with different concentrations of dinutuximab or rituximab (0, 500, 1000, or 5000 ng/mL) for 24 hours. Cell lysates were prepared and analyzed using western blotting for the expression of the total and phosphorylated forms of mTOR (pmTOR), ERK (pERK), and 4E-BP1 (p4E-BP1). (B) SUM159 cell lysates were analyzed for the expression of major mTOR pathway proteins as described above. The results were normalized to GAPDH expression. The quantified expression levels for each protein are indicated above the individual western blot bands.
Dinutuximab in combination with activated NK cells targets GD2+ cells via ADCC
Treatment with dinutuximab in combination with NK cells has produced promising outcomes in preclinical studies of neuroblastoma.30 To determine whether NK cells enhance the efficacy of dinutuximab against GD2+ breast cancer cells, we treated SUM159 cells with dinutuximab or rituximab (20 μg/mL) alone or in combination with IL-21-activated human peripheral blood-derived NK cells (online supplemental figure 7) at a different target:NK-cell ratios. We then determined the percentage of GD2+ SUM159 cells using flow cytometry. We observed a 70% reduction in the percentage of GD2+ cells (p<0.001) after treatment with dinutuximab in combination with increasing NK cell concentration. The mean (±SE of the mean) percentage of GD2+ cells was 20.1% (±0.3%) in the untreated group and 5.8% (±0.2%) in the group treated with the combination of dinutuximab and NK cells at an target:effector ratio of 2:1 (p<0.001) (figure 5A). No significant effect was observed in the dinutuximab-only or rituximab and NK cell-only groups. These data demonstrated that in combination with NK cells, dinutuximab targets GD2+ BCSCs via ADCC.

Dinutuximab in combination with NK cells targets GD2+ cells and induces NK cell-mediated apoptosis via ADCC. (A) Flow cytometry data showing percentages of GD2+ cells. SUM159 cells were treated with dinutuximab or rituximab alone or in combination with activated human peripheral blood–derived NK cells at different target:effector (NK cell) ratios (8:1, 4:1, and 2:1). Cells were stained with an APC-conjugated anti-GD2 antibody (clone 14.G2a). (B) SUM159 and MDA-MB-231 cells were treated with dinutuximab or rituximab with or without NK cells. Cells were simultaneously treated with annexin V-red reagent. Graphs show the number of apoptotic cells. (C) Images of MDA-MB-231 cells obtained 12 hours after annexin V-red staining in cells treated with PBS, dinutuximab only, NK cells only, or the combination of dinutuximab and NK cells. Red-stained areas indicate apoptotic cells. NK, natural killer.
Because apoptosis is one mechanism by which NK cells kill target cells via ADCC, we hypothesized that combined treatment with dinutuximab and NK cells induces apoptosis in breast cancer cells. To measure NK cell-mediated apoptosis, we examined annexin V binding to target cells. We cultured SUM159 and MDA-MB-231 cells with or without NK cells and with dinutuximab at a 1:2 ratio of NK to tumor cells for these apoptosis assays. Dinutuximab treatment alone had no effect on annexin V binding, whereas combination treatment with activated NK cells elicited a significant increase in annexin V binding within a few hours (figure 5B). Microscopy further demonstrated the significant increase in annexin V binding to MDA-MB-231 cells after combined treatment with dinutuximab and NK cells (figure 5C, red areas). These data demonstrated that dinutuximab targets GD2+ BCSCs by enhancing NK cell-mediated apoptosis.
Dinutuximab inhibits breast xenograft tumor growth in vivo
To investigate the effects of dinutuximab on in vivo tumor growth, we implanted MDA-MB-231 cells expressing GFP and firefly luciferase (3×10⁶ cells/mouse) into the mammary fat pads of nude mice that can generate their own NK cells (Foxn1nu; n=10) (figure 6A).31 When tumors were established, mice were intravenously injected with either dinutuximab or rituximab through the tail vein at a dose of 1.4 mg/kg two times a week for 7 weeks (figure 6A). Tumor growth was determined weekly. We observed complete suppression of tumor growth in the dinutuximab-treated mice but not in the rituximab-treated control mice (figure 6B). Furthermore, bioluminescence imaging showed consistently high luminescence intensity in control mice given rituximab but over 90% lower luminescence intensity in mice given dinutuximab (p<0.001) (figure 6C,D). These data suggest that treatment with dinutuximab in the presence of endogenous NK cells significantly reduced TNBC growth and progression.

Treatment with dinutuximab inhibits tumor growth in a TNBC xenograft model. (A) Scheme of cell-line xenograft experiments. MDA-MB-231 cells expressing GFP and firefly luciferase (FF-Luci) were implanted (3×10⁶ cells/mouse) into the mammary fat pads of nude mice (Foxn1null; n=10). After generation of palpable tumors, the mice were given either dinutuximab or rituximab at 1.4 mg/kg/mouse via tail vein injection two times a week for 7 weeks. Tumor growth was measured using calipers and bioluminescence imaging. (B,) Graph showing tumor volumes in mice treated with dinutuximab or rituximab. (C,) Representative bioluminescent images of tumor progression in mice treated with dinutuximab or rituximab. Seven weeks after the treatment, mice were injected with luciferin, and subsequent imaging was performed using an IVIS imager. (D) Quantitative analysis of the bioluminescence imaging showing the tumor burdens in rituximab-treated and dinutuximab-treated mice. **P<0.05; ***p<0.001; ****p<0.0001. GFP, green fluorescent protein; TNBC, triple-negative breast cancer.
In combination with activated NK cells, dinutuximab inhibits primary tumor growth in a TNBC PDX model
Our data showed that TNBC PDX models had variable expression of GD2 in a fraction of tumor cells (table 1 and online supplemental figure 3), suggesting that GD2 is a potential therapeutic target in GD2+ TNBC. To confirm this, we tested the effect of dinutuximab in combination with activated human peripheral blood-derived NK cells on TNBC PDX growth in immunodeficient mice. PDX-bearing mice were randomized into five treatment groups: (1) control (PBS), (2) NK cells alone, (3) dinutuximab alone, (4) NK cells plus rituximab, and (5) NK cells plus dinutuximab. In groups 3 and 5, we administered 1.4 mg/kg dinutuximab via tail vein injection twice a week for 4 weeks, starting at the fifth week after tumor implantation. In groups 2, 4, and 5, we administered 1×10⁷ NK cells intravenously in combination with an intraperitoneal injection of 3 μg IL-2 once a week for 4 weeks (figure 7A). Concurrent treatment with dinutuximab and NK cells resulted in the largest reduction (>85%) in tumor volume (figure 7B). Even dinutuximab treatment alone caused marked reductions in tumor volume . The enhanced effect of dinutuximab in combination with NK cells suggested that dinutuximab guides NK cells to target GD2+ cells. Moreover, Kaplan-Meier survival analysis revealed that mice treated with dinutuximab and NK cells had a considerable survival advantage over mice given rituximab and NK cells (figure 7C).

Dinutuximab in combination with NK cells inhibits tumor growth in a TNBC PDX model. (A) Scheme of PDX experiments. PIM-005 TNBC PDX cells (3×10⁶ cells/mouse) were implanted into the mammary fat pads of NSG mice (Il2rgnull; n=50). Tumor volumes were measured weekly using calipers. After palpable tumors were generated, the mice were randomized into five treatment groups: (1) control (PBS), (2) NK cells alone, (3) dinutuximab alone, (4) rituximab with NK cells, and (5) dinutuximab with NK cells. Treatments were administered via tail vein injection two times a week starting at week 5 after PIM-005 cell implantation. (B) Graph showing tumor volumes in the mice in the different treatment groups. (C) Kaplan-Meier survival plot demonstrating the overall survival rates of the mice in the different treatment groups. (D) Schematic summarizing the results of our study showing that dinutuximab binds to GD2 and prevents tumor progression by targeting GD2+ cells in several cellular processes, including cell adhesion, migration, and mTOR signaling as well as induction of NK cell-mediated ADCC. **P<0.05; ***p<0.001; ****p<0.0001. ADCC, antibody-dependent cell-mediated cytotoxicity; NK, natural killer; PBS, phosphate-buffered saline; PDX, patient-derived xenograft; TNBC, triple-negative breast cancer.
Discussion
In the present study, we demonstrated that GD2 is a therapeutic target in breast cancer. The specific anti-GD2 antibody dinutuximab targets GD2+ cells and inhibits cell adhesion, migration, and mammosphere formation by regulating the mTOR pathway, which regulates cellular growth, migration, and proliferation.32 In vivo, dinutuximab inhibits tumor growth and extends the survival of mice bearing TNBC tumors by directing NK cells to GD2+ breast tumors and inducing ADCC. Thus, treatment with dinutuximab in combination with NK cells is a potential therapeutic strategy for GD2+ TNBC (figure 7D). Dinutuximab is a chimeric 14.18 human-mouse recombinant monoclonal antibody that incorporates human constant immunoglobulin G1 (IgG1) regions and kappa chains together with the variable regions of Ig from murine hybridoma 14.18.33
TNBC has higher levels of GD2-expressing CSCs than other breast cancer subtypes. Dinutuximab binds stably to GD2 and inhibits its function. We found that dinutuximab reduced cell adhesion, migration, and mammosphere formation in TNBC. Treatment with dinutuximab also significantly inhibited mTOR pathway which regulates cellular growth, migration, and proliferation.32 Additionally, our xenograft and PDX models demonstrate that dinutuximab significantly inhibits tumor growth in vivo which is further complemented by addition of NK cells. These findings are consistent with the observation that combination of dinutuximab and adoptively transferred human NK cells substantially improved survival in an immunodeficient mouse model of neuroblastoma.22
The clinical importance of GD2 as a BCSC marker was established in our previous study of CSCs11 and confirmed by several other groups.16 34 35 High GD2 expression in TNBCs enhances cell proliferation by inducing constitutive activation of the proto-oncogene MET.19 In neuroblastoma, GD2 facilitates metastasis by enhancing adhesion of platelets to extracellular matrix collagen.36 Furthermore, the gangliosides GM2, GD2, and GD3 are highly expressed in tumors of neuroectodermal origin, such as melanomas, gliomas, and neuroblastomas, but they are absent or weakly expressed in normal tissues.37–39 In the present study, we assessed GD2 levels in different breast cancer cells and observed higher expression in TNBC than in other breast cancer subtypes. This observation aligns with our previous findings suggesting that GD2 expression is higher in basal compared with luminal breast cancer cells.11 IHC analysis of GD2 expression in frozen TNBC tissue specimens corresponded with GD2 expression patterns in TNBC cell lines and PDX models. GD2 was expressed in approximately 64% of TNBC tumors in our study cohort.
The pattern of GD2 expression in TNBC tissues was asymmetrical, encompassing the tumor microenvironment. Along with tumor-specific expression in some cases, we also observed substantial expression in stroma. Remarkably, in some patient samples, GD2 was expressed only in the stroma, not in tumor cells. However, GD2 was not expressed in normal tissue, supporting the idea that it can serve as a tumor-specific stem cell marker. Differential expression of GD2 in tumor and stroma indicates possible involvement of the stromal component in the progression of TNBC. We did not observe cytotoxic effect of dinutuximab alone in cell culture experiments presumably due to the absence of tumor stromal component. Orsi et al40 reported earlier that GD2 expression is associated with aggressive types of breast cancer, including TNBCs, consistent with our IHC study in patients with TNBC. High GD2 expression in various cancers is associated with cells proliferation, neoangiogenesis, and immune evasion.41 42
In a recently published study, Seitz et al35 generated GD2-specific chimeric antigen receptor (GD2-CAR) T cells using sequences derived from dinutuximab and tested them against TNBC xenograft models. These anti-GD2 CAR-T cells were highly effective against breast cancer metastases and delayed tumor growth in xenograft mouse models. However, clinically, CAR-T cells have very limited effects on solid tumors, possibly because of the difficulty of accessing the tumor core or the immune-suppressive nature of the tumor microenvironment. However, monoclonal antibodies are very effectively used in the treatment of solid tumors (eg, anti-HER2 therapy using trastuzumab). Therefore, dinutuximab is a suitable alternative to CAR-T cells for treating GD2+ tumors.
The mTOR pathway is considered the primary regulator of cell growth, proliferation, differentiation, and survival.43 44 As previously mentioned, the mTOR pathway is highly activated in GD2+ BCSCs.26 Our study showed that knockdown of GD2 expression inhibited phosphorylation of mTOR and its downstream factors. We have also shown that treatment with the mTOR inhibitor everolimus hampered in vitro tumorigenesis in TNBC cells, suggesting the crucial role of mTOR signaling in GD2+ BCSCs. Interestingly, we saw similar results when TNBC cells were treated with dinutuximab, indicating the role of GD2 in the regulation of BCSC function in TNBC.
In neuroblastoma, dinutuximab binds to GD2+ cells and marks them for NK cell-mediated ADCC.22 Dinutuximab also induces stronger ADCC than other anti-GD2 antibodies in GD2+ neuroblastoma cells.45 Recently, Marx et al46 reported that incubation of glioblastoma multiforme cells with effector cells and dinutuximab induced a robust ADCC against the majority of the cell lines analyzed, clearly indicating the antitumor efficacy of GD2-directed treatment against glioblastoma. Our studies in TNBC cells demonstrated that treatment with dinutuximab substantially reduced in vivo TNBC tumor growth, which parallels the activity of dinutuximab in GD2+ melanoma cells in vivo.47 This significant reduction in tumor growth led us to speculate about the role of NK cells in the present study because nude mice can generate NK cells that can kill tumor cells via ADCC driven by exposure to dinutuximab. It has been shown that the mouse FC receptor (FcRn) has higher affinity for human IgG1 than does its human counterpart,48 which confirms the mechanism of dinutuximab-directed NK cell-mediated ADCC in nude mouse models. Several investigators have tested dinutuximab in combination with NK cells to target GD2+ neuroblastoma in vivo.22 47 49 50 In the present study, treatment with the combination of dinutuximab and NK cells substantially decreased the number of GD2-expressing cells and facilitated apoptosis of TNBC cells. Moreover, treatment of TNBC PDXs with dinutuximab in combination with activated NK cells synergistically reduced tumor volumes and increased mouse survival, in accordance with reports of the effects of anti-GD2 treatment in neuroblastoma PDX models and cell lines.22 45
In addition to its effect on TNBC, examination of dinutuximab’s role in ER+, PR+, or HER2+ subtypes of breast cancer could further substantiate the role of GD2 in breast cancer. However, we reported that GD2 expression is higher in TNBC than in non-TNBC, and our focus on TNBC was also prompted by its poor clinical outcomes. Another possible limitation of this study is that we did not study combinations of dinutuximab with conventional chemotherapeutic agents. However, considering that treatment with dinutuximab inhibits mTOR signaling, it is highly likely that dinutuximab sensitizes GD2+ cells to chemotherapy.
In conclusion, this study provides proof-of-concept for the efficacy of targeting GD2 in triple negative breast cancer. We demonstrate that targeting GD2 with dinutuximab inhibits BCSC function and induces NK cell-mediated apoptosis in GD2+ TNBC cells through ADCC. Importantly, the xenograft and PDX model data combining a GD2-targeting antibody with activating NK-cells strongly support testing of this concept in patients with TNBC.
Acknowledgments
The authors thank Dr Naoto Ueno for providing some of the valuable non-TNBC cell lines used in this study. They are also grateful to the patients who provided tumor biopsy specimens for establishing the PDX models. PDX models and derivatives were obtained from the Cazalot Breast Cancer Model Resource at MD Anderson Cancer Center, The University of Texas. This resource was established through a gift from the Cazalot family and with funds from the MD Anderson Breast Cancer Moon Shot Program. We thank Amy Ninetto, Scientific Editor, Research Medical Library, MD Anderson Cancer Center, for editing the manuscript.
References
Supplementary materials
Supplementary Data
This web only file has been produced by the BMJ Publishing Group from an electronic file supplied by the author(s) and has not been edited for content.
Footnotes
Twitter @Viv_Aiims
SL and VA contributed equally.
Contributors SL, VA, FE-D, KN, YC, SC, DT, AAS: conducted experiments and analyzed data. HP-W: provided mouse models. MA, VLB: conceptualised this study, analyzed data, prepared manuscript, and supplied financial support.
Funding This work was partially supported by funding from United Therapeutics Corporation (VLB), a US Department of Defense Breakthrough Award (W81XWH-19-1-0453, to VLB), the Breast Cancer Research Foundation (MA), the Cancer Prevention and Research Institute of Texas (RP160710, to HP-W), and a National Institutes of Health/National Cancer Institute Cancer Center Support Grant to MD Anderson Cancer Center (P30 CA016672, used the Flow Cytometry and Cellular Imaging Core Facility [MA]).
Competing interests MA and VLB were awarded a patent for therapeutic targeting of GD2 in cancer (US9846160B2).
Patient consent for publication Not required.
Provenance and peer review Not commissioned; externally peer reviewed.
Data availability statement No data are available. No data are available for sharing.
Supplemental material This content has been supplied by the author(s). It has not been vetted by BMJ Publishing Group Limited (BMJ) and may not have been peer-reviewed. Any opinions or recommendations discussed are solely those of the author(s) and are not endorsed by BMJ. BMJ disclaims all liability and responsibility arising from any reliance placed on the content. Where the content includes any translated material, BMJ does not warrant the accuracy and reliability of the translations (including but not limited to local regulations, clinical guidelines, terminology, drug names and drug dosages), and is not responsible for any error and/or omissions arising from translation and adaptation or otherwise.