Article Text

Burden of injury along the development spectrum: associations between the Socio-demographic Index and disability-adjusted life year estimates from the Global Burden of Disease Study 2017
  1. Juanita A Haagsma1,
  2. Spencer L James2,
  3. Chris D Castle2,
  4. Zachary V Dingels2,
  5. Jack T Fox2,
  6. Erin B Hamilton2,
  7. Zichen Liu2,
  8. Lydia R Lucchesi2,
  9. Nicholas L S Roberts2,
  10. Dillon O Sylte2,
  11. Oladimeji M Adebayo3,
  12. Alireza Ahmadi4,
  13. Muktar Beshir Ahmed5,
  14. Miloud Taki Eddine Aichour6,
  15. Fares Alahdab7,
  16. Suliman A Alghnam8,
  17. Syed Mohamed Aljunid9,10,
  18. Rajaa M Al-Raddadi11,
  19. Ubai Alsharif12,
  20. Khalid Altirkawi13,
  21. Mina Anjomshoa14,
  22. Carl Abelardo T Antonio15,16,
  23. Seth Christopher Yaw Appiah17,18,
  24. Olatunde Aremu19,
  25. Amit Arora20,21,
  26. Hamid Asayesh22,
  27. Reza Assadi23,
  28. Ashish Awasthi24,
  29. Beatriz Paulina Ayala Quintanilla25,26,
  30. Shivanthi Balalla27,
  31. Amrit Banstola28,
  32. Suzanne Lyn Barker-Collo29,
  33. Till Winfried Bärnighausen30,31,
  34. Shahrzad Bazargan-Hejazi32,33,
  35. Neeraj Bedi34,
  36. Masoud Behzadifar35,
  37. Meysam Behzadifar36,
  38. Corina Benjet37,
  39. Derrick A Bennett38,
  40. Isabela M Bensenor39,
  41. Soumyadeep Bhaumik40,
  42. Zulfiqar A Bhutta41,42,
  43. Ali Bijani43,
  44. Guilherme Borges37,
  45. Rohan Borschmann44,45,
  46. Dipan Bose46,
  47. Soufiane Boufous47,
  48. Alexandra Brazinova48,
  49. Julio Cesar Campuzano Rincon49,50,
  50. Rosario Cárdenas51,
  51. Juan J Carrero52,
  52. Félix Carvalho53,
  53. Carlos A Castañeda-Orjuela54,55,
  54. Ferrán Catalá-López56,57,
  55. Jee-Young J Choi58,
  56. Devasahayam J Christopher59,
  57. Christopher Stephen Crowe60,
  58. Koustuv Dalal61,62,
  59. Ahmad Daryani63,
  60. Dragos Virgil Davitoiu64,65,
  61. Louisa Degenhardt2,66,
  62. Diego De Leo67,
  63. Jan-Walter De Neve30,
  64. Kebede Deribe68,69,
  65. Getenet Ayalew Dessie70,
  66. Gabrielle Aline deVeber71,
  67. Samath Dhamminda Dharmaratne2,72,
  68. Linh Phuong Doan73,
  69. Kate A Dolan74,
  70. Tim Robert Driscoll75,
  71. Manisha Dubey76,
  72. Ziad El-Khatib77,78,
  73. Christian Lycke Ellingsen79,
  74. Maysaa El Sayed Zaki80,
  75. Aman Yesuf Endries81,
  76. Sharareh Eskandarieh82,
  77. Andre Faro83,
  78. Seyed-Mohammad Fereshtehnejad84,85,
  79. Eduarda Fernandes86,
  80. Irina Filip87,88,
  81. Florian Fischer89,
  82. Richard Charles Franklin90,
  83. Takeshi Fukumoto91,92,
  84. Kebede Embaye Gezae93,
  85. Tiffany K Gill94,
  86. Alessandra C Goulart95,96,
  87. Ayman Grada97,
  88. Yuming Guo98,99,
  89. Rahul Gupta100,101,
  90. Hassan Haghparast Bidgoli102,
  91. Arvin Haj-Mirzaian103,104,
  92. Arya Haj-Mirzaian103,105,
  93. Randah R Hamadeh106,
  94. Samer Hamidi107,
  95. Josep Maria Haro108,109,
  96. Hadi Hassankhani110,111,
  97. Hamid Yimam Hassen112,113,
  98. Rasmus Havmoeller114,
  99. Delia Hendrie115,
  100. Andualem Henok112,
  101. Martha Híjar116,117,
  102. Michael K Hole118,
  103. Enayatollah Homaie Rad119,120,
  104. Naznin Hossain121,122,
  105. Sorin Hostiuc123,124,
  106. Guoqing Hu125,
  107. Ehimario U Igumbor126,127,
  108. Olayinka Stephen Ilesanmi128,
  109. Seyed Sina Naghibi Irvani129,
  110. Sheikh Mohammed Shariful Islam130,131,
  111. Rebecca Q Ivers132,
  112. Kathryn H Jacobsen133,
  113. Nader Jahanmehr134,135,
  114. Mihajlo Jakovljevic136,
  115. Achala Upendra Jayatilleke137,138,
  116. Ravi Prakash Jha139,
  117. Jost B Jonas140,141,
  118. Zahra Jorjoran Shushtari142,
  119. Jacek Jerzy Jozwiak143,
  120. Mikk Jürisson144,
  121. Ali Kabir145,
  122. Rizwan Kalani146,
  123. Amir Kasaeian147,148,
  124. Abraham Getachew Kelbore149,
  125. Andre Pascal Kengne150,151,
  126. Yousef Saleh Khader152,
  127. Morteza Abdullatif Khafaie153,
  128. Nauman Khalid154,
  129. Ejaz Ahmad Khan155,
  130. Abdullah T Khoja156,157,
  131. Aliasghar A Kiadaliri158,
  132. Young-Eun Kim159,
  133. Daniel Kim160,
  134. Adnan Kisa161,
  135. Ai Koyanagi162,163,
  136. Barthelemy Kuate Defo164,165,
  137. Burcu Kucuk Bicer166,167,
  138. Manasi Kumar168,169,
  139. Ratilal Lalloo170,
  140. Hilton Lam171,
  141. Faris Hasan Lami172,
  142. Van C Lansingh173,174,
  143. Janet L Leasher175,
  144. Shanshan Li98,
  145. Shai Linn176,
  146. Raimundas Lunevicius177,178,
  147. Flavia R Machado179,
  148. Hassan Magdy Abd El Razek180,
  149. Muhammed Magdy Abd El Razek181,
  150. Narayan Bahadur Mahotra182,
  151. Marek Majdan183,
  152. Azeem Majeed184,
  153. Reza Malekzadeh185,186,
  154. Manzoor Ahmad Malik187,188,
  155. Deborah Carvalho Malta189,
  156. Ana-Laura Manda190,
  157. Mohammad Ali Mansournia191,
  158. Benjamin Ballard Massenburg60,
  159. Pallab K Maulik192,193,
  160. Hailemariam Abiy Alemu Meheretu70,194,
  161. Man Mohan Mehndiratta195,196,
  162. Addisu Melese197,
  163. Walter Mendoza198,
  164. Melkamu Merid Mengesha199,
  165. Tuomo J Meretoja200,201,
  166. Atte Meretoja202,203,
  167. Tomislav Mestrovic204,205,
  168. Tomasz Miazgowski206,
  169. Ted R Miller115,207,
  170. GK Mini208,209,
  171. Erkin M Mirrakhimov210,211,
  172. Babak Moazen30,212,
  173. Naser Mohammad Gholi Mezerji213,
  174. Roghayeh Mohammadibakhsh214,
  175. Shafiu Mohammed30,215,
  176. Mariam Molokhia216,
  177. Lorenzo Monasta217,
  178. Stefania Mondello218,219,
  179. Pablo A Montero-Zamora220,221,
  180. Yoshan Moodley222,
  181. Mahmood Moosazadeh223,
  182. Ghobad Moradi224,225,
  183. Maziar Moradi-Lakeh226,
  184. Lidia Morawska227,
  185. Ilais Moreno Velásquez228,
  186. Shane Douglas Morrison229,
  187. Marilita M Moschos230,231,
  188. Seyyed Meysam Mousavi232,233,
  189. Srinivas Murthy234,
  190. Kamarul Imran Musa235,
  191. Gurudatta Naik236,
  192. Farid Najafi237,
  193. Vinay Nangia238,
  194. Bruno Ramos Nascimento239,
  195. Duduzile Edith Ndwandwe240,
  196. Ionut Negoi64,241,
  197. Trang Huyen Nguyen242,
  198. Son Hoang Nguyen242,
  199. Long Hoang Nguyen242,
  200. Huong Lan Thi Nguyen243,
  201. Dina Nur Anggraini Ningrum244,245,
  202. Yirga Legesse Nirayo246,
  203. Richard Ofori-Asenso247,248,
  204. Felix Akpojene Ogbo249,
  205. In-Hwan Oh250,
  206. Olanrewaju Oladimeji251,252,
  207. Andrew T Olagunju253,254,
  208. Tinuke O Olagunju255,
  209. Pedro R Olivares256,
  210. Heather M Orpana257,258,
  211. Stanislav S Otstavnov259,260,
  212. Mahesh P A261,
  213. Smita Pakhale262,
  214. Eun-Kee Park263,
  215. George C Patton264,265,
  216. Konrad Pesudovs266,
  217. Michael R Phillips267,268,
  218. Suzanne Polinder1,
  219. Swayam Prakash269,
  220. Amir Radfar270,271,
  221. Anwar Rafay272,
  222. Alireza Rafiei273,274,
  223. Siavash Rahimi275,
  224. Vafa Rahimi-Movaghar276,
  225. Muhammad Aziz Rahman277,278,
  226. Rajesh Kumar Rai279,280,
  227. Kiana Ramezanzadeh281,
  228. Salman Rawaf184,282,
  229. David Laith Rawaf283,284,
  230. Andre M N Renzaho249,285,
  231. Serge Resnikoff286,287,
  232. Shahab Rezaeian288,
  233. Leonardo Roever289,
  234. Luca Ronfani217,
  235. Gholamreza Roshandel185,290,
  236. Yogesh Damodar Sabde291,
  237. Basema Saddik292,
  238. Payman Salamati276,
  239. Yahya Salimi237,293,
  240. Inbal Salz294,
  241. Abdallah M Samy295,
  242. Juan Sanabria296,297,
  243. Lidia Sanchez Riera298,299,
  244. Milena M Santric Milicevic300,301,
  245. Maheswar Satpathy302,303,
  246. Monika Sawhney304,
  247. Susan M Sawyer44,264,
  248. Sonia Saxena305,
  249. Mete Saylan306,
  250. Ione J C Schneider307,
  251. David C Schwebel308,
  252. Soraya Seedat309,
  253. Sadaf G Sepanlou185,186,
  254. Masood Ali Shaikh310,
  255. Mehran Shams-Beyranvand311,312,
  256. Morteza Shamsizadeh313,
  257. Mahdi Sharif-Alhoseini276,
  258. Aziz Sheikh314,315,
  259. Jiabin Shen316,
  260. Mika Shigematsu317,
  261. Rahman Shiri318,
  262. Ivy Shiue319,
  263. João Pedro Silva53,
  264. Jasvinder A Singh320,321,
  265. Dhirendra Narain Sinha322,323,
  266. Adauto Martins Soares Filho324,
  267. Joan B Soriano325,326,
  268. Sergey Soshnikov327,
  269. Ireneous N Soyiri328,329,
  270. Vladimir I Starodubov330,
  271. Dan J Stein323,331,
  272. Mark A Stokes332,
  273. Mu'awiyyah Babale Sufiyan333,
  274. Jacob E Sunshine334,
  275. Bryan L Sykes335,
  276. Rafael Tabarés-Seisdedos336,337,
  277. Karen M Tabb338,
  278. Arash Tehrani-Banihashemi226,339,
  279. Gizachew Assefa Tessema340,341,
  280. Jarnail Singh Thakur342,
  281. Khanh Bao Tran343,344,
  282. Bach Xuan Tran345,
  283. Lorainne Tudor Car346,
  284. Olalekan A Uthman347,
  285. Benjamin S Chudi Uzochukwu348,
  286. Pascual R Valdez349,350,
  287. Elena Varavikova351,
  288. Ana Maria Nogales Vasconcelos352,353,
  289. Narayanaswamy Venketasubramanian354,355,
  290. Francesco S Violante356,357,
  291. Vasily Vlassov358,
  292. Yasir Waheed359,
  293. Yuan-Pang Wang360,
  294. Tissa Wijeratne361,362,
  295. Andrea Sylvia Winkler363,364,
  296. Priyanka Yadav365,
  297. Yuichiro Yano366,
  298. Muluken Azage Yenesew194,
  299. Paul Yip367,368,
  300. Engida Yisma369,
  301. Naohiro Yonemoto370,
  302. Mustafa Z Younis371,372,
  303. Chuanhua Yu373,374,
  304. Shamsa Zafar375,
  305. Zoubida Zaidi376,
  306. Sojib Bin Zaman377,378,
  307. Mohammad Zamani379,
  308. Yong Zhao380,
  309. Sanjay Zodpey381,
  310. Simon I Hay2,382,
  311. Alan D Lopez2,383,
  312. Ali H Mokdad2,382,
  313. Theo Vos2,382
  1. 1 Department of Public Health, Erasmus University Medical Center, Rotterdam, The Netherlands
  2. 2 Institute for Health Metrics and Evaluation, University of Washington, Seattle, Washington, USA
  3. 3 Department of Medicine, University College Hospital Ibadan, Ibadan, Nigeria
  4. 4 Department of Anesthesiology, Kermanshah University of Medical Sciences, Kermanshah, Iran
  5. 5 Department of Epidemiology, Jimma University, Jimma, Ethiopia
  6. 6 Higher National School of Veterinary Medicine, Algiers, Algeria
  7. 7 Evidence Based Practice Center, Mayo Clinic Foundation for Medical Education and Research, Rochester, Minnesota, USA
  8. 8 Department of Population Health Research, King Abdullah International Medical Research Center, Riyadh, Saudi Arabia
  9. 9 Department of Health Policy and Management, Kuwait University, Safat, Kuwait
  10. 10 International Centre for Casemix and Clinical Coding, National University of Malaysia, Bandar Tun Razak, Malaysia
  11. 11 Department of Family and Community Medicine, King Abdulaziz University, Jeddah, Saudi Arabia
  12. 12 Department of Oral and Maxillofacial Surgery, University Hospital Knappschaftskrankenhaus Bochum, Bochum, Germany
  13. 13 King Saud University, Riyadh, Saudi Arabia
  14. 14 Social Determinants of Health Research Center, Rafsanjan University of Medical Sciences, Rafsanjan, Iran
  15. 15 Department of Health Policy and Administration, University of the Philippines Manila, Manila, Philippines
  16. 16 Department of Applied Social Sciences, Hong Kong Polytechnic University, Hong Kong, China
  17. 17 Department of Sociology and Social Work, Kwame Nkrumah University of Science and Technology, Kumasi, Ghana
  18. 18 Center for International Health, Ludwig Maximilians University, Munich, Germany
  19. 19 School of Health Sciences, Birmingham City University, Birmingham, UK
  20. 20 School of Science and Health, Western Sydney University, Sydney, New South Wales, Australia
  21. 21 Oral Health Services, Sydney Local Health District, Sydney, New South Wales, Australia
  22. 22 Qom University of Medical Sciences, Qom, Iran
  23. 23 Education Development Center, Mashhad University of Medical Sciences, Mashhad, Iran
  24. 24 Indian Institute of Public Health, Gandhinagar, India
  25. 25 The Judith Lumley Centre, La Trobe University, Melbourne, Victoria, Australia
  26. 26 General Office for Research and Technological Transfer, Peruvian National Institute of Health, Lima, Peru
  27. 27 School of Public Health, Auckland University of Technology, Auckland, New Zealand
  28. 28 Department of Research, Public Health Perspective Nepal, Pokhara-Lekhnath Metropolitan City, Nepal
  29. 29 School of Psychology, University of Auckland, Auckland, New Zealand
  30. 30 Heidelberg Institute of Global Health (HIGH), Heidelberg University, Heidelberg, Germany
  31. 31 T.H. Chan School of Public Health, Harvard University, Boston, Massachusetts, USA
  32. 32 Department of Psychiatry, Charles R. Drew University of Medicine and Science, Los Angeles, California, USA
  33. 33 Department of Psychiatry and Biobehavioral Sciences, David Geffen School of Medicine, University of California Los Angeles, Los Angeles, California, USA
  34. 34 Department of Community Medicine, Gandhi Medical College Bhopal, Bhopal, India
  35. 35 Social Determinants of Health Research Center, Lorestan University of Medical Sciences, Khorramabad, Iran
  36. 36 Department of Epidemiology and Biostatistics, Lorestan University of Medical Sciences, Khorramabad, Iran
  37. 37 Department of Epidemiology and Psychosocial Research, Ramón de la Fuente Muñiz National Institute of Psychiatry, Mexico City, Mexico
  38. 38 Nuffield Department of Population Health, University of Oxford, Oxford, UK
  39. 39 Department of Internal Medicine, University of São Paulo, São Paulo, Brazil
  40. 40 The George Institute for Global Health, New Delhi, India
  41. 41 Centre for Global Child Health, The Hospital for Sick Children, Toronto, Ontario, Canada
  42. 42 Centre of Excellence in Women and Child Health, Aga Khan University, Karachi, Pakistan
  43. 43 Social Determinants of Health Research Center, Babol University of Medical Sciences, Babol, Iran
  44. 44 Centre for Adolescent Health, Murdoch Childrens Research Institute, Melbourne, Victoria, Australia
  45. 45 School of Population and Global Health, University of Melbourne, Melbourne, Victoria, Australia
  46. 46 Transport & Digital Development, World Bank, Washington, District of Columbia, USA
  47. 47 Transport and Road Safety (TARS) Research Department, University of New South Wales, Sydney, New South Wales, Australia
  48. 48 Institute of Epidemiology, Comenius University, Bratislava, Slovakia
  49. 49 National Institute of Public Health, Cuernavaca, Mexico
  50. 50 School of Medicine, University of the Valley of Cuernavaca, Cuernavaca, Mexico
  51. 51 Department of Population and Health, Metropolitan Autonomous University, Mexico City, Mexico
  52. 52 Department of Medical Epidemiology and Biostatistics, Karolinska Institutet, Stockholm, Sweden
  53. 53 UCIBIO, University of Porto, Porto, Portugal
  54. 54 Colombian National Health Observatory, National Institute of Health, Bogota, Colombia
  55. 55 Epidemiology and Public Health Evaluation Group, National University of Colombia, Bogota, Colombia
  56. 56 National School of Public Health, Carlos III Health Institute, Madrid, Spain
  57. 57 Clinical Epidemiology Program, Ottawa Hospital Research Institute, Ottawa, Ontario, Canada
  58. 58 Department of Biochemistry and Biomedical Science, Seoul National University Hospital, Seoul, South Korea
  59. 59 Department of Pulmonary Medicine, Christian Medical College and Hospital (CMC), Vellore, India
  60. 60 Division of Plastic Surgery, University of Washington, Seattle, Washington, USA
  61. 61 Institute of Public Health Kalyani, Kalyani, India
  62. 62 School of Health Science, Orebro University, Orebro, Sweden
  63. 63 Toxoplasmosis Research Center, Mazandaran University of Medical Sciences, Sari, Iran
  64. 64 Department of General Surgery, Carol Davila University of Medicine and Pharmacy, Bucharest, Romania
  65. 65 Department of Surgery, Clinical Emergency Hospital Sf. Pantelimon, Bucharest, Romania
  66. 66 National Drug and Alcohol Research Centre, University of New South Wales, Sydney, New South Wales, Australia
  67. 67 Australian Institute for Suicide Research and Prevention, Griffith University, Mount Gravatt, Queensland, Australia
  68. 68 Department of Global Health and Infection, Brighton and Sussex Medical School, Brighton, UK
  69. 69 School of Public Health, Addis Ababa University, Addis Ababa, Ethiopia
  70. 70 Department of Nursing, Debre Markos University, Debre Markos, Ethiopia
  71. 71 Centre for Global Child Health, The Hospital for Sick Children, University of Toronto, Toronto, Ontario, Canada
  72. 72 Department of Community Medicine, University of Peradeniya, Peradeniya, Sri Lanka
  73. 73 Center of Excellence in Health Service Management, Nguyen Tat Thanh University, Ho Chi Minh, Vietnam
  74. 74 University of New South Wales, Sydney, New South Wales, Australia
  75. 75 Sydney School of Public Health, University of Sydney, Sydney, New South Wales, Australia
  76. 76 United Nations World Food Programme, New Delhi, India
  77. 77 Department of Public Health Sciences, Karolinska Institutet, Stockholm, Sweden
  78. 78 World Health Programme, Université du Québec en Abitibi-Témiscamingue, Rouyn-Noranda, Quebec, Canada
  79. 79 Department of Pathology, Stavanger University Hospital, Stavanger, Norway
  80. 80 Department of Clinical Pathology, Mansoura University, Mansoura, Egypt
  81. 81 Public Health Department, Saint Paul’s Hospital Millennium Medical College, Addis Ababa, Ethiopia
  82. 82 Multiple Sclerosis Research Center, Tehran University of Medical Sciences, Tehran, Iran
  83. 83 Department of Psychology, Federal University of Sergipe, Sao Cristovao, Brazil
  84. 84 Department of Neurobiology, Care Sciences and Society, Karolinska Institutet, Stockholm, Sweden
  85. 85 Division of Neurology, University of Ottawa, Ottawa, Ontario, Canada
  86. 86 REQUIMTE/LAQV, University of Porto, Porto, Portugal
  87. 87 Psychiatry Department, Kaiser Permanente, Fontana, California, USA
  88. 88 School of Health Sciences, A.T. Still University, Mesa, Arizona, USA
  89. 89 Department of Population Medicine and Health Services Research, Bielefeld University, Bielefeld, Germany
  90. 90 College of Public Health, Medical and Veterinary Science, James Cook University, Douglas, Queensland, Australia
  91. 91 Gene Expression & Regulation Program, The Wistar Institute, Philadelphia, Pennsylvania, USA
  92. 92 Department of Dermatology, Kobe University, Kobe, Japan
  93. 93 Department of Biostatistics, Mekelle University, Mekelle, Ethiopia
  94. 94 Adelaide Medical School, University of Adelaide, Adelaide, South Australia, Australia
  95. 95 Center for Clinical and Epidemiological Research, University of São Paulo, Sao Paulo, Brazil
  96. 96 Internal Medicine Department, University Hospital, University of São Paulo, Sao Paulo, Brazil
  97. 97 School of Medicine, Boston University, Boston, Massachusetts, USA
  98. 98 School of Public Health and Preventive Medicine, Monash University, Melbourne, Victoria, Australia
  99. 99 Department of Epidemiology and Biostatistics, Zhengzhou University, Zhengzhou, China
  100. 100 March of Dimes, Arlington, Virginia, USA
  101. 101 School of Public Health, West Virginia University, Morgantown, West Virginia, USA
  102. 102 Institute for Global Health, University College London, London, UK
  103. 103 Department of Pharmacology, Tehran University of Medical Sciences, Tehran, Iran
  104. 104 Obesity Research Center, Shahid Beheshti University of Medical Sciences, Tehran, Iran
  105. 105 Department of Radiology, Johns Hopkins University, Baltimore, Maryland, USA
  106. 106 Department of Family and Community Medicine, Arabian Gulf University, Manama, Bahrain
  107. 107 School of Health and Environmental Studies, Hamdan Bin Mohammed Smart University, Dubai, United Arab Emirates
  108. 108 Biomedical Research Networking Center for Mental Health Network (CiberSAM), Madrid, Spain
  109. 109 Research and Development Unit, San Juan de Dios Sanitary Park, Sant Boi de Llobregat, Spain
  110. 110 School of Nursing and Midwifery, Tabriz University of Medical Sciences, Tabriz, Iran
  111. 111 Independent Consultant, Tabriz, Iran
  112. 112 Department of Public Health, Mizan-Tepi University, Teppi, Ethiopia
  113. 113 Unit of Epidemiology and Social Medicine, University Hospital Antwerp, Wilrijk, Belgium
  114. 114 Clinical Sciences, Karolinska University Hospital, Stockholm, Sweden
  115. 115 School of Public Health, Curtin University, Perth, Western Australia, Australia
  116. 116 Research Coordination, AC Environments Foundation, Cuernavaca, Mexico
  117. 117 CISS, National Institute of Public Health, Cuernavaca, Mexico
  118. 118 Department of Pediatrics, Dell Medical School, University of Texas Austin, Austin, Texas, USA
  119. 119 Guilan Road Trauma Research Center, Guilan University of Medical Sciences, Rasht, Iran
  120. 120 Social Determinants of Health Research Center, Guilan University of Medical Sciences, Rasht, Iran
  121. 121 Department of Pharmacology and Therapeutics, Dhaka Medical College, Dhaka University, Dhaka, Bangladesh
  122. 122 Department of Pharmacology, Bangladesh Industrial Gases Limited, Tangail, Bangladesh
  123. 123 Faculty of Dentistry, Department of Legal Medicine and Bioethics, Carol Davila University of Medicine and Pharmacy, Bucharest, Romania
  124. 124 Clinical Legal Medicine Department, National Institute of Legal Medicine Mina Minovici, Bucharest, Romania
  125. 125 Department of Epidemiology and Health Statistics, Central South University, Changsha, China
  126. 126 School of Public Health, University of the Western Cape, Bellville, Cape Town, South Africa
  127. 127 Department of Public Health, Walter Sisulu University, Mthatha, South Africa
  128. 128 Department of Community Medicine, University of Ibadan, Ibadan, Nigeria
  129. 129 Research Institute for Endocrine Sciences, Shahid Beheshti University of Medical Sciences, Tehran, Iran
  130. 130 Institute for Physical Activity and Nutrition, Deakin University, Burwood, Victoria, Australia
  131. 131 Sydney Medical School, University of Sydney, Sydney, New South Wales, Australia
  132. 132 Injury Division, The George Institute for Global Health, Newtown, New South Wales, Australia
  133. 133 Department of Global and Community Health, George Mason University, Fairfax, Virginia, USA
  134. 134 School of Management and Medical Education, Shahid Beheshti University of Medical Sciences, Tehran, Iran
  135. 135 Safety Promotion and Injury Prevention Research Center, Shahid Beheshti University of Medical Sciences, Tehran, Iran
  136. 136 Department for Health Care and Public Health, I.M. Sechenov First Moscow State Medical University, Moscow, Russia
  137. 137 Institute of Medicine, University of Colombo, Colombo, Sri Lanka
  138. 138 Faculty of Graduate Studies, University of Colombo, Colombo, Sri Lanka
  139. 139 Department of Community Medicine, Banaras Hindu University, Varanasi, India
  140. 140 Department of Ophthalmology, Heidelberg University, Mannheim, Germany
  141. 141 Beijing Institute of Ophthalmology, Beijing Tongren Hospital, Beijing, China
  142. 142 Social Determinants of Health Research Center, University of Social Welfare and Rehabilitation Sciences, Tehran, Iran
  143. 143 Department of Family Medicine and Public Health, University of Opole, Opole, Poland
  144. 144 Institute of Family Medicine and Public Health, University of Tartu, Tartu, Estonia
  145. 145 Minimally Invasive Surgery Research Center, Iran University of Medical Sciences, Tehran, Iran
  146. 146 Department of Neurology, University of Washington, Seattle, Washington, USA
  147. 147 Hematology-Oncology and Stem Cell Transplantation Research Center, Tehran University of Medical Sciences, Tehran, Iran
  148. 148 Pars Advanced and Minimally Invasive Medical Manners Research Center, Iran University of Medical Sciences, Tehran, Iran
  149. 149 Department of Dermatology, Wolaita Sodo University, Wolaita Sodo, Ethiopia
  150. 150 Non-communicable Diseases Research Unit, Medical Research Council South Africa, Cape Town, South Africa
  151. 151 Department of Medicine, University of Cape Town, Cape Town, South Africa
  152. 152 Department of Public Health and Community Medicine, Jordan University of Science and Technology, Ramtha, Jordan
  153. 153 Social Determinants of Health Research Center, Ahvaz Jundishapur University of Medical Sciences, Ahvaz, Iran
  154. 154 School of Food and Agricultural Sciences, University of Management and Technology, Lahore, Pakistan
  155. 155 Epidemiology and Biostatistics Department, Health Services Academy, Islamabad, Pakistan
  156. 156 Department of Public Health, Imam Muhammad Ibn Saud Islamic University, Riyadh, Saudi Arabia
  157. 157 Department of Health Policy and Management, Johns Hopkins University, Baltimore, Maryland, USA
  158. 158 Clinical Epidemiology Unit, Lund University, Lund, Sweden
  159. 159 Department of Preventive Medicine, Korea University, Seoul, South Korea
  160. 160 Department of Health Sciences, Northeastern University, Boston, Massachusetts, USA
  161. 161 School of Health Sciences, Kristiania University College, Oslo, Norway
  162. 162 CIBERSAM, San Juan de Dios Sanitary Park, Sant Boi de Llobregat, Spain
  163. 163 Catalan Institution for Research and Advanced Studies (ICREA), Barcelona, Spain
  164. 164 Department of Demography, University of Montreal, Montreal, Quebec, Canada
  165. 165 Department of Social and Preventive Medicine, University of Montreal, Montreal, Quebec, Canada
  166. 166 Department of Public Health, Yuksek Ihtisas University, Ankara, Turkey
  167. 167 Department of Public Health, Hacettepe University, Ankara, Turkey
  168. 168 Department of Psychiatry, University of Nairobi, Nairobi, Kenya
  169. 169 Division of Psychology and Language Sciences, University College London, London, UK
  170. 170 School of Dentistry, The University of Queensland, Brisbane, Queensland, Australia
  171. 171 Institute of Health Policy and Development Studies, National Institutes of Health, Manila, Philippines
  172. 172 Department of Community and Family Medicine, University of Baghdad, Baghdad, Iraq
  173. 173 HelpMeSee, New York City, New York, USA
  174. 174 International Relations Department, Mexican Institute of Ophthalmology, Queretaro, Mexico
  175. 175 College of Optometry, Nova Southeastern University, Fort Lauderdale, Florida, USA
  176. 176 School of Public Health, University of Haifa, Haifa, Israel
  177. 177 Department of General Surgery, Aintree University Hospital National Health Service (NHS) Foundation Trust, Liverpool, UK
  178. 178 Department of Surgery, University of Liverpool, Liverpool, UK
  179. 179 Anesthesiology, Pain and Intensive Care Department, Federal University of São Paulo, Sao Paulo, Brazil
  180. 180 Radiology Department, Mansoura Faculty of Medicine, Mansoura, Egypt
  181. 181 Ophthalmology Department, Aswan Faculty of Medicine, Aswan, Egypt
  182. 182 Institute of Medicine, Tribhuvan University, Kathmandu, Nepal
  183. 183 Department of Public Health, Trnava University, Trnava, Slovakia
  184. 184 Department of Primary Care and Public Health, Imperial College London, London, UK
  185. 185 Digestive Diseases Research Institute, Tehran University of Medical Sciences, Tehran, Iran
  186. 186 Non-communicable Diseases Research Center, Shiraz University of Medical Sciences, Shiraz, Iran
  187. 187 Department of Humanities and Social Sciences, Indian Institute of Technology, Roorkee, Haridwar, India
  188. 188 Department of Development Studies, International Institute for Population Sciences, Mumbai, India
  189. 189 Department of Maternal and Child Nursing and Public Health, Federal University of Minas Gerais, Belo Horizonte, Brazil
  190. 190 Surgery Department, Emergency University Hospital Bucharest, Bucharest, Romania
  191. 191 Department of Epidemiology and Biostatistics, Tehran University of Medical Sciences, Tehran, Iran
  192. 192 Research Department, The George Institute for Global Health, New Delhi, India
  193. 193 School of Medicine, University of New South Wales, Sydney, New South Wales, Australia
  194. 194 School of Public Health, Bahir Dar University, Bahir Dar, Ethiopia
  195. 195 Neurology Department, Janakpuri Super Specialty Hospital Society, New Delhi, India
  196. 196 Neurology Department, Govind Ballabh Institute of Medical Education and Research, New Delhi, India
  197. 197 Department of Medical Laboratory Sciences, Bahir Dar University, Bahir Dar, Ethiopia
  198. 198 Peru Country Office, United Nations Population Fund (UNFPA), Lima, Peru
  199. 199 Department of Epidemiology and Biostatistics, Haramaya University, Harar, Ethiopia
  200. 200 Breast Surgery Unit, Helsinki University Hospital, Helsinki, Finland
  201. 201 University of Helsinki, Helsinki, Finland
  202. 202 Neurocenter, Helsinki University Hospital, Helsinki, Finland
  203. 203 School of Health Sciences, University of Melbourne, Melbourne, Victoria, Australia
  204. 204 Clinical Microbiology and Parasitology Unit, Zora Profozic Polyclinic, Zagreb, Croatia
  205. 205 University Centre Varazdin, University North, Varazdin, Croatia
  206. 206 Department of Propedeutics of Internal Diseases & Arterial Hypertension, Pomeranian Medical University, Szczecin, Poland
  207. 207 Pacific Institute for Research & Evaluation, Calverton, Maryland, USA
  208. 208 Achutha Menon Centre for Health Science Studies, Sree Chitra Tirunal Institute for Medical Sciences and Technology, Trivandrum, India
  209. 209 Global Institute of Public Health (GIPH), Ananthapuri Hospitals and Research Centre, Trivandrum, India
  210. 210 Faculty of Internal Medicine, Kyrgyz State Medical Academy, Bishkek, Kyrgyzstan
  211. 211 Department of Atherosclerosis and Coronary Heart Disease, National Center of Cardiology and Internal Disease, Bishkek, Kyrgyzstan
  212. 212 Institute of Addiction Research (ISFF), Frankfurt University of Applied Sciences, Frankfurt, Germany
  213. 213 Department of Biostatistics, Hamadan University of Medical Sciences, Hamadan, Iran
  214. 214 Hamadan University of Medical Sciences, Hamadan, Iran
  215. 215 Health Systems and Policy Research Unit, Ahmadu Bello University, Zaria, Nigeria
  216. 216 Faculty of Life Sciences and Medicine, King’s College London, London, UK
  217. 217 Clinical Epidemiology and Public Health Research Unit, Burlo Garofolo Institute for Maternal and Child Health, Trieste, Italy
  218. 218 Department of Biomedical and Dental Sciences and Morphofunctional Imaging, University of Messina, Messina, Italy
  219. 219 Department of Neurology, Oasi Research Institute, Troina, Italy
  220. 220 Department of Public Health Sciences, University of Miami, Miami, Florida, USA
  221. 221 Center for Health Systems Research, National Institute of Public Health, Cuernavaca, Mexico
  222. 222 Department of Public Health Medicine, University of KwaZulu-Natal, Durban, South Africa
  223. 223 Health Sciences Research Center, Mazandaran University of Medical Sciences, Sari, Iran
  224. 224 Social Determinants of Health Research Center, Kurdistan University of Medical Sciences, Sanandaj, Iran
  225. 225 Department of Epidemiology and Biostatistics, Kurdistan University of Medical Sciences, Sanandaj, Iran
  226. 226 Preventive Medicine and Public Health Research Center, Iran University of Medical Sciences, Tehran, Iran
  227. 227 International Laboratory for Air Quality and Health, Queensland University of Technology, Brisbane, Queensland, Australia
  228. 228 Gorgas Memorial Institute for Health Studies, Panama City, Panama
  229. 229 Department of Surgery, University of Washington, Seattle, Washington, USA
  230. 230 1st Department of Ophthalmology, University of Athens, Athens, Greece
  231. 231 Biomedical Research Foundation, Academy of Athens, Athens, Greece
  232. 232 Health Management Reserach Center, Baqiyatallah University of Medical Sciences, Tehran, Iran
  233. 233 Department of Health Management and Economics, Tehran University of Medical Sciences, Tehran, Iran
  234. 234 Department of Pediatrics, University of British Columbia, Vancouver, British Columbia, Canada
  235. 235 School of Medical Sciences, Science University of Malaysia, Kubang Kerian, Malaysia
  236. 236 Department of Epidemiology, University of Alabama at Birmingham, Birmingham, Alabama, USA
  237. 237 Department of Epidemiology & Biostatistics, Kermanshah University of Medical Sciences, Kermanshah, Iran
  238. 238 Suraj Eye Institute, Nagpur, India
  239. 239 Hospital of the Federal University of Minas Gerais, Federal University of Minas Gerais, Belo Horizonte, Brazil
  240. 240 Cochrane South Africa, South African Medical Research Council, Cape Town, South Africa
  241. 241 General Surgery Department, Emergency Hospital of Bucharest, Bucharest, Romania
  242. 242 Center of Excellence in Behavioral Medicine, Nguyen Tat Thanh University, Ho Chi Minh, Vietnam
  243. 243 Institute for Global Health Innovations, Duy Tan University, Hanoi, Vietnam
  244. 244 Public Health Department, Universitas Negeri Semarang, Kota Semarang, Indonesia
  245. 245 Graduate Institute of Biomedical Informatics, Taipei Medical University, Taipei City, Taiwan
  246. 246 Clinical Pharmacy Unit, Mekelle University, Mekelle, Ethiopia
  247. 247 Centre of Cardiovascular Research and Education in Therapeutics, Monash University, Melbourne, Victoria, Australia
  248. 248 Independent Consultant, Accra, Ghana
  249. 249 Translational Health Research Institute, Western Sydney University, Penrith, New South Wales, Australia
  250. 250 Department of Preventive Medicine, Kyung Hee University, Dongdaemun-gu, South Korea
  251. 251 HAST, Human Sciences Research Council, Durban, South Africa
  252. 252 School of Public Health, Faculty of Health Sciences, University of Namibia, Osakhati, Namibia
  253. 253 Department of Psychiatry and Behavioural Neurosciences, McMaster University, Hamilton, ON, Canada
  254. 254 Department of Psychiatry, University of Lagos, Lagos, Nigeria
  255. 255 Department of Pathology and Molecular Medicine, McMaster University, Hamilton, Ontario, Canada
  256. 256 Institute of Physical Activity and Health, Autonomous University of Chile, Talca, Chile
  257. 257 Applied Research Division, Public Health Agency of Canada, Ottawa, Ontario, Canada
  258. 258 School of Psychology, University of Ottawa, Ottawa, Ontario, Canada
  259. 259 Analytical Center, Moscow Institute of Physics and Technology, Dolgoprudny, Russia
  260. 260 Committee for the Comprehensive Assessment of Medical Devices and Information Technology, Health Technology Assessment Association, Moscow, Russia
  261. 261 Department of Respiratory Medicine, Jagadguru Sri Shivarathreeswara Academy of Health Education and Research, Mysore, India
  262. 262 Department of Medicine, Ottawa Hospital Research Institute, University of Ottawa, Ottawa, Ontario, Canada
  263. 263 Department of Medical Humanities and Social Medicine, Kosin University, Busan, South Korea
  264. 264 Department of Paediatrics, University of Melbourne, Melbourne, Victoria, Australia
  265. 265 Population Health Department, Murdoch Childrens Research Institute, Melbourne, Victoria, Australia
  266. 266 School of Optometry and Vision Science, University of New South Wales, Sydney, New South Wales, Australia
  267. 267 Shanghai Mental Health Center, Shanghai Jiao Tong University, Shanghai, China
  268. 268 Department of Psychiatry, Department of Epidemiology, Columbia University, New York City, New York, USA
  269. 269 Department of Nephrology, Sanjay Gandhi Postgraduate Institute of Medical Sciences, Lucknow, India
  270. 270 College of Medicine, University of Central Florida, Orlando, Florida, USA
  271. 271 College of Graduate Health Sciences, A.T. Still University, Mesa, Arizona, USA
  272. 272 Department of Epidemiology & Biostatistics, Contech School of Public Health, Lahore, Pakistan
  273. 273 Department of Immunology, Mazandaran University of Medical Sciences, Sari, Iran
  274. 274 Molecular and Cell Biology Research Center, Mazandaran University of Medical Sciences, Sari, Iran
  275. 275 Faculty of Medicine, Mazandaran University of Medical Sciences, Sari, Iran
  276. 276 Sina Trauma and Surgery Research Center, Tehran University of Medical Sciences, Tehran, Iran
  277. 277 School of Nursing and Healthcare Professions, Federation University, Heidelberg, Victoria, Australia
  278. 278 National Centre for Farmer Health, Deakin University, Waurn Ponds, Victoria, Australia
  279. 279 Society for Health and Demographic Surveillance, Suri, India
  280. 280 Department of Economics, University of Göttingen, Göttingen, Germany
  281. 281 Department of Pharmacology, Shahid Beheshti University of Medical Sciences, Tehran, Iran
  282. 282 Academic Public Health Department, Public Health England, London, UK
  283. 283 WHO Collaborating Centre for Public Health Education and Training, Imperial College London, London, UK
  284. 284 University College London Hospitals, London, UK
  285. 285 School of Social Sciences and Psychology, Western Sydney University, Penrith, New South Wales, Australia
  286. 286 Brien Holden Vision Institute, Sydney, New South Wales, Australia
  287. 287 Organization for the Prevention of Blindness, Paris, France
  288. 288 Kermanshah University of Medical Sciences, Kermanshah, Iran
  289. 289 Department of Clinical Research, Federal University of Uberlândia, Uberlândia, Brazil
  290. 290 Golestan Research Center of Gastroenterology and Hepatology, Golestan University of Medical Sciences, Gorgan, Iran
  291. 291 National Institute for Research in Environmental Health, Indian Council of Medical Research, Bhopal, India
  292. 292 College of Medicine, University of Sharjah, Sharjah, United Arab Emirates
  293. 293 Social Development & Health Promotion Research Center, Kermanshah University of Medical Sciences, Kermanshah, Iran
  294. 294 Health and Disability Intelligence Group, Ministry of Health, Wellington, New Zealand
  295. 295 Department of Entomology, Ain Shams University, Cairo, Egypt
  296. 296 Department of Surgery, Marshall University, Huntington, West Virginia, USA
  297. 297 Department of Nutrition and Preventive Medicine, Case Western Reserve University, Cleveland, Ohio, USA
  298. 298 Rheumatology Department, University Hospitals Bristol NHS Foundation Trust, Bristol, UK
  299. 299 Institute of Bone and Joint Research, University of Sydney, Syndey, New South Wales, Australia
  300. 300 Institute of Social Medicine, University of Belgrade, Belgrade, Serbia
  301. 301 Centre-School of Public Health and Health Management, University of Belgrade, Belgrade, Serbia
  302. 302 UGC Centre of Advanced Study in Psychology, Utkal University, Bhubaneswar, India
  303. 303 Udyam-Global Association for Sustainable Development, Bhubaneswar, India
  304. 304 Department of Public Health Sciences, University of North Carolina at Charlotte, Charlotte, North Carolina, USA
  305. 305 School of Public Health, Imperial College London, London, UK
  306. 306 Market Access Department, Bayer, Istanbul, Turkey
  307. 307 School of Health Sciences, Federal University of Santa Catarina, Ararangua, Brazil
  308. 308 Department of Psychology, University of Alabama at Birmingham, Birmingham, Alabama, USA
  309. 309 Department of Psychiatry, Stellenbosch University, Cape Town, South Africa
  310. 310 Independent Consultant, Karachi, Pakistan
  311. 311 School of Medicine, Dezful University of Medical Sciences, Dezful, Iran
  312. 312 School of Medicine, Alborz University of Medical Sciences, Karaj, Iran
  313. 313 Chronic Diseases (Home Care) Research Center, Hamadan University of Medical Sciences, Hamadan, Iran
  314. 314 Centre for Medical Informatics, University of Edinburgh, Edinburgh, UK
  315. 315 Division of General Internal Medicine and Primary Care, Harvard University, Boston, Massachusetts, USA
  316. 316 Center for Pediatric Trauma Research, Research Institute at Nationwide Children’s Hospital, Columbus, Ohio, USA
  317. 317 National Institute of Infectious Diseases, Tokyo, Japan
  318. 318 Finnish Institute of Occupational Health, Helsinki, Finland
  319. 319 Institute of Medical Epidemiology, Martin Luther University Halle-Wittenberg, Halle, Germany
  320. 320 Department of Medicine, University of Alabama at Birmingham, Birmingham, Alabama, USA
  321. 321 Medicine Service, US Department of Veteran Affairs, Birmingham, Alabama, USA
  322. 322 Department of Epidemiology, School of Preventive Oncology, Patna, India
  323. 323 Department of Epidemiology, Healis Sekhsaria Institute for Public Health, Mumbai, India
  324. 324 Department of Diseases and Noncommunicable Diseases and Health Promotion, Federal Ministry of Health, Brasilia, Brazil
  325. 325 Hospital Universitario de la Princesa, Autonomous University of Madrid, Madrid, Spain
  326. 326 Centro de Investigación Biomédica en Red Enfermedades Respiratorias (CIBERES), Madrid, Spain
  327. 327 Department of Research Development, Federal Research Institute for Health Organization and Informatics of the Ministry of Health (FRIHOI), Moscow, Russia
  328. 328 Hull York Medical School, University of Hull, Hull City, UK
  329. 329 Usher Institute of Population Health Sciences and Informatics, University of Edinburgh, Edinburgh, UK
  330. 330 Federal Research Institute for Health Organization and Informatics of the Ministry of Health (FRIHOI), Moscow, Russia
  331. 331 Department of Psychiatry and Mental Health, University of Cape Town, Cape Town, South Africa
  332. 332 Department of Psychology, Deakin University, Burwood, Victoria, Australia
  333. 333 Department of Community Medicine, Ahmadu Bello University, Zaria, Nigeria
  334. 334 Department of Anesthesiology & Pain Medicine, University of Washington, Seattle, Washington, USA
  335. 335 Department of Criminology, Law and Society, University of California Irvine, Irvine, California, USA
  336. 336 Department of Medicine, University of Valencia, Valencia, Spain
  337. 337 Carlos III Health Institute, Biomedical Research Networking Center for Mental Health Network (CiberSAM), Madrid, Spain
  338. 338 School of Social Work, University of Illinois, Urbana, Illinois, USA
  339. 339 Department of Community Medicine, Iran University of Medical Sciences, Tehran, Iran
  340. 340 Institute of Public Health, University of Gondar, Gondar, Ethiopia
  341. 341 School of Public Health, University of Adelaide, Adelaide, South Australia, Australia
  342. 342 School of Public Health, Post Graduate Institute of Medical Education and Research, Chandigarh, India
  343. 343 Molecular Medicine and Pathology Department, University of Auckland, Auckland, New Zealand
  344. 344 Clinical Hematology and Toxicology, Military Medical University, Hanoi, Vietnam
  345. 345 Department of Health Economics, Hanoi Medical University, Hanoi, Vietnam
  346. 346 Lee Kong Chian School of Medicine, Nanyang Technological University, Singapore
  347. 347 Division of Health Sciences, University of Warwick, Coventry, UK
  348. 348 Department of Community Medicine, University of Nigeria Nsukka, Enugu, Nigeria
  349. 349 Argentine Society of Medicine, Buenos Aires, Argentina
  350. 350 Velez Sarsfield Hospital, Buenos Aires, Argentina
  351. 351 Central Research Institute of Cytology and Genetics, Federal Research Institute for Health Organization and Informatics of the Ministry of Health (FRIHOI), Moscow, Russia
  352. 352 Department of Statistics, University of Brasília, Brasília, Brazil
  353. 353 Directorate of Social Studies and Policies, Federal District Planning Company, Brasília, Brazil
  354. 354 Raffles Neuroscience Centre, Raffles Hospital, Singapore
  355. 355 Yong Loo Lin School of Medicine, National University of Singapore, Singapore
  356. 356 Department of Medical and Surgical Sciences, University of Bologna, Bologna, Italy
  357. 357 Occupational Health Unit, Sant’Orsola Malpighi Hospital, Bologna, Italy
  358. 358 Department of Health Care Administration and Economics, National Research University Higher School of Economics, Moscow, Russia
  359. 359 Foundation University Medical College, Foundation University, Islamabad, Pakistan
  360. 360 Department of Psychiatry, University of São Paulo, São Paulo, Brazil
  361. 361 Department of Psychology and Counselling, University of Melbourne, Melbourne, Victoria, Australia
  362. 362 Department of Medicine, University of Melbourne, St Albans, Victoria, Australia
  363. 363 Institute of Health and Society, University of Oslo, Oslo, Norway
  364. 364 Department of Neurology, Technical University of Munich, Munich, Germany
  365. 365 Centre for the Study of Regional Development, Jawahar Lal Nehru University, New Delhi, India
  366. 366 Department of Preventive Medicine, Northwestern University, Chicago, Illinois, USA
  367. 367 Centre for Suicide Research and Prevention, University of Hong Kong, Hong Kong, China
  368. 368 Department of Social Work and Social Administration, University of Hong Kong, Hong Kong, China
  369. 369 School of Allied Health Sciences, Addis Ababa University, Addis Ababa, Ethiopia
  370. 370 Department of Psychopharmacology, National Center of Neurology and Psychiatry, Tokyo, Japan
  371. 371 Health Economics & Finance, Jackson State University, Jackson, Mississippi, USA
  372. 372 School of Medicine, Tsinghua University, Beijing, China
  373. 373 Department of Epidemiology and Biostatistics, Wuhan University, Wuhan, China
  374. 374 Global Health Institute, Wuhan University, Wuhan, China
  375. 375 Department of Obstetrics & Gynaecology, A.C.S. Medical College and Hospital, Islamabad, Pakistan
  376. 376 Department of Epidemiology, University Hospital of Setif, Setif, Algeria
  377. 377 Maternal and Child Health Division, International Centre for Diarrhoeal Disease Research, Dhaka, Bangladesh
  378. 378 Department of Medicine, Monash University, Melbourne, Victoria, Australia
  379. 379 Student Research Committee, Babol University of Medical Sciences, Babol, Iran
  380. 380 School of Public Health and Management, Chongqing Medical University, Chongqing, China
  381. 381 Indian Institute of Public Health, Public Health Foundation of India, Gurugram, India
  382. 382 Department of Health Metrics Sciences, School of Medicine, University of Washington, Seattle, Washington, USA
  383. 383 University of Melbourne, Melbourne, Queensland, Australia
  1. Correspondence to Dr Spencer L James, Institute for Health Metrics and Evaluation, University of Washington, Seattle, WA 98121, USA; spencj{at}uw.edu

Abstract

Background The epidemiological transition of non-communicable diseases replacing infectious diseases as the main contributors to disease burden has been well documented in global health literature. Less focus, however, has been given to the relationship between sociodemographic changes and injury. The aim of this study was to examine the association between disability-adjusted life years (DALYs) from injury for 195 countries and territories at different levels along the development spectrum between 1990 and 2017 based on the Global Burden of Disease (GBD) 2017 estimates.

Methods Injury mortality was estimated using the GBD mortality database, corrections for garbage coding and CODEm—the cause of death ensemble modelling tool. Morbidity estimation was based on surveys and inpatient and outpatient data sets for 30 cause-of-injury with 47 nature-of-injury categories each. The Socio-demographic Index (SDI) is a composite indicator that includes lagged income per capita, average educational attainment over age 15 years and total fertility rate.

Results For many causes of injury, age-standardised DALY rates declined with increasing SDI, although road injury, interpersonal violence and self-harm did not follow this pattern. Particularly for self-harm opposing patterns were observed in regions with similar SDI levels. For road injuries, this effect was less pronounced.

Conclusions The overall global pattern is that of declining injury burden with increasing SDI. However, not all injuries follow this pattern, which suggests multiple underlying mechanisms influencing injury DALYs. There is a need for a detailed understanding of these patterns to help to inform national and global efforts to address injury-related health outcomes across the development spectrum.

  • epidemiology
  • descriptive epidemiology
  • burden of disease
https://creativecommons.org/licenses/by/4.0/

This is an open access article distributed in accordance with the Creative Commons Attribution 4.0 Unported (CC BY 4.0) license, which permits others to copy, redistribute, remix, transform and build upon this work for any purpose, provided the original work is properly cited, a link to the licence is given, and indication of whether changes were made. See: https://creativecommons.org/licenses/by/4.0/.

Statistics from Altmetric.com

Request Permissions

If you wish to reuse any or all of this article please use the link below which will take you to the Copyright Clearance Center’s RightsLink service. You will be able to get a quick price and instant permission to reuse the content in many different ways.

Introduction

Injury is an important cause of morbidity and mortality in nations at any point of the development spectrum. Previous research has shown that in 2015, injuries accounted for 11% of the global burden of disease, expressed in disability-adjusted life years (DALYs), with an estimated 973 million people sustaining injuries warranting some type of healthcare and 4.7 million deaths.1 Globally, since 1990, focused injury burden research has documented a declining trend in the burden of injury of all the major causes of injury.2

The epidemiological transition of non-communicable diseases (NCDs) replacing infectious diseases as the main contributors to disease burden has been well-documented.1 3 4 However, less focus has been given to the relationship between sociodemographic changes and injury outcomes. Up till now, few studies have been performed that studied the relationship between sociodemographic changes and overall injury rates. There have been reports on the associations of gross domestic product and unemployment with suicides, homicides, road injury and unintentional injuries.5–12 However, these studies focused on one specific cause of injury and on one type of injury outcome, mostly mortality. The findings of these studies indicated that the relationship between economic development and injury burden is not straightforward and mediated by many factors. A better understanding of this relationship may be achieved by investigating all causes of injury as well as looking at both fatal and non-fatal injury outcome.

Insight into the epidemiological transitions with regard to injuries can be achieved by a systematic analysis of the relationship between development and trends in mortality, incidence and burden of disease using a standardised approach. A systematic analysis may also reveal where health gains outpace or fall behind changes in development and allow for the identification of determinants and mediating factors of injury burden. This information allows identification determinants of injury burden. This information serves as a crucial input for guiding health system investments and priority-setting at the global, regional, national and subnational levels.

The Global Burden of Disease (GBD) 2015 study introduced a measure of development, the Socio-demographic Index (SDI). SDI combines information on income per capita, education and fertility. Comparisons between DALYs and SDI showed that age-standardised DALY rates for many communicable diseases declined profoundly over time, whereas improvements in SDI correlated strongly with the increasing importance of NCDs.4

This paper aims to provide an overview of injury mortality, incidence and DALYs from the GBD 2017 study, with detailed information on a range of causes of injuries; to examine the association between years of life lost (YLLs), YLDs and DALYs from injury and development, as measured by SDI, cause of injury, GBD region and over time; and to assess in which regions injury DALYs outpace or fall behind changes in development.

Methods

GBD 2017 study

The GBD 2017 study methods and results have been described in extensive detail elsewhere, including description of the analytical estimation framework used to measure deaths, YLLs, YLDs and DALYs.4 13 14 A summary overview of the GBD study is provided in online supplementary appendix 1. The methodological components specific to injuries estimation and SDI calculation are summarised below.

Injury incidence and death are defined as ICD-9 codes E800–E999 and ICD-10 chapters V–Y, except for deaths and cases of drug overdoses and unintentional alcohol poisoning, which are classified under drug and alcohol use disorders. These external cause-of-injury codes or ‘E codes’ are designated as mutually exclusive and collectively exhaustive within the injuries estimation process. In terms of the nature-of-injury codes (eg, the lower extremity amputation that can occur with a road injury), injuries were categorised into 47 mutually exclusive and collectively exhaustive nature-of-injury categories using chapters S and T in International Classification of Disease (ICD) ICD-10 and codes 800–999 in ICD-9 to quantify the various disabling outcomes of each cause of injury. Some injuries are trivial and unlikely to account for an important number of DALYs; hence, we only included injuries in our morbidity analysis that warranted some form of healthcare.

Injury mortality and YLLs

The overall approach to estimate causes of death is provided in related publications.13 15 16 A summary is as follows. We first mapped data sources using different versions of ICD or alternative classification systems to the GBD cause list. These data sources included vital registration, verbal autopsy, mortality surveillance, censuses, surveys, hospitals, police records and mortuary data. We then made adjustments for ill-defined causes of death such that they mapped to an underlying cause of death. Next, we conducted ensemble models using GBD cause of death ensemble modelling (CODEm) software to estimate cause-specific mortality by age, sex, country, year and cause. CODEm is described in more detail elsewhere but in summary explores a large variety of possible models to estimate trends in causes of death using an algorithm to select varying combinations of covariates that are run through several modelling classes. The method then creates an ensemble of best-performing models that are determined by evaluating out-of-sample predictive validity. Deaths are then rescaled for each cause so that the sum equals the number of deaths from all causes to ensure internal consistency. YLLs were calculated by multiplying deaths by the residual life expectancy at the age of death based on the GBD 2017 standard model life table.12

Injury incidence, prevalence and years lived with disability

Our method for estimating the incidence, prevalence and years lived with disability in non-fatal injury outcomes is provided in other GBD publications.2 14 A summary is as follows. We used DisMod-MR V.2.1 (a meta-regression tool for epidemiological modelling) to model injury incidence using data from emergency department and hospital records and survey data to produce cause-of-injury incidence by location, year, age and sex. Across every injury cause model, we used national income per capita as a covariate on excess mortality, which forces a negative relationship between income and mortality to take into account higher case fatality in lower-resource settings. After modelling incidence of each cause of injury, we used a severity hierarchy to identify the nature-of-injury category that would lead to the most long-term burden when an individual experiences multiple injuries. This hierarchy is based on pooled data sets of follow-up studies in which we translated each individual’s health status measure at 1 year after injury into a disability weight. This process is described in more detail in the GBD literature.12 14 17–22 Then, we generated matrices of the proportions of each cause of injury that are expected to lead to each nature of injury as determined in dual-coded (eg, both cause-of-injury and nature-of-injury coded) hospital and emergency department data sets and data from the Chinese National Injury Surveillance System.23 These data sets were used because the data were available in microdata format and they included dual-coded data in the format required for this specific part of the analysis. The resulting cause–nature matrices varied by injury warranting hospital admission versus injury warranting other healthcare, high-income/low-income countries, male/female and age group. In the next stage, we estimated short-term disability by cause and nature‐of‐injury category based on average duration for treated cases for each nature-of-injury category and for inpatient and outpatient injuries from the Dutch Injury Surveillance System.17 18 For 19 of the 47 nature-of-injury categories (eg, foreign body in ear, poisoning and fracture in ear), we supplemented these estimates with expert-driven estimates of short-term duration for nature-of-injury categories when the data set had insufficient information. For untreated injuries, the average factor by which the duration of short-term injury outcomes is increased for a given nature-of-injury category when the injury goes untreated was estimated.

For longer-term injuries, we calculated the proportion of injuries that would result in disability lasting more than a year for each nature-of-injury category by admission status and age. This calculation was based on an assumption that disability from injury affects all cases in the short term with a proportion having persistent disability 1 year after the injury greater than the pre-injury health status. These probabilities of developing permanent health loss were based on a pooled data set of seven large follow-up studies from China, the Netherlands and the USA that used patient-reported outcome measures to assess health status.17–22 24 25 We used the GBD healthcare access and quality (HAQ) index to estimate the ratio of treated to untreated injuries for each country–year grouping.26 The HAQ index is scaled from 0 to 100 and is based on 32 causes of death, covering a range of health service areas, which should not occur if effective care is present. Finally, we used DisMod-MR V.2.1 to compute the long-term prevalence (ie, 1 year or more) for each cause–nature combination from incidence, which also incorporated increased mortality risk of certain nature of injuries, such as traumatic brain injury based on meta-analyses of studies providing standardised mortality ratios of these conditions. YLDs were calculated as prevalence of a health state multiplied by a disability weight. These estimates were then corrected for comorbidity with other non-fatal diseases using methods described elsewhere in the GBD study.13

Socio-demographic Index

SDI is a composite indicator that includes income per capita, average educational attainment over age 15 years and total fertility rate under age 25 years. The SDI has a value that ranges from 0 to 1. 0 represents the lowest income per capita, lowest educational attainmentand highest fertility under age 25 years observed across all GBD geographies from 1980 to 2017. 1 represents the highest income per capita, highest educational attainment and lowest fertility under 25 years observed across all GBD geographies from 1980 to 2017. The average relationship between YLLs, YLDs and YLDs divided by DALYs was calculated with SDI using Gaussian process regression modelling. We used these estimates of expected DALY rates that were predicted based on the full range of SDI to determine whether observed health patterns deviated from trends associated with changes along the development spectrum.

GATHER compliance

This study complies with the GATHER (Guidelines for Accurate and Transparent Health Estimates Reporting) recommendations (online supplementary appendix 2).

Results

Mortality, incidence and burden of injury, 2017

In 2017, worldwide 55.9 million (95% Uncertainty Interval (UI) 55.4 to 56.5 million) people died. Of these deaths, 4.5 million (95% UI 4.3 to 4.6 million), 8.0% (95% UI 7.7% to 8.2%), were due to injuries. Major causes of injury deaths were road injury (27.7%), self-harm (17.7%), falls (15.5%) and interpersonal violence (9.0%).

There were 521 million (95% UI 493 to 548 million) cases of non-fatal injuries in 2017, representing an increase of 167 million from the 354 million (95% UI 338 to 372 million) cases of non-fatal injuries in 1990. The global age-standardised injury death rate was 57.9 per 100 000 (95% UI 55.9 to 59.2), with highest death rates for road injury (15.8 deaths per 100 000 (95% UI 15.2 to 16.3)), self-harm (10.0 deaths per 100 000 (95% UI 9.4 to 10.3)) and falls (9.2 deaths per 100 000 (95% UI 8.5 to 9.8)) (see online supplementary appendix table 1). Injury death rates were over twice as high in men compared with women (80.9 per 100 000 (95% UI 77.7 to 83.0) and 35.5 per 100 000 (95% UI 33.9 to 36.5), respectively). The global age-standardised injury incidence rate was 6762.6 per 100 000 (95% UI 6412.0 to 7118.1)), with highest incidence rates for falls (2237.6 new cases per 100 000 (95% UI 1989.7 to 2532.3)) and mechanical forces (943.6 new cases per 100 000 (95% UI 808.7 to 1100.6)) (see online supplementary appendix table 1). Injury incidence rates were almost twice as high in men compared with women (7827.1 per 100 000 (95% UI 7435.3 to 8242.9) and 5654.5 per 100 000 (95% UI 5351.3 to 5962.1), respectively).

Injuries contributed 10.1% (9.7%–10.5%) to the global burden of disease in 2017 (3267.0 DALYs per 100 000 (95% UI 3058.2 to 3505.1)). YLLs were responsible for the majority of the injury DALYs (77%; 2548 YLLs per 100 000 (95% UI 2462 to 2610)). The main contributors to injury DALYs were road injuries (871.1 DALYs per 100 000 (95% UI 827.9 to 917.3); 26.7%), falls (459.5 DALYs per 100 000 (95% UI 387.1 to 547.5); 14.1%), self-harm (429.0 per 100 000 (95% UI 401.6 to 443.5); 13.1%), interpersonal violence (334.3 DALYs per 100 000 (95% UI 304.7 to 360.5); 10.2%) and drowning (230.0 DALYs per 100 000 (95% UI 219.1 to 241.2); 7.0%) (see online supplementary appendix table 2). The injury burden was highest in Syria (16 341.1 DALYs per 100 000 (95% UI 15 892.7 to 16 858.4), Central African Republic (11 012.7 DALYs per 100 000 (95% UI 8807.9 to 12 913.8)) and Lesotho (7951.3 DALYs per 100 000 (95% UI 6424.8 to 9407.4)) and lowest in Maldives (1282.4 DALYs per 100 000 (95% UI 1138.1 to 1572.9)), Bermuda (1432.2 DALYs per 100 000 (95% UI 1267.5 to 1606.7)) and Italy (1458.1 DALYs per 100 000 (95% UI 1237.2 to 1739.4)) (see online supplementary appendix table 3. SDI level for each country in 2017 is also provided).

Change over time

Between 1990 and 2017, the age-standardised injury DALY rates have declined from 4946 (95% UI 4655 to 5233) to 3267 DALYs (95% UI 3058 to 3505) per 100 000, with largest absolute declines in drowning (from 635 (95% UI 571 to 689) to 230 (95% UI 219 to 241) DALYs per 100 000), road injuries (from 1259 (95% UI 1182 to 1330) to 871 (95% UI 828 to 917) DALYs per 100 000), self-harm (from 687 (95% UI 621 to 723) to 429 (95% UI 402 to 443) DALYs per 100 000), and fire, heat and hot substances (from 197 (95% UI 157 to 228) to 111 (95% UI 93 to 129) DALYs per 100 000). Between 1990 and 2017, the age-standardised rates of YLDs and YLLs from injuries declined by 7.8% and 38.8%, respectively, while incidence of injuries only declined by 0.9%.

Burden of injury by SDI level

The contribution of cause-of-injury category DALY rates to the total injury DALY rates differed by year, age category, sex and SDI level. The largest disparity in DALY rate by SDI level was found in 0–6 days olds, ranging from a high of 52 374 DALYs per 100 000 in the lowest SDI quintile to a low of 6109 DALYs per 100 000 in the highest SDI quintile. In men aged 15–49 years, conflict and terrorism stands out because of the high difference between highest and lowest DALY rates by level of SDI (countries with low SDI 496 DALYs (95% UI 414 to 589) per 100 000; countries with high SDI 2 DALYs (95% UI 1 to 2) per 100 000).

YLL and YLD rates by SDI level

For many causes of injury, age-standardised YLL and YLD rates declined strikingly with increasing SDI, with proportionally largest decreases in YLL rates for conflict and terrorism (low SDI level 163.4 YLLs per 100 000; high SDI level 0.06 YLLs per 100 000), animal contact (low SDI level 140.0 YLLs per 100 000; high SDI level 2 YLLs per 100 000) and other unintentional injuries (low SDI level 7993 YLLs per 100 000; high SDI level 8.4 YLLs per 100 000). Figure 1 shows the level of age-standardised YLLs and YLDs per 100 000 against SDI (all regions, all years 1990–2017) by cause-of-injury. Largest decreases in YLD rates were seen for cause-of-injury categories conflict and terrorism, exposure to forces of nature and adverse effects of medical treatment. Exceptions were road injuries, self-harm and interpersonal violence. The age-standardised YLL rate of road injuries was highest at the low-middle range SDI levels and lowest at higher SDI levels, whereas YLDs from road injuries increased at higher SDI. The age-standardised road injuries YLL rate increased from low SDI to low-middle SDI, but declined at higher levels of SDI. For falls, at higher levels of SDI, the composition of the disease burden shifted towards YLDs as the primary driver of DALYs. YLLs made up 63%, 61% and 20% of DALYs from falls in low, middle and high SDI quintiles, respectively. For road injuries, the proportion of YLLs dropped from 91% in countries with low SDI to 70% in countries with high SDI.

Figure 1

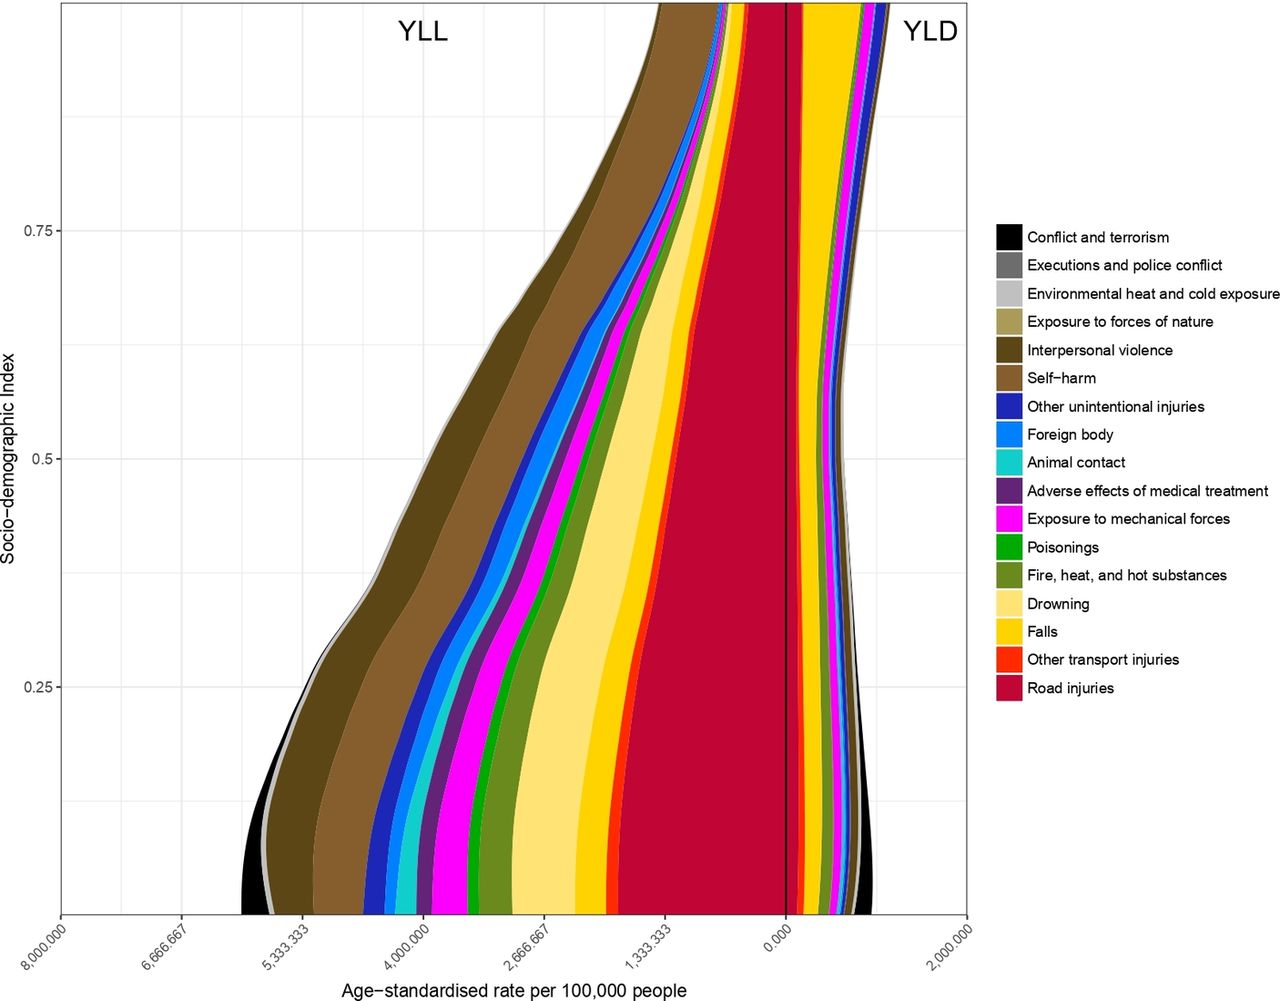
Age-standardised YLL and YLD rates for 17 cause-of-injury categories by level of Socio-demographic Index. YLL, years of life lost.

Expected based on SDI versus observed burden of injury by SDI level, 1990–2017

Figure 2 shows the level of all injury age-standardised DALYs per 100 000 against SDI by GBD region from 1990 to 2017 in comparison with expected values (black line) based on SDI alone. The icons appearing above the black line for DALYs represent worse than expected injury DALYs and the icons appearing below represent better than expected injury DALYs. As SDI generally increases over time, successive markers represent years between 1990 and 2017. Regions where injury DALY rates were notably greater than expected based on SDI included Central and Southern Sub-Saharan Africa, Oceania, Eastern Europe, Central Europe and high-income North America. Regions where injury DALY rates were notably lower than expected based on SDI included Eastern and Western Sub-Saharan Africa, South Asia, Southeast Asia and Western Europe.

Figure 2

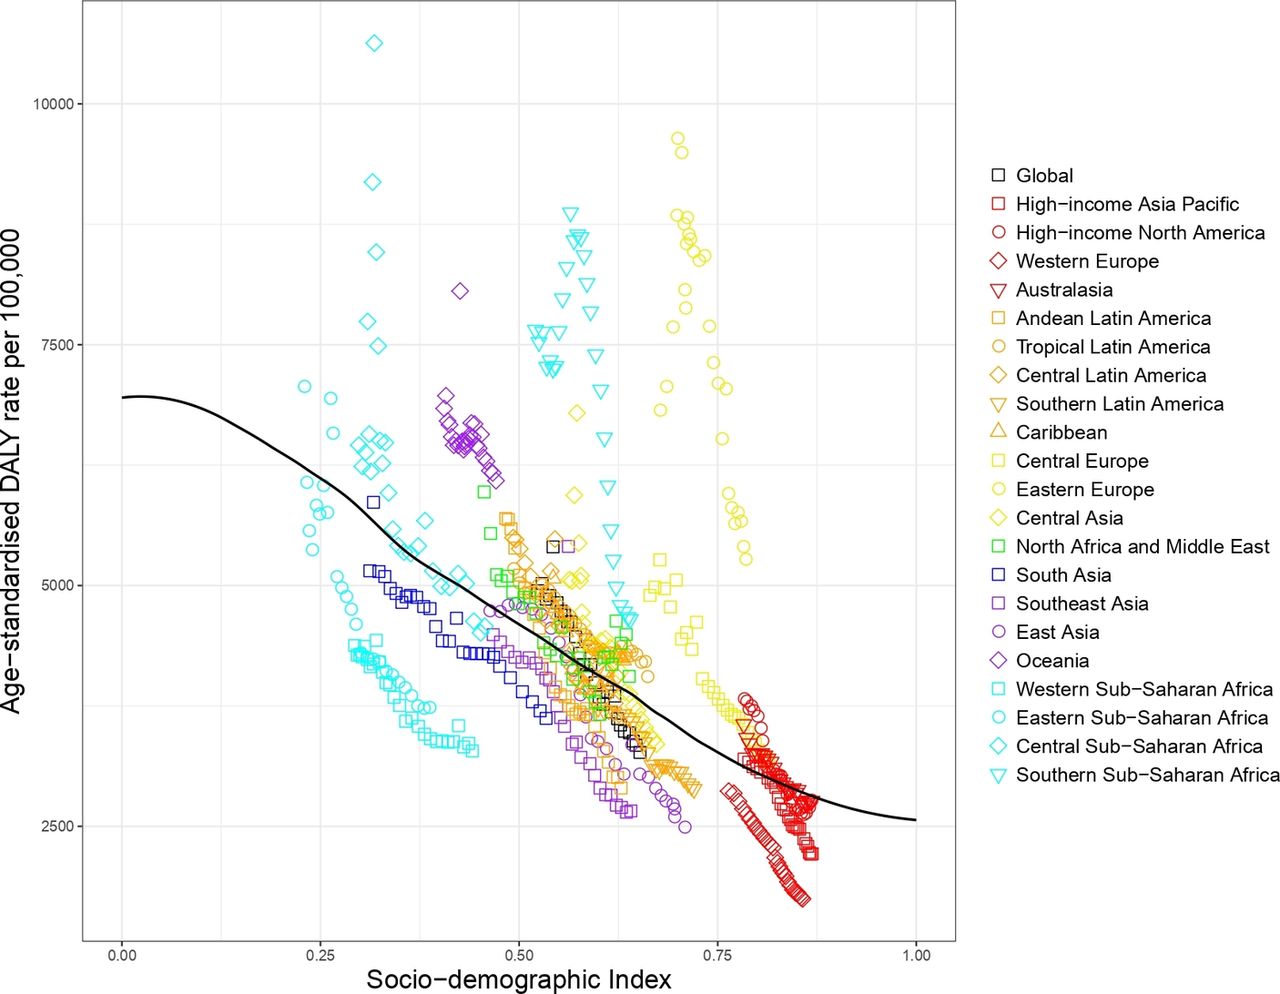
Co-evolution of all injury age-standardised DALY rates with SDI for the world and 21 GBD regions for 1990–2017 with comparison with the values expected on the basis of SDI alone. DALY, disability-adjusted life year; GBD, Global Burden of Disease; SDI, Socio-demographic Index.

Road injury

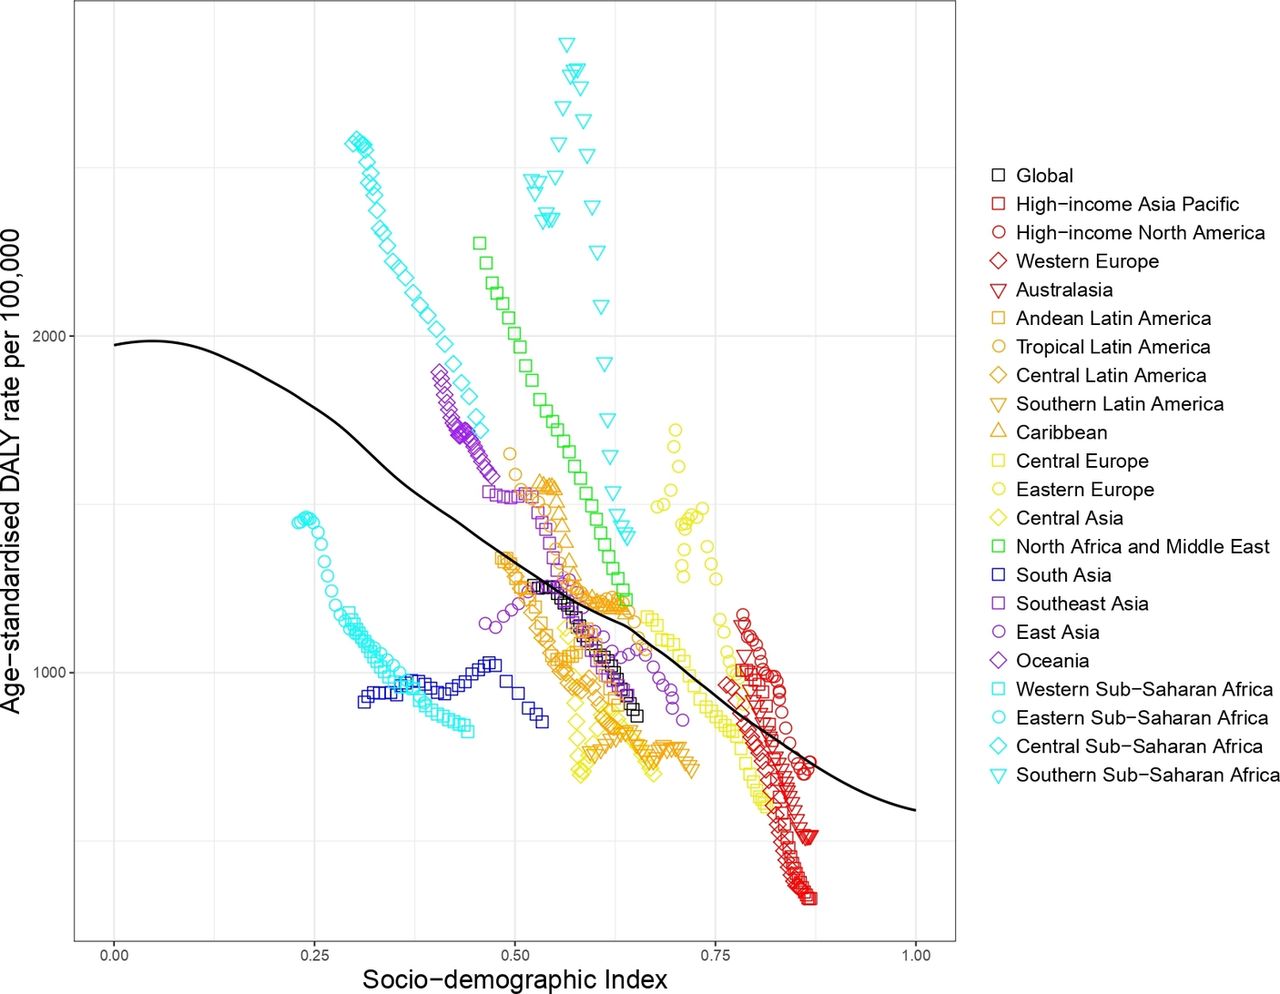
The expected road injury DALY rate by SDI shows that most regions decreased in terms of road injury DALYs as SDI increased over time (see figure 3). South Asia, East Asia, Southern Sub-Saharan Africa and Eastern Europe are exceptions to this pattern, showing an initial increase and then a decline. In GBD 2017, the regions with worse than expected road injury DALYs based on SDI included North Africa and Middle East, Southern and Central Sub-Saharan Africa, Eastern Europe and Oceania, while regions with markedly better than expected rates included Eastern Sub-Saharan Africa, South Asia and Southern Latin America.

Figure 3

Co-evolution of road injury age-standardised DALY rates with SDI for the world and 21 GBD regions for 1990–2017 with comparison with the values expected on the basis of SDI alone. DALY, disability-adjusted life year; GBD, Global Burden of Disease; SDI, Socio-demographic Index.

Interpersonal violence

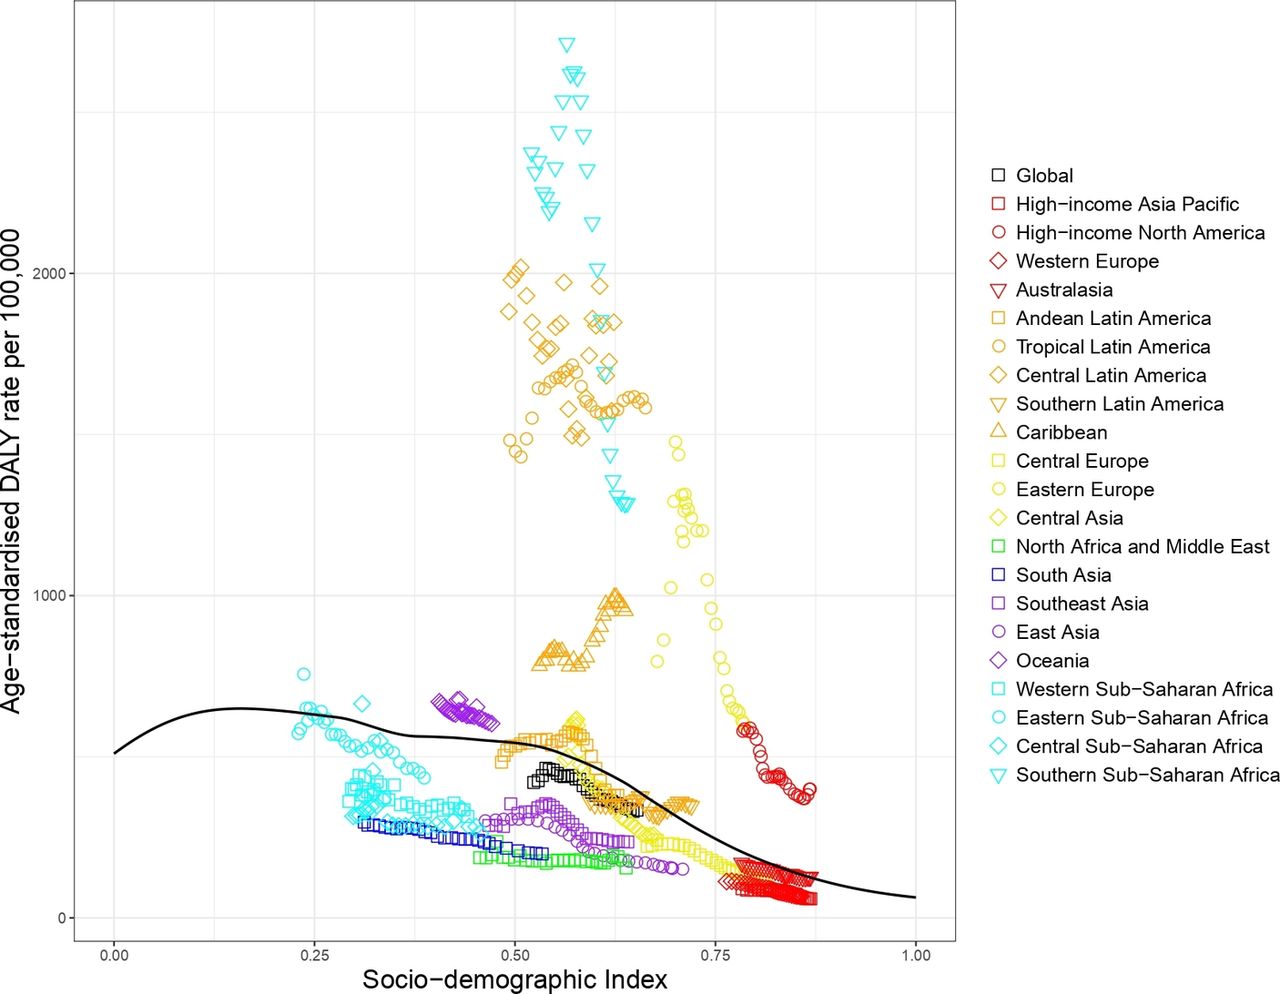
In 2017, in all regions except for Southern Sub-Saharan Africa, Central Latin America, Tropical Latin America, Eastern Europe, Caribbean, Oceania and high-income North America, the observed interpersonal violence DALY rates were better than expected based on SDI (see figure 4). Between 1990 and 2017, in most regions with higher than expected DALYs, the gap between observed and expected interpersonal violence DALY rates decreased, except for Caribbean and Tropical Latin America, where the gap increased.

Figure 4

Co-evolution of interpersonal violence age-standardised DALY rates with SDI for the world and 21 GBD regions for 1990–2017 with comparison with the values expected on the basis of SDI alone. DALY, disability-adjusted life year; GBD, Global Burden of Disease; SDI, Socio-demographic Index.

Self-harm

The patterns of observed and expected self-harm DALYs based on SDI by GBD regions between 1990 and 2017 differed markedly from those of other injuries (see figure 5). In 1990, observed self-harm DALY rates in East Asia and Eastern Europe were worse than expected based on SDI but rapidly declined over time, with observed DALY rates lower than expected in 2017. Southern Sub-Saharan Africa had worse than expected DALY rates but the other regions of Sub-Saharan Africa had better than expected DALY rates. North Africa and Middle East, Western Europe, Southeast Asia, and Andean, Central and Tropical Latin America all had better than expected DALY rates.

Figure 5

Co-evolution of self-harm age-standardised DALY rates with SDI for the world and 21 GBD regions for 1990–2017 with comparison with the values expected on the basis of SDI alone. DALY, disability-adjusted life year; GBD, Global Burden of Disease; SDI, Socio-demographic Index.

Drowning

Drowning DALY rates between 1990 and 2017 decreased in almost every GBD region regardless of their SDI value (figure 6), except for Oceania, Eastern Europe and Southern Sub-Saharan Africa. Eastern and Western Sub-Saharan Africa, North Africa and Middle East, Andean, Tropical, Central and Southern Latin America, Western Europe and Australasia had better than expected DALY rates, while Oceania, East Asia and Eastern Europe had worse than expected DALY rates based on SDI.

Figure 6

Co-evolution of drowning age-standardised DALY rates with SDI for the world and 21 GBD regions for 1990–2017 with comparison with the values expected on the basis of SDI alone. DALY, disability-adjusted life year; GBD, Global Burden of Disease; SDI, Socio-demographic Index.

Falls

The patterns in falls globally followed more dynamic trends across regions as SDI increased from 1990 to 2017 (see figure 7). The regions that performed worse than expected in terms of SDI were Central Europe, Eastern Europe, South Asia, Central Asia and Australasia. Among these, Central Asia and Central Europe decreased and then increased, while Eastern Europe increased and then decreased. South Asia decreased steadily, while Australasia increased steadily until recent years. Among regions that performed better than expected, Oceania had increasing rates as SDI increased, while high-income North America dropped precipitously and then started increasing as SDI increased.

Figure 7

Co-evolution of falls age-standardised DALY rates with SDI for the world and 21 GBD regions for 1990–2017 with comparison with the values expected on the basis of SDI alone. DALY, disability-adjusted life year; GBD, Global Burden of Disease; SDI, Socio-demographic Index.

Discussion

For many causes of injury, age-standardised DALY rates declined strikingly with increasing SDI, although road injury, interpersonal violence and self-harm did not strictly follow this pattern. Particularly for self-harm opposing patterns were observed in regions with similar SDI levels, for example, the trends in high-income Asia Pacific were opposite the trends in Western Europe, despite their proximity in terms of SDI. For road injuries, this effect was less pronounced; for nearly all regions, road injury DALY rates declined after 2005.

In Southern Sub-Saharan Africa, injury DALYs were worse than expected based on SDI in the overall injuries category as well as many of the specific injuries. In this region, road injury and interpersonal violence were important causes explaining the gap between observed and expected levels of overall injury DALYs. Many underlying and intertwining determinants of the high levels of interpersonal violence have been cited, including income inequality and poverty, high unemployment, rapid social change, corruption and poor rule of law, gender inequality, family breakdown, access to firearms, and alcohol and drug abuse.27 Despite these difficulties, however, and the worse-than-expected performance relative to SDI, our findings show that the DALY rates in Southern Sub-Saharan Africa have decreased from 2000 to 2017. This trend tallies with a reported declining number of injury deaths among young adults in South Africa.28

Of regions with a middle-high SDI, Eastern Europe stands out, because for most causes of injury, DALYs were much worse than expected based on SDI, particularly in the period 1990–2005. A compelling explanation for this finding may be the dissolution of the former Soviet Union and the resulting social and economic consequences on health and mortality.29 However, others have argued that causes of the health crisis are more complex and may result from a combination of historical and contemporary forces, including lifestyle habits, such as alcohol use, economic impoverishment, widening social inequality and the breakdown of political institutions.30 31 It should be noted that our study did aim to assess determinants of the burden of injury and caution is needed in attempting to draw conclusions with regard to possible reasons for regional trends and differences.

Another notable finding from our study was that for falls, at the higher levels of SDI, the composition of the disease burden shifted towards YLDs, rather than YLLs, as a more prominent driver of DALYs compared with areas with lower SDI. The proportion of DALYs due to YLDs also increases with higher levels of SDI among other injuries. It is possible that this shift in distribution reflects decreased mortality among injuries when people in higher SDI locations have access to better healthcare services. The shift in road injuries, for example, could be brought about by injury-prevention measures reducing the severity of the injury sustained (eg, seat belts and helmets) or by improved access to better quality care after an injury (eg, trauma systems). It is also possible that in age-standardised analyses, the shift towards YLDs may be due to the ageing of the population of countries with high SDI with commensurate age-related increases in injury incidence. For example, the incidence of falls increases substantially with age and most of the burden from falls in high-SDI countries occurs in the very old.32

Limitations

Our analysis has several limitations. First, as SDI and time are correlated, we may be over interpreting SDI as a driver of change as it could well be driven largely by other factors changing over time, not necessarily linked to SDI, such as climate change.

Second, limited data are available to quantify burden of injuries in the world. Major limitations of the cause-of-death data are low or absent coverage of vital registration or verbal autopsy data in many parts of the world, incompleteness of death certification systems and differences in the proportion of injury deaths classified in ill-defined codes.33–36 Few data were available for non-fatal injuries, and if data were available, injury was frequently recorded as a mix of cause and nature-of-injury codes and often a preponderance of nature-of-injury codes, while our analyses require attributing health outcomes to cause of injury. As a result, many non-fatal injury hospitals and emergency departments data sets could not be used. Furthermore, short-term duration of several nature-of-injury categories was based on expert-driven estimates because patient data was not available. Besides, gathering data on deaths and morbidity due to forces of nature (ie, disasters) and collective violence is complicated by the fact that their aftereffects may severely disrupt the infrastructure of vital and health registration systems.37 The statistical methods that we have used to assess mortality, incidence and prevalence can borrow strength over time and geography to ensure an estimate for all causes and all countries. Nevertheless, estimates for populations and time periods with few or absent data are inherently less precise.

Non-fatal injuries are reported by both cause of injury and nature of injury. Since our model requires a one-to-one relationship between cause-of-injury and nature-of-injury category, we developed a nature-of-injuries severity hierarchy that selects the injury that was likely to be responsible for the largest burden in a person with more than one injury. This means that we ignore the other injuries sustained by such individuals and this may have led to some underestimation of the burden of non-fatal injury. We decided to use such a hierarchy after it proved difficult to use statistical methods on sparse data to parse estimates across co-occurring injuries.

A second methodological limitation is the assessment of the probability of permanent health loss, one of the main drivers of non-fatal burden of disease. The probability of long-term injury was based on patient-reported outcome data from follow-up studies in just three countries. Also, long-term patient-reported outcome data may be influenced by response shift bias. Response shift is a change of outcome due to a change of the measurement perspective of the respondent (‘internal measurement scale’), where the usual change is towards adaptation. In our study, response shift may have resulted in an underestimation of the severity of long-term consequences of injury and consequently, to an underestimation of the non-fatal burden of injury.

Third, even though a strong correlation between SDI and injury DALYs, YLLs and YLDs was found, this cannot be interpreted as being causal in nature, because income per capita and education, two of the three components of SDI, were also used as covariates in all of the injury models except exposure to forces of nature and collective violence and legal intervention. In its original formulation, Murray et al suggested that SDI utility may be improved in the future through consideration of additional societal elements, such as inequality in each component.1

Conclusions

The overall pattern is that of declining injury burden with increasing development. Not all injuries follow this pattern, suggesting that there are multiple underlying mechanisms influencing injury outcomes. The detailed understanding of these patterns helps to inform countries how best to respond to changes in injury outcomes that occur with development and, in case of countries where health gains outpace development, may help to identify which prevention and/or healthcare measures have been taken in these countries.

What is already known on the subject

  • Morbidity and mortality from injuries are known to be affected by socioeconomic development.

What this study adds

  • This study provides more recent estimates of global morbidity and mortality from injuries with a greater level of detail than has previously been reported and with an updated method for measuring sociodemographic development.

  • This study found that many injuries decreased in terms of morbidity and mortality as sociodemographic development increased over time, but also identified important exceptions to this trend.

  • The study adds to the body of discussion on how economic development and sociodemographic changes should be considered in preventing future injury burden.

Acknowledgments

Mihajlo Jakovljevic Serbia acknowledges support through the Grant OI 175 014 of the Ministry of Education Science and Technological Development of the Republic of Serbia. Shahrzad Bazargan-Hejai acknowledges support through the NIH National Center for Advancing Translational Science (NCATS) UCLA CTSI Grant Number UL1TR001881". Ashish Awasthi acknowledges support from the Department of Science and Technology, Government of India, New Delhi through INSPIRE Faculty program. Rafael Tabarés-Seisdedos acknowledges support in part by grant number PROMETEOII/2015/021 from Generalitat Valenciana and the national grant PI17/00719 from ISCIII-FEDER. Abdallah M Samy acknowledges support from a fellowship from the Egyptian Fulbright Mission Program. Eduarda Fernandes acknowledges support ID/MULTI/04378/2019 and UID/QUI/50006/2019 with FCT/MCTES support through Portuguese national funds. Félix Carvalho acknowledges support ID/MULTI/04378/2019 and UID/QUI/50006/2019 with FCT/MCTES support through Portuguese national funds. Ilais Moreno Velásquezis acknowledges support from the Sistema Nacional de Investigacion, SENACYT (Panama). Louisa Degenhardt acknowledges support by an NHMRC research fellowship (#1135991) and by NIH grant NIDA R01DA1104470; The National Drug and Alcohol Research Centre is supported by funding from the Australian Government Department of Health under the Drug and Alcohol Program. Milena Santric Milicevic acknowledges the support from the Ministry of Education, Science and Technological Development, Republic of Serbia (Contract No. 175087). Kebede Deribe KD is supported by a grant from the Wellcome Trust [grant number 201900] as part of his International Intermediate Fellowship. Syed Aljunid acknowledges support from the International Centre for Casemix and Clinical Coding, Faculty of Medicine, National University of Malaysia and Department of Health Policy and Management, Faculty of Public Health, Kuwait University for the approval and support to participate in this research project. Jan-Walter De Neve was supported by the Alexander von Humboldt Foundation. Michael R Phillips acknowledges support from the Chinese National Natural Science Foundation of China (NSFC, No. 81371502). Sheikh Mohammed Shariful Islam acknowledges support from the National Heart Foundation of Australia and from a senior research fellowship from Deakin University. Duduzile Edith Ndwandwe acknowledges support from Cochrane South Africa, South African Medical Research Council.Tissa Wijeratne acknowledges the Department of Medicine, Faculty of Medicine, University of Rajarata, Saliyapura, Anuradhapura, Sri Lanka for their support.

References

Supplementary materials

Footnotes

  • Funding Funding for GBD 2017 was provided by the Bill and Melinda Gates Foundation.

  • Competing interests Dr. Carl Abelardo T Antonio reports personal fees from Johnson & Johnson (Philippines), Inc., outside the submitted work. Dr. Jasvinder Singh reports personal fees from Crealta/Horizon, Medisys, Fidia, UBM LLC, Medscape, WebMD, Clinical Care options, Clearview healthcare partners, Putnam associates, Spherix, the National Institutes of Health and the American College of Rheumatology, stock options in Amarin pharmaceuticals and Viking pharmaceuticals, participating in the steering committee of OMERACT, an international organization that develops measures for clinical trials and receives arm’s length funding from 12 pharmaceutical companies, including Amgen, Janssen, Novartis, Roche, UCB Group, Ardea/Astra Zeneca, Bristol Myers Squibb, Celgene, EliLilly, Horizon Pharma, Pfizer, and Centrexion. Dr. Josep Maria Haro reports personal fees from Roche and Lundbeck, and that the institute for which they work provides services to Eli Lilly and Co., outside the submitted work. Dr. Mete Saylan is an employee of Bayer AG, outside the submitted work. Dr Sheikh Mohammed Shariful Islam is funded by National Heart Foundation of Australia and supported by a senior research fellowship from Deakin University, outside the submitted work. Dr. Spencer James reports grants from Sanofi Pasteur, outside the submitted work.

  • Patient consent for publication Not required.

  • Provenance and peer review Not commissioned; externally peer reviewed.

  • Data availability statement Data are available in a public, open access repository (ghdx.healthdata.org). Select data are available on reasonable request. Select input data may be obtained from a third party and are not publicly available.