Article Text

Abstract
Introduction Cough intensity is an important determinant of cough severity reported by patients. Cough sound analysis has been widely validated for the measurement of cough frequency but few studies have validated its use in the assessment of cough strength. We investigated the relationship between cough sound and physiological measures of cough strength.
Methods 32 patients with chronic cough and controls underwent contemporaneous measurements of voluntary cough sound, flow and oesophageal pressure. Sound power, peak energy, rise-time, duration, peak-frequency, bandwidth and centroid-frequency were assessed and compared with physiological measures. The relationship between sound and subjective cough strength Visual Analogue Score (VAS), the repeatability of cough sounds and the effect of microphone position were also assessed.
Results Sound power and energy correlated strongly with cough flow (median Spearman’s r=0.87–0.88) and oesophageal pressure (median Spearman’s r=0.89). Sound power and energy correlated strongly with cough strength VAS (median Spearman’s r=0.84–0.86) and were highly repeatable (intraclass correlation coefficient=0.93–0.94) but both were affected by change in microphone position.
Conclusions Cough sound power and energy correlate strongly with physiological measures and subjective perception of cough strength. Power and energy are highly repeatable measures but the microphone position should be standardised. Our findings support the use of cough sound as an index of cough strength.
- Cough/Mechanisms/Pharmacology
- Lung Physiology
- Respiratory Measurement
This is an Open Access article distributed in accordance with the Creative Commons Attribution Non Commercial (CC BY-NC 4.0) license, which permits others to distribute, remix, adapt, build upon this work non-commercially, and license their derivative works on different terms, provided the original work is properly cited and the use is non-commercial. See: http://creativecommons.org/licenses/by-nc/4.0/
Statistics from Altmetric.com
Introduction
In patients with chronic cough, both the frequency and intensity of cough are important determinants of global cough severity.1 The impact of strength of cough is not known but its importance is likely to be significant in the context of stress urinary incontinence, syncope and rib fractures.2 There is a need to better understand and measure cough strength because therapies may have different effects on cough frequency and strength.3 Cough strength can be objectively assessed by measurement of cough flow, oesophageal and gastric pressure or electromyography but their use in clinical practice may be limited by their invasive nature or impracticality in the ambulatory setting.4–6 The measurement of cough sound is non-invasive and technological advances have permitted analysis over prolonged periods in the patients' own environment for the assessment of cough frequency.7–10 The use of cough sound analysis for the measurement of cough strength has been proposed but few studies have validated it for this purpose.11 The aim of this study was to investigate the relationship between cough sound and physiological measures of cough strength in healthy controls and in patients with chronic cough. The repeatability of cough sound parameters, the effect of varying microphone position and the relationship between sound and subjective perception of cough strength were also evaluated.
Methods
Subjects
Consecutive patients referred for investigation of chronic cough of greater than 8 weeks duration were recruited from a respiratory out-patient clinic. The cause of cough was established following investigation and trials of treatment according to a standardised protocol. Exclusion criteria were current smokers, history of smoking within the past year and upper respiratory tract infection within the previous 4 weeks. Additional exclusion criteria for control subjects included symptoms of cough, history of respiratory disease and abnormal lung function. Ethical approval was granted by the East London and the City Research Ethics Committee (10/H0703/6). All subjects gave informed consent.
Physiological measures of cough strength
Cough flow
Respiratory flow was measured at the mouth using a Fleisch type pneumotachograph (P.K. Morgan, Kent, UK) attached to a full-face mask (Hans Rudolph, Kansas City, USA). Peak cough flow (PCF) was measured as the peak expiratory excursion during cough. PCF was expressed as a percentage of predicted peak expiratory flow (PEFPred) in order to adjust for gender and height.
Cough oesophageal pressure
Oesophageal pressure (Poes) was measured using a balloon catheter (Cooper Surgical, Berlin, Germany) inserted nasally and positioned within the lower oesophagus.12 The balloon catheter was attached to a pressure transducer (Validyne, Northridge, California, USA) and signal amplifier (Validyne). Cough Poes was defined as the peak pressure during coughs.
Cough sound
Cough sounds were recorded using a free-field microphone (Sennheiser, Wedermark, Germany) placed 20 cm inferior to the mouth and a piezo-electric contact microphone (Philips Respironics, Surrey, UK) placed over the larynx. Recordings were sampled at a frequency of 8000 Hz, amplified (free-field microphone gain x10, contact microphone gain x3) and digitally filtered between 20 Hz and 4000 Hz (Cambridge Electronic Design, Cambridge, UK).13–15
Cough sounds can comprise up to three phases: explosive, intermediate and voiced (phases 1, 2 and 3, respectively, figure 1). They correspond to glottal opening, steady-state flow and interruption of airflow due to closure of the glottis, respectively.16 Phase 3 is not always present and in its absence the identification of the termination of phase 2 becomes difficult due to the gradual signal dissipation.17 18 Therefore, phase 1 (P1) was selected for primary analysis since it is always present and is most easily identifiable. The window from the onset of phase 1 to the end of phase 3 (P1–3) was also analysed (figure 1). Finally, cough sounds were analysed using a constant time window, 0.5 s from onset of phase 1 (P0.5) (figure 1). The onset and end of P1 and P1–3 were marked manually.
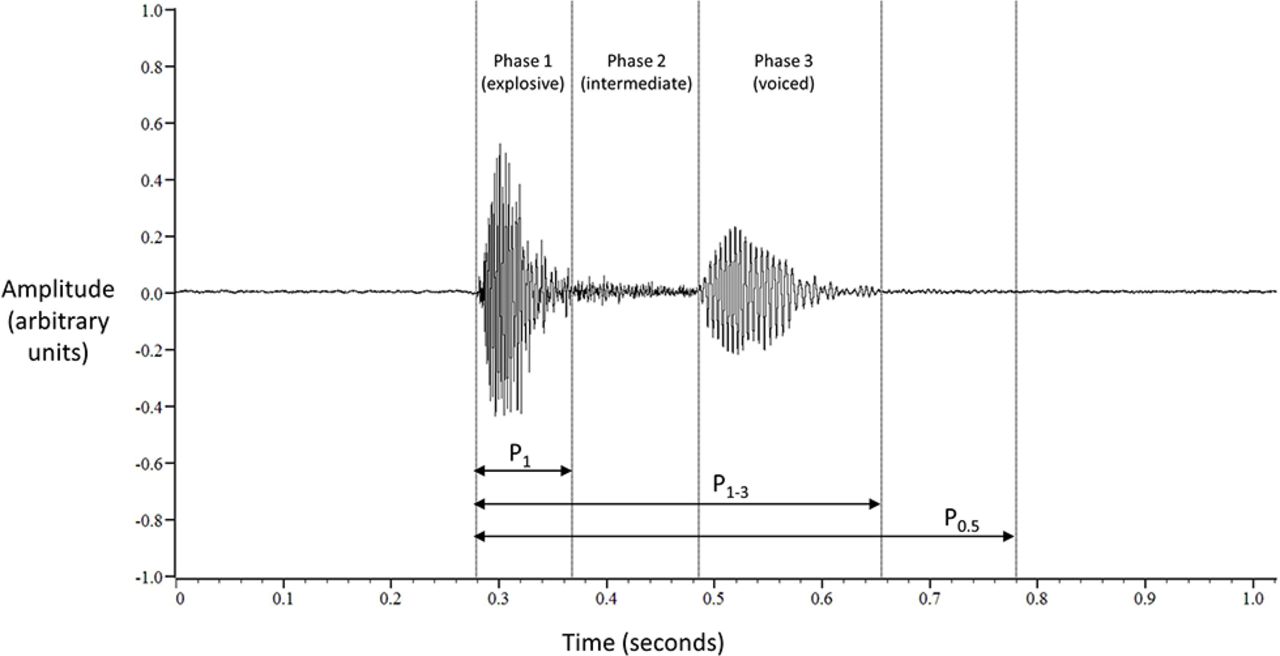
Three-phase cough sound signal. P1: phase 1; P1–3: phases 1–3; P0.5: 0.5 s time window from onset of phase 1.
A custom script (MATLAB, The MathWorks, Massachusetts, USA) was used to calculate the following cough sound parameters in a standardised manner for each time window: peak energy (Ep), rise time (RT), duration (D), power (PW), peak frequency (Fp), centroid frequency (Fc) and bandwidth (BW). Ep and RT were calculated from the root mean square (RMS) of the cough signal in its time domain (figure 2).19 Ep was defined as the maximum value of the RMS cough signal, and RT was defined as the duration of time taken for the RMS cough signal to rise from 10% to 90% of the peak energy value. PW, BW, Fp and Fc were calculated from the frequency spectrum of the cough signal following Fast Fourier Transformation, a widely used method for assessing power spectral density (figure 2).11 13 17 20 PW was defined as the area under the curve of the power spectral density (PSD); BW was defined as the frequency range or band containing 95% of the total spectral power; Fp was defined as the frequency at which 95% of the cumulative total spectral power was reached and Fc was defined as the frequency at which the mass of the entire PSD signal spectrum was centred, that is, at 50% of the cumulative power (figure 2).

Cough sound strength parameters. A typical cough sound signal displayed in the time series domain (upper trace); as the root mean square (RMS) derivative (middle trace) and in the frequency spectrum domain following Fast Fourier Transformation (lower trace).
Lung function
Spirometry and peak expiratory flow rate were measured in accordance with international guidelines.21 22
Protocol
Voluntary cough was assessed in all patients and spontaneous cough in a single patient with idiopathic chronic cough. Each section below describes a separate study protocol.
Relationship between cough sound and Poes and peak cough flow
All subjects were instructed to perform at least 10 voluntary coughs at maximum strength (MVC) until cough Poes reached a plateau and was repeatable. Sufficient time was allowed between cough efforts to avoid fatigue and to ensure the return of lung volume to functional residual capacity. Subjects were then asked to perform at least 10 voluntary coughs within each of the following quintiles of cough strength: 0%–20%, 21%–40%, 41%–60%, 61%–80% and 81%–100% of maximum voluntary cough Poes. Real-time visual feedback with graphical demonstration of the Poes trace on a computer screen was used to guide subjects.
Cough sound repeatability
Ten healthy subjects (six females) performed 10 maximum voluntary coughs on two occasions, 1 week apart. Cough peak flow and cough sounds were recorded using the free-field microphone. The microphone position was standardised for all subjects as described previously. Intra-class correlation coefficients (two-way average) were calculated for the cough sound parameters between visits 1 and 2.
Effect of microphone position on cough sound
Eight healthy subjects were asked to perform 10 voluntary coughs of similar strength while cough sounds were recorded simultaneously using 4 identical free-field microphones placed in different positions relative to the mouth. The standard microphone position (centre) was located 20 cm inferior to the mouth. Three additional microphones were positioned 5 cm superior, inferior and lateral to the standard position (online supplementary figure 1). The mean values for the sound parameters from each microphone position were compared.
Relationship between cough sound and subjective assessment of cough strength
A subgroup of eight patients with chronic cough was instructed to produce at least 10 single voluntary coughs at any strength and in a random order. Subjects were not instructed on the intensity with which to cough on each occasion and were free to cough at any intensity of their own volition, without influence from the operator. Subjects were blinded to the physiological and sound measures of cough and from the VAS ratings for all previous coughs. After each cough effort, subjects were asked to rate the strength of the cough on a 100 mm VAS scale. Subjective VAS scores and physiological measures for all coughs were then compared for each subject.
Spontaneous cough intensity
The feasibility of assessing cough sounds, Poes and peak cough flow in spontaneous cough was investigated in a single patient with idiopathic chronic cough. The patient was informed that monitoring would be performed for 30 min unobserved. No instructions relating to coughing were given. All spontaneous coughs were analysed.
Analysis
Physiological and sound data were time-synchronised, converted from analogue to digital format (Cambridge Electronic Design, Cambridge, UK) and analysed with Spike 2 software (Cambridge Electronic Design). All sound analyses were derived from the free-field microphone unless otherwise stated. Appropriate parametric or non-parametric analyses were performed depending on distribution of the data. To demonstrate a correlation coefficient r=0.5 between cough sound and peak cough flow or Poes against a null hypothesis of r=0 with 80% power and 5% error, a sample size of 29 subjects was required.
Results
Seventeen patients with chronic cough and 15 healthy subjects were recruited. Baseline characteristics are given in table 1. The causes of cough in patients were asthma (24%), gastro-oesophageal reflux disease (24%), eosinophilic bronchitis (6%), post-infectious (6%), bronchiectasis (6%) and idiopathic (35%). A total of 1058 voluntary coughs from patients and 758 voluntary coughs from healthy subjects were recorded and analysed. One patient with idiopathic chronic cough was recruited for a feasibility study of spontaneous cough (age 71 years, male and duration of cough 96 months).
Subject characteristics
Relationship between physiological and cough sound measures
Flow
The correlation coefficients between PCF:PEFpred and sound measures derived from P1, P1–3 and P0.5 are presented in table 2. The sound parameters with the strongest correlations with PCF:PEFpred were power (PW) and peak energy (Ep) (table 2). The median (IQR) within-subject correlation coefficient between sound PW and PCF:PEFpred was 0.88 (0.78–0.93), with all individual subject p values <0.001 (table 2 and figure 3). These relationships remained strong when patients, controls and gender were analysed separately (online supplementary table 1 to 4). The correlations between sound power and energy and PCF:PEFpred were marginally superior with the free-field microphone compared with the contact microphone (online supplementary tables 1 and 2).

Relationship between cough sound and cough oesophageal pressure and flow in an individual patient with chronic cough. Patient is a representative example. Cough sound power calculated from P1 time window. Spearman’s correlation coefficients.
The relationship between cough sound, flow and oesophageal pressure
Pressure
The correlation coefficients between Poes and sound measures derived from P1, P1-3 and P0.5 are presented in table 2. The strongest relationships with Poes were found with PW and Ep. The median (IQR) within-subject correlation coefficient between PW and Poes was 0.89 (0.84–0.95), all individual subject p-values <0.001 (table 2 and figure 3). The correlations between sound measures and Poes were similar to those with flow (table 2). The correlations were also similar when patients, controls and gender were analysed separately (online supplementary tables 1–4).
Relationship of flow and pressure with sound measures using a constant time window (P0.5)
The correlation coefficients between cough sound PW and Ep evaluated from a 0.5 s duration (P0.5) and cough flow and pressure were strong for all subjects (median correlation coefficient between PW and Ep and cough flow 0.88 and 0.87, respectively and between PW and Ep and pressure 0.89 and 0.89, respectively). These correlations were comparable to those evaluated from cough sound phase 1 and phase 1–3 (table 2).
Repeatability of cough sound measures
The intraclass correlation coefficients (ICC) for cough sound PW and Ep derived from P1 on two occasions were good (ICC 0.93 and 0.94, respectively, p <0.01; figure 4 and online supplementary table 5). Repeatability of PW and Ep derived from P0.5 was also good (ICC 0.93 and 0.94, p ≤0.001). There were no significant differences in sound PW between visits 1 and 2 for P1 (p=0.489) or P0.5 (p=0.408).

Repeatability of cough sound power during maximum voluntary cough. Bland-Altman plot of cough sound power during maximum voluntary cough on two separate occasions. Power taken from free-field microphone. PW, power (arbitrary units); ICC, intraclass correlation coefficient.
Effect of microphone position on cough sound measures
For all subjects, the coefficient of variation of cough sound PW for the 10 coughs was less than 10%, suggesting that the series of coughs were of similar strength. Mean cough sound PW was greatest in the standard centre position (online supplementary table 6). There was a significant difference in mean PW between the centre position and all other positions (ANOVA, p <0.001), and the difference was greatest between the centre position and the bottom position (online supplementary table 6).
Clinical characteristics affecting cough sound
PW was selected for further analysis since it had a marginally superior relationship with flow and pressure (online supplementary table 1). Cough sound measures from free-field microphones were used in preference to contact microphones because of their marginally stronger correlations with cough flow (online supplementary tables 1 and 2). PW of cough sound during MVC was significantly higher in males compared with females (mean±SD PW 52.7±8.4 vs 45.7±5.2 arbitrary units, difference between means 7.1, 95% CI 2.2 to 12.0, p=0.006) (online supplementary figures 2). PW during MVC was not associated with age (r=−0.26), weight (r=0.15), BMI (r=−0.06) or FVC (r=0.34) and only weakly associated with height (r=0.39, p=0.026) and FEV1 (r=0.39, p=0.026). The coefficient of variation was lower with PW (compared with Ep) in both coughers and controls. In patients with chronic cough, the mean±SD PW during MVC for the free-field microphone was 47.6±1.7 arbitrary units, and the coefficient of variation was 14.9%. The mean±SD Ep during MVC was 49.6±2.0 arbitrary units, and the coefficient of variation was 67.6%.
Relationship between cough sound and subjective assessment of cough strength
The correlation coefficients between cough sound measures and subjective cough strength Visual Analogue Score (VAS) are presented in table 3 and figure 5. The correlations were strongest for PW and Ep. The median correlation between cough strength VAS and PW derived from the free-field microphone was 0.84. The correlations for constant time duration P0.5 were similar to those for phase 1 (P1). The relationships between free-field microphone derived cough sounds were generally better than those from the contact microphone (table 3).

Relationship between cough strength visual analogue score and cough oesophageal pressure, flow and sound power in a patient with chronic cough. Data presented as Spearman’s correlation coefficients. Sound recorded with free-field microphone and power measures derived from P1 time window. Poes, oesophageal pressure; PCF, peak cough flow; VAS, Visual Analogue Score.
The relationship between cough sound measures and subjective cough strength Visual Analogue Score (VAS) in patients with chronic cough
Spontaneous cough
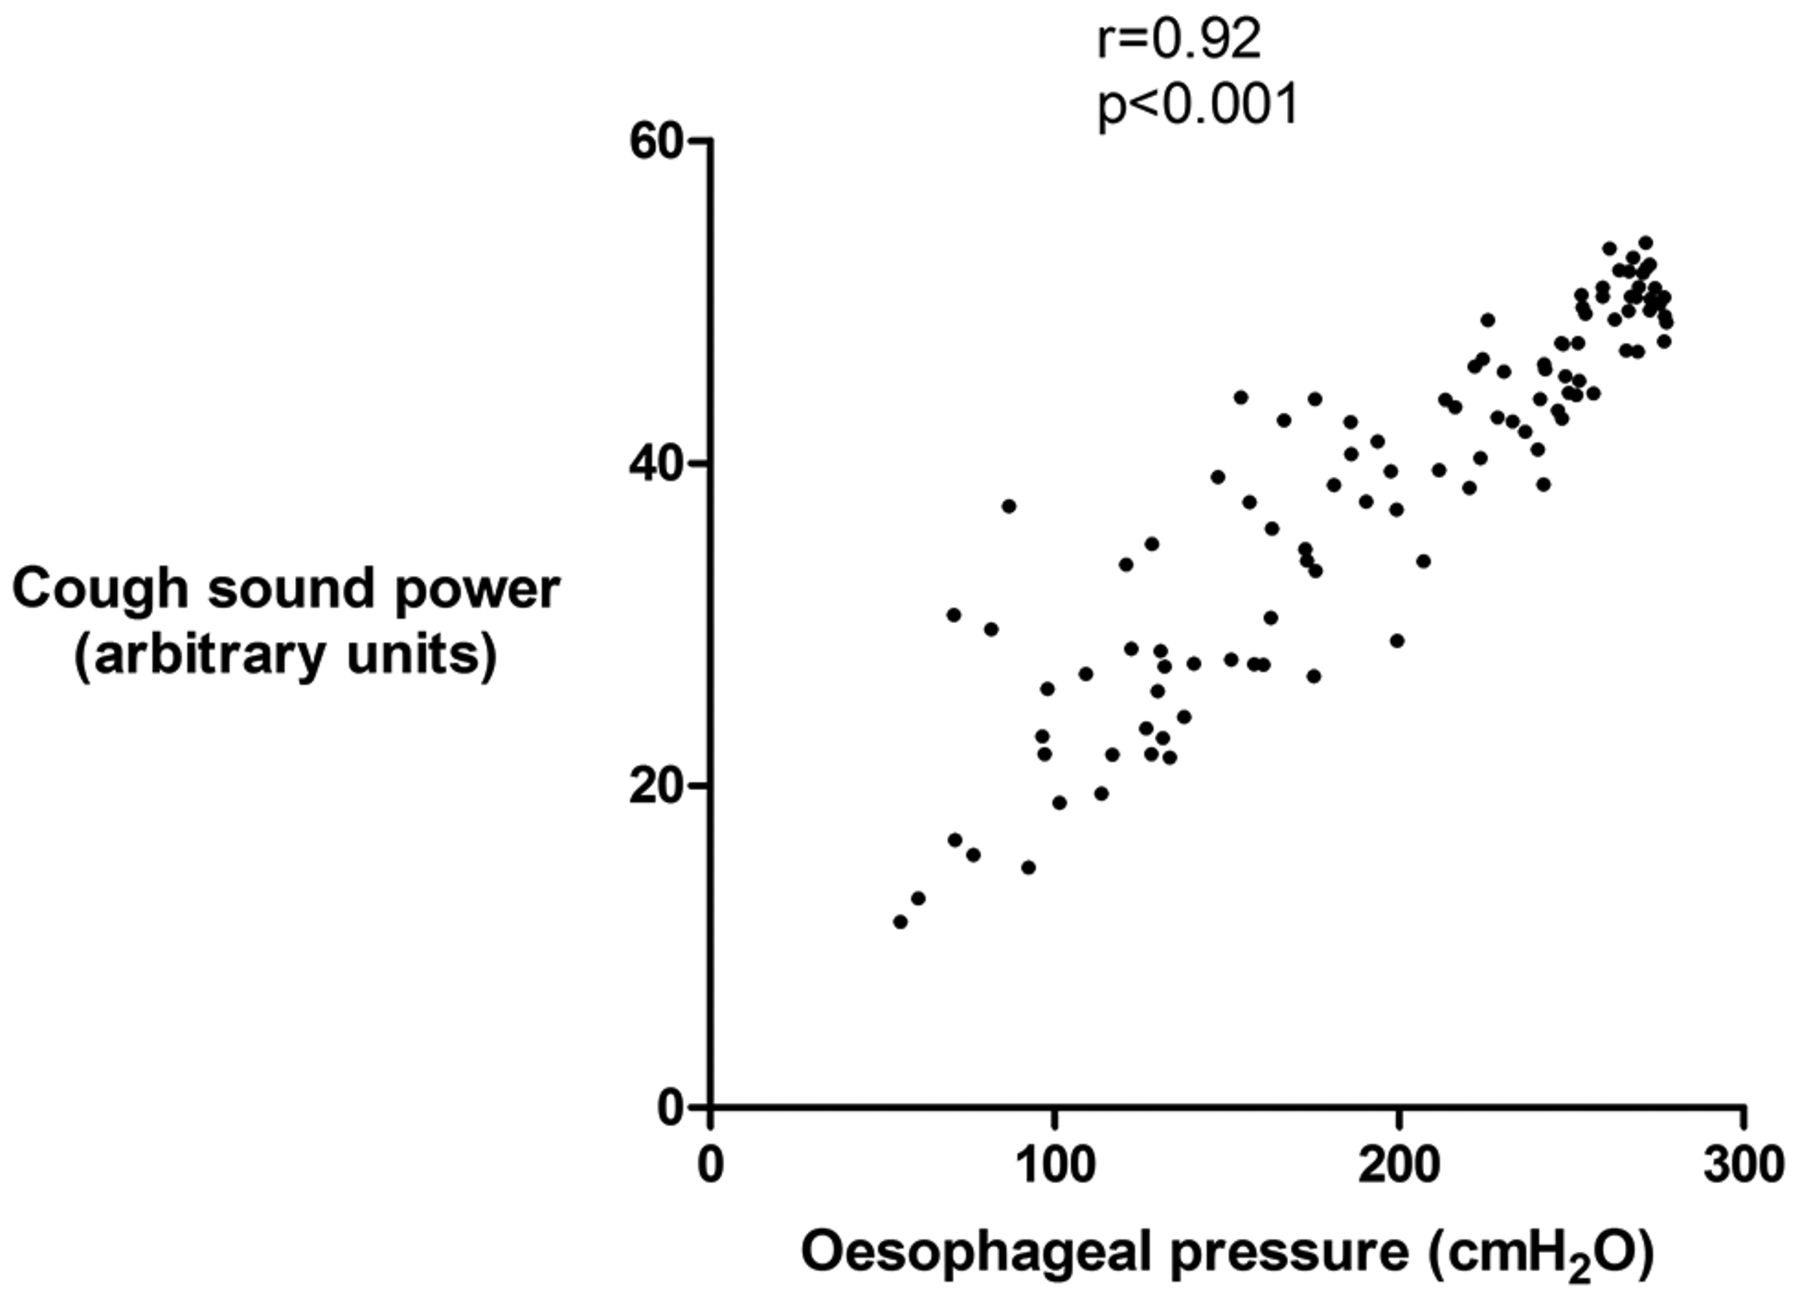
A single patient underwent assessment of spontaneous cough sound power, Poes and peak cough flow for 30 min. A total of 105 spontaneous coughs occurred within 22 bouts (mean 4.8 coughs/bout) during the assessment. No coughs occurred in isolation. The mean±SD cough sound power was 35.3±10.4 arbitrary units. There was a significant relationship between cough sound power and Poes (r=0.92, p<0.001, figure 6) and peak cough flow (r=0.89, p <0.001) using a constant time duration P0.5. There were similar significant relationships between cough sound power and Poes and peak cough flow when assessed using cough phase 1 (r=0.92, and r=0.86, both p <0.001).
Relationship between cough sound and oesophageal pressure during spontaneous cough in an individual patient with idiopathic chronic cough. Cough sound power calculated from P0.5 time window. Spearman’s correlation coefficient.
Discussion
We investigated the association between a range of cough sound and physiological measures of cough strength and found that the best associations were for sound PW and Ep. Voluntary cough sound measures were highly repeatable. PW had the lowest coefficient of variation of all measures. The strength of cough assessed with sound was greater in males than in females and was associated with height. PW and Ep also correlated strongly with subjective ratings of cough strength. In a single patient with idiopathic chronic cough, there was a strong relationship between cough sound power assessed in 105 spontaneous cough events and oesophageal pressure and peak cough flow.
Cough sounds have been studied by a number of investigators, but few have evaluated their potential as a measure of cough strength.20 23–25 Pavesi et al measured cough sound power but did not assess whether this was a measure of cough strength.11 13 To our knowledge, few studies have compared cough sound measures against physiological measures of cough strength. We chose to evaluate a range of sound parameters based on previous studies and knowledge of sound characteristics.19 23 26 27 Of all the sound parameters assessed in our study, sound power and peak energy had the strongest and most consistent association with cough flow and oesophageal pressure. The other sound parameters had weaker relationships, and there was a wide variation between individual subjects. Our data suggest that sound power may be better than energy since it had a lower coefficient of variation. The association between cough sound power and flow in our study was stronger than that reported by Thorpe et al (r=0.42).17 In contrast to our study, Thorpe et al investigated children with asthma and their study was smaller in sample size with significantly fewer analysed coughs.
Our data show that cough sound power and energy are highly repeatable, an essential characteristic for clinical use. The use of automated scripts to calculate all sound parameters ensured standardisation of the signal analysis. Our findings suggest that free-field microphones are marginally superior to contact microphones, with measures derived from free-field microphones yielding slightly higher correlations with flow and subjective perception of cough strength. The coefficient of variation of sound power was also smaller with free-field microphones. Free-field microphones are generally more convenient to attach and do not have the limitations of skin contact due to factors such as sweating. However, standardisation of the position of the microphone relative to the mouth is important, as demonstrated by a reduction in power and energy with varying microphone position in all directions, a finding consistent with that reported by Subburaj et al.13
We calculated sound parameters from different pre-defined time windows of the cough signal in order to address the heterogeneity of cough sound architecture. P1–3 encompasses the whole cough sound but the third phase is not always present, whereas P1 has the advantage of being present in all cough sounds.17 The identification of P1 requires manual marking of its onset and offset, and is therefore labour intensive. We found that there was little difference between P1 and P1–3 in their relationship with flow and pressure. This may be because P1 contains the majority of the energy in cough sounds.19 We evaluated P0.5 in order to assess the feasibility of future automated measurement of cough sound strength without the need for any manual marking, since there is already automated cough detection software available that can identify the onset of cough.7 We chose 0.5 s because previous studies have reported the duration of cough sounds to be within this duration and we considered this sufficiently brief to avoid overlap with adjacent coughs occurring in bouts.28 29 There was a good relationship between sound power and energy derived from P0.5 with flow and pressure, similar to that derived from P1. Therefore, it may be possible to automate the analysis of cough sound, without the need to separate the signals into individual cough phases. We reported our sound power measures in relative units. Power can also be quantified in decibels, a more recognisable unit of sound power, by expressing it as a logarithmic relative to a standard. Comparison of absolute power values in future studies should, therefore, include calibration of the sound recording system against a standard signal.
The correlations between cough sound power and energy and cough strength visual analogue score were strong, suggesting that these measures are concordant with subjective perception of cough strength. This is not surprising since our data show that sound correlates strongly with cough flow and pressure, which in turn have previously been shown to have a strong association with perception of strength.6 Future studies should assess the relationship between cough sound and health related quality of life. We did not evaluate responsiveness in this study but the ability of cough sound to discriminate differing levels of cough strength in our study suggests that it has the potential to be a responsive measure and, therefore, warrants further investigation. The clinical relevance of cough strength should ideally be investigated by the combined assessment of cough frequency and strength using ambulatory cough monitors to provide a more comprehensive assessment of cough.
The factors that influence cough sounds are poorly understood. We found differences in sound energy and power between gender and a weak association with height and lung function. Other factors such as ethnicity, smoking and environmental exposures could be important and warrant further investigation. A better understanding will allow the definition of normal ranges and predicted values and facilitate between-subject comparisons. Such comparisons may also be possible by normalising within-subject sound measures to those obtained during maximum voluntary cough, a method used with other physiological measures such as electromyography.5 30
There are some limitations to our study. We restricted the study to voluntary cough since this permitted the evaluation of a range of different cough intensities in a systematic manner. Our study needs to be repeated in spontaneous and induced cough. In a feasibility study of a single patient with chronic cough, we found a significant association between cough sound power and oesophageal pressure and peak cough flow. Our measures of spontaneous cough sound power, pressure and flow were able to detect a wide range of cough intensities. These data suggest that the study of spontaneous cough intensity is feasible and may yield findings of interest. We studied single coughs; our findings need to be confirmed for coughs occurring within bouts that better reflects spontaneous cough in patients. It is also possible that coughs occurring at the end of cough bouts, originating from low lung volumes, may involve significant effort at a relatively low acoustic range.31 Our study of spontaneous coughs in a single patient did include bouts of cough. In this patient, the association between cough sound power and oesophageal pressure and peak cough was significant despite the inclusion of cough bouts. The impact of cough bouts on the strength of cough needs further investigation in a large cohort of patients. We reported the magnitude of cough using measures of flow and pressure. Electromyography (EMG) of the abdominal muscles is an alternative measure, as it reflects expiratory muscle activation and force, but there is no consensus regarding the optimal muscle group that reflects cough motor response and the analysis of EMG is more technically challenging compared with other physiological parameters.5 32 Future studies should investigate the relationship between cough sound and EMG. The relationship between cough sound intensity and quality of life also requires further study. We studied healthy volunteers and patients with chronic cough. Our study was not powered to perform subgroup analyses in patients with chronic cough by aetiology of cough. Further studies in patients with weak cough due to conditions such as neuromuscular disease are warranted to validate our findings in those populations. We studied cough sound repeatability in healthy subjects but not in patients with chronic cough—this requires evaluation. Subjects’ rating of the perception of cough strength may have been influenced by a potential training effect introduced with the use of visual feedback of cough oesophageal pressure measures earlier in the study protocol. The impact of a training effect was minimised by conducting the subjective assessments study at a separate sitting and blinding patients to their oesophageal pressure measurements. The face mask, which was used to house a pneumotachograph for the measurement of cough flow, may have introduced a filtering effect on cough sounds. However, we found that the performance of cough sound measures derived from the free-field microphone was comparable to that of the laryngeal contact microphone, which would have been less affected by a face mask. Furthermore, since we performed within-subject analyses in our study, any filtering effect would be minimised. Future studies using novel technologies such as optoelectronic plethysmography or structured light plethysmography, which do not require a pneumotachograph, could confirm our findings.33 34 Finally, we performed all studies in a quiet room, free from ambient noise. Future studies will need to investigate the effects of ambient noises.
In conclusion, cough sound power and energy correlate strongly with cough flow and pressure and subjective rating of cough strength. Cough sound measures were highly repeatable. Our findings support the potential for cough sound analysis as an objective and non-invasive method for measuring cough strength. We recommend further studies to investigate its application in the clinical assessment of cough.
References
Footnotes
Acknowledgements We would like to thank the volunteers for their participation in the study, Dr Abdel Douiri for assistance with statistical analysis and King's College Hospital for an unrestricted investigator led research grant.
Contributors Study concept and design: KKL, SB; Acquisition of data: KKL, KW; Analysis and interpretation of data: KKL, SM, GFR, JM, DHE, SB; Drafting of the manuscript for important intellectual content: KKL, JM, SB; Revision of manuscript: KKL, SM, KW, GFR, JM, DHE, SB.
Competing interests None declared.
Ethics approval East London and the City Research Ethics Committee.
Provenance and peer review Not commissioned; externally peer reviewed.
Data sharing statement King’s College Hospital NHS Foundation Trust.
Data sharing statement No additional data are available