Article Text

Abstract
Objectives Self-rated health (SRH) is an assessment and predictor of health based on an individual’s general condition; however, evidence of the value of SRH for predicting frailty remains scarce for older Asian adults. This study aimed to evaluate the relationship between SRH score trajectory and frailty among older individuals in Taiwan.
Design An 8-year retrospective cohort study.
Setting Data were retrieved from the Taiwan Longitudinal Study on Aging from 1999 to 2007.
Participants Respondents aged 53–69 years old who were not frail or disabled in 1999 (n=1956).
Primary and secondary outcome measures Frailty was defined using the Fried criteria. The group-based trajectory modelling technique was used to estimate SRH trajectories. Logistic regression analysis was used to examine the associations between changes in SRH and frailty.
Results Four SRH trajectory classes were identified across the 8-year follow-up: 232 participants (11.9%) were classified into the constantly poor SRH group, 1123 (57.4%) into the constantly fair SRH group, 335 (17.1%) into the constantly good SRH group and 266 (13.6%) into the good-to-fair SRH group. After adjusting for gender, age, level of education, income, social participation, health behaviours and major comorbidities, it was found that age, poor income satisfaction, without job and constantly poor SRH were associated with increased risk of frailty, while constantly good SRH (OR 0.04, 95% CI (0.01 to 0.32)) and good-to-fair SRH (OR 0.19, 95% CI (0.06 to 0.63)) were associated with reduced risks of frailty.
Conclusions Constantly poor SRH was associated with an increased risk of frailty in older age. SRH in older adults should be recognised as a predictive tool for future frailty. Diet and exercise interventions may help to prevent frailty among high-risk older individuals with constantly low SRH.
- geriatric medicine
- public health
- epidemiology
Data availability statement
Data are available upon reasonable request. The datasets used and analysed during the current study are not publicly available, but are available from the corresponding author on reasonable request with the permission of the Ministry of Health and Welfare, Taiwan.
This is an open access article distributed in accordance with the Creative Commons Attribution Non Commercial (CC BY-NC 4.0) license, which permits others to distribute, remix, adapt, build upon this work non-commercially, and license their derivative works on different terms, provided the original work is properly cited, appropriate credit is given, any changes made indicated, and the use is non-commercial. See: http://creativecommons.org/licenses/by-nc/4.0/.
Statistics from Altmetric.com
Strengths and limitation of this study
To the best of our knowledge, this is the first long-term study to investigate the relationship between self-rated health trajectory and frailty in an Asian population based on a nationally representative sample.
Reporting bias could have occurred because all data were collected through self-reporting and not measured objectively.
Frailty was defined according to a modified phenotype definition and assessed using questionnaire data.
Background
Ageing has become a serious challenge globally in both Western and developed Asian countries. The WHO defines an aged society as a population in which people over 65 years old comprise more than 14% of the total population. According to the Department of Health of Taiwan, the proportion of people over 65 in Taiwan increased from 8.6% to 10.7% between 2000 and 2010.1 The Department of Development predicts this figure will rise to 20% by 2027,2 which would represent the fastest rate of ageing in the world. Due to the rapidly ageing population, the annual crude mortality rate for Taiwanese citizens over 65 increased from 46.9% to 68.5% between 1981 and 2010.1 3
Many key indicators can be used to predict the future health of older adults, such as the self-rated health (SRH) score. SRH refers to a single question, such as, ‘In general, would you say that your health is excellent, very good, good, fair or poor?’.4 SRH is an assessment and predictor of health based on an individual’s general condition and subjective feelings about their physical, psychological and social well-being, combined with objective measurements of health. Several studies have demonstrated consistency between SRH and individual health status and have shown SRH can predict future mortality, disability and other adverse health outcomes.5–12
Frailty has been proven to be one of the most important key indicators of the health of older people in recent decades. Frailty is a geriatric condition characterised by increased vulnerability and decreased capacity to maintain homeostasis, and prefrailty refers to a condition that meets one or two of the criteria for the Fried frailty phenotype.13 Frailty in later life has been proven to lead to a number of adverse health outcomes and a poor quality of life.14–18 As frailty can be addressed by proper recognition and treatment, such as diet and exercise, it is important to identify risk factors for frailty in older adults.19
Several studies have explored the relationship between SRH and frailty.20–22 A population-based study of more than 2000 healthy participants conducted in Finland by Huohvanainen et al found that SRH in midlife could predict frailty, prefrailty and mortality in later life.23 However, most previous studies were conducted in Western countries; evidence of the value of SRH for predicting frailty remains scarce for older Asian adults, especially from long-term observation. The problem with long-term observations of older adults is that rapid changes in biological function and psychosocial processes occur over time in this population, and it is not possible to detect these changes using traditional statistical methods. Thus, the group-based trajectory model (GBTM) was developed, which provides a statistical standard for establishing the influence of life trajectory.24 25 The aim of this study was to explore the long-term relationships between SRH trajectories and future frailty in older Taiwanese adults using a national population-based cohort study design.
Methods
Data sources
We retrieved data from the Taiwan Longitudinal Study on Aging (TLSA), a population-based, national representative study initiated by Taiwan’s Bureau of Health Promotion and the University of Michigan’s Population Studies Center and Institute of Gerontology in the USA. Data were collected from systematically selected representative samples of the Taiwanese population, including institutionalised older people. In the TLSA, a three-stage systematic random sampling design was used for the selection of an equal probability sample.26 We believe that the TLSA contains samples that are highly representative of the true population structure under this kind of sampling method. Personal interviews were conducted by highly trained interviewers. To ensure high data quality collection, careful supervision was provided during data collection, and data processing was conducted by a professional data entry company.
The TLSA was started in 1989 and six waves of data collection had been completed by 2007. For this study, we used the 1999 sample, which included 2130 subjects aged 53–69 years old in 1999. We followed up this cohort for 8 years and used data from 2007 to analyse outcomes. The Population Studies Center at the University of Michigan reviewed the representativeness of the completed sample, and the analysis showed that the sample was highly representative, with a 90.6% response rate. Details of the study design have been described elsewhere.27–29
Study group identification
We analysed the 1999 sample, which included 2130 subjects aged 53–69 years old in 1999. Individuals who had developed frailty in 1999 or who had any functional disability in 1999 were excluded from the study. A participant was deemed to have functional disability if he or she had trouble with at least one activity of daily living, including bathing, dressing, eating, getting out of bed, walking and using the bathroom.30 The reason that we excluded people with frailty or disability at baseline was because both frailty and disability could have substantially affected the outcome. Thus, 1956 subjects were included in the final analysis.
Research variables
Demographics
For each eligible subject, we gathered data in 1999 on age, gender, level of education, marital status, income level, social participation, employment status, smoking, alcohol consumption and chronic diseases. We gathered SRH data in 1999, 2003 and 2007. Level of education was classified into four groups: illiterate (0 years), elementary school (1–6 years), junior to senior high school (7–12 years) and college or above (>12 years). Income level was determined by asking individuals how they felt about their income level. The possible answers were very satisfied, satisfied, fair, unsatisfied and very unsatisfied. We classified the income levels as ‘‘good’’ (rated very satisfied, satisfied), ‘fair’ (rated fair) or ‘‘poor’’ (unsatisfied or very unsatisfied).
Health factors
SRH was determined by asking individuals how they rated their current health. Possible answers were excellent, good, fair, poor and very poor. We reclassified the individuals into three groups based on SRH: good (rated excellent or good), fair (fair) or poor (poor or very poor). We reclassified SRH from five groups to three groups, so that there were enough participants in each group to provide sufficient statistical power.
Social participation was determined based on whether individuals performed either paid or voluntary work or participated in community activities. The individuals were classified into two groups based on job status in 1999: with a job and without job.31 Participants were considered to be employed (‘With a job’) if they chose the response ‘I had a job whether it was fulltime or part-time job’ or ‘I had a job but took a leave temporarily’. Participants were considered to be unemployed (‘Without job’) if they chose the response, ‘I had no job and was looking for a job’. or ‘I did not do any job’. The number of chronic diseases suffered by each individual was recorded, including hypertension, diabetes, cardiovascular disease, stroke, cancer, chronic respiratory diseases, arthritis or rheumatoid diseases, gastric diseases, hepatobiliary diseases and kidney diseases. Information about chronic conditions was ascertained by a positive answer to the question, ‘Have you ever been told by a doctor that you suffer from…’.
Outcome
Data regarding frailty were collected in 2007 as the outcome measure. Frailty was defined according to the Fried criteria.13 Individuals who exhibited at least three of five traits (ie, weight loss, exhaustion, low physical activity, slowness and weakness) were considered frail. Individuals meeting only one or two of the five traits of the Fried frailty criteria were regarded as prefrail. We used substitute evaluations for these five traits because we retrieved data from questionnaires, and this modified frailty definition has been widely used and previously published with validity.32–34 The parameter ‘decreased appetite’ was used instead of ‘body weight loss’ to represent nutritional status. Hence, participants who reported poor appetite often in the previous week were classified as having the trait ‘shrinking’. For mobility, we used walking/moving in and around the house instead of gait speed. Participants who had difficulty or were unable to walk a distance of 200–300 m were considered slow. For strength, we used the ‘lifting heavy groceries’ parameter instead of ‘hand grip strength’. Participants who had difficulty or were unable to carry 12 kg of groceries were considered weak. For physical activity, we used the duration of leisure time/physical activities per week instead of the level of physical activity. Participants who did not take a walk, hike or jog, do gardening or participate in other outdoor activities at least once or two times a week were considered to have low activity. We used the questionnaire of the Center for Epidemiologic Studies Depression Scale to determine the level of energy. Participants who reported, ‘I could not get going’ or ‘I felt everything I did was an effort’ often or most of the time in the previous week were considered to be exhausted. As nearly all older people approaching end of life have functional disability and frailty, we regarded those who died during the study period as having frailty in our study.35
Statistical analysis
GBTM was applied to determine the SRH trajectories. GBTM is a finite mixture model and also a semiparametric model for longitudinal data. We chose this model because it postulates a discrete distribution of the population, which makes it possible to distinguish groups/classes of homogeneous individuals within the population.36 We used the three groups based on SRH, good (rated excellent or good), fair (fair) or poor (poor or very poor), as indicators to generate the model and employed the Bayesian Information Criterion to identify the most appropriate model groups.37 Previous geriatric research studies have used this model.27 33 34 38 39 For the descriptive analysis, we used analysis of variance and the χ2 test to compare continuous and categorical variables, respectively. Logistic regression was used to analyse the relationship between SRH trajectories and frailty, with adjustments for age, gender, level of education, income level, marital status, number of chronic diseases, social participation, smoking, alcohol consumption and employment status. Statistical significance was set at p<0.05. All data were analysed using SPSS (V.22.0, IBM, Chicago, Illinois).
Patient and public involvement
Patients or the public were not involved in the design, or conduct, or reporting of our research. However, the Taiwan Association of Gerontology and Geriatrics, who listens to and represents geriatric patients, will help to disseminate our plans, which are based on our research results.
Results
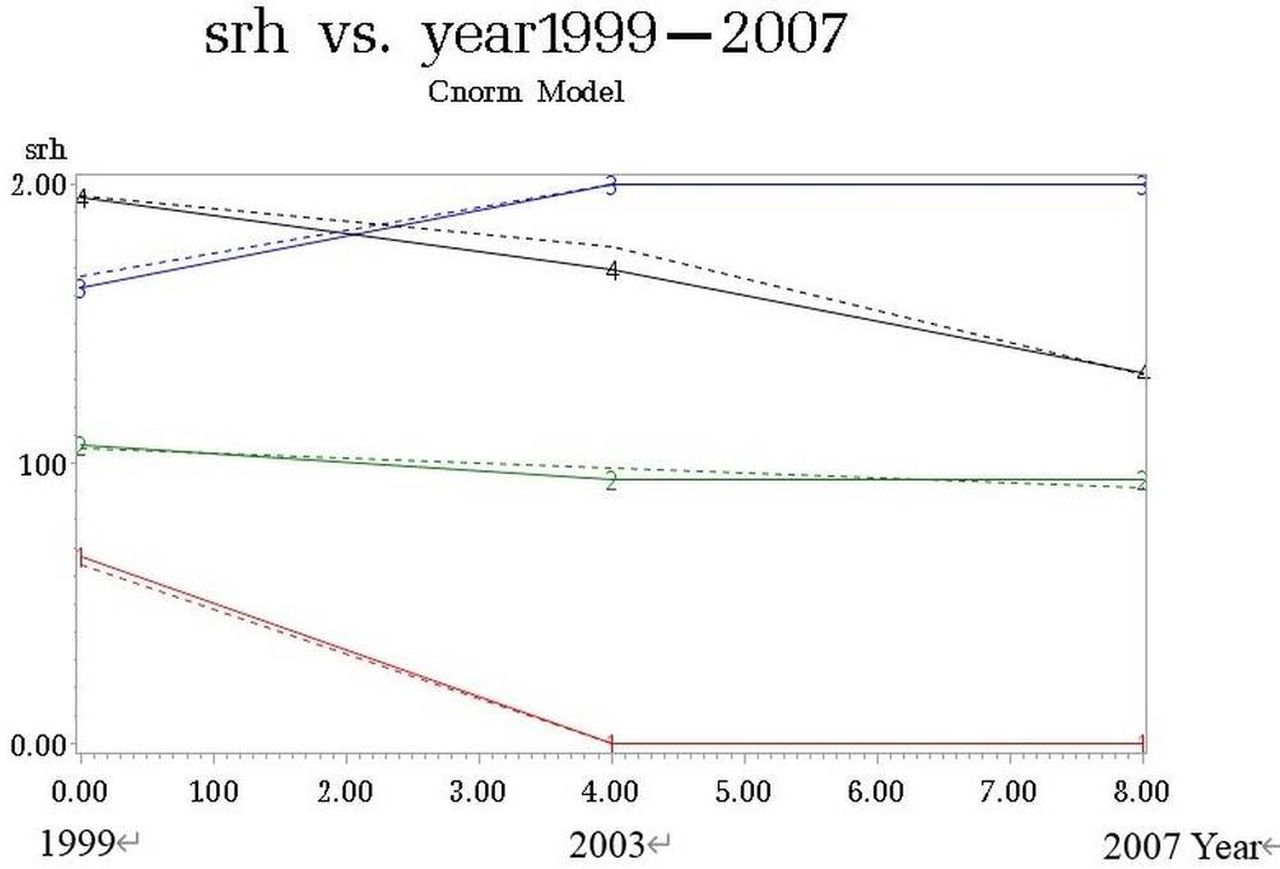
Figure 1 shows the flowchart of this study, including data collection from 1999, 2003 and 2007. Table 1 shows the descriptive data for all subjects. A total of 1956 subjects with an average age of 61.46 years were included in the final analysis. Most subjects had 1–6 years of education, had a fair income level and were married. The average number of chronic diseases was 1.21. After GBTM was applied, four trajectories of SRH were generated from 1999 to 2007 (figure 2). There were 232 participants (11.9%) in the constantly poor SRH group, 1123 participants (57.4%) in the constantly fair SRH group, 335 participants (17.1%) in the constantly good SRH group and 266 participants (13.6%) in the good-to-fair SRH group. Age distribution, sex, level of education, income level, social participation, marriage status, alcohol consumption and job status were significantly different among the four SRH trajectory classes.

Flowchart of the study design. Flowchart showing the patient inclusion and exclusion processes, and the process of group-based trajectory analysis. SRH, self-rated health; TLSA, Taiwan Longitudinal Study on Aging; BIC, Bayesian Information Criterion.
Demographic and clinical characteristics of the participants grouped by SRH trajectories

Trajectories of SRH score between 1999 and 2007. After group-based trajectory analysis, there were 232 participants (11.9%, group 1) in the constant poor SRH group, 1123 participants (57.4%, group 2) in the constant fair SRH group, 335 participants (17.1%, group 3) in the constant good SRH group and 266 participants (13.6%, group 4) in the good-to-fair SRH group. SRH, self-rated health.
Univariate logistic regression of the associations between the demographic and clinical characteristics and frailty is presented in table 2. All variables, except for marital status and smoking behaviour, were significantly associated with frailty.
Univariate logistic regression of demographic and clinical characteristics predicting frailty
Table 3 illustrates the results of the multivariate logistic regression analysis of the relationships between SRH trajectories and frailty. After adjustments for relevant factors, including age, gender, level of education, income level, social participation, alcohol consumption behaviour, number of chronic diseases and job status, logistic regression analysis revealed age, poor income satisfaction, without job and constantly poor SRH were associated with an increased risk of frailty (OR 3.09, 95% CI (2.04 to 4.69) for constantly poor SRH), while constantly good SRH (OR 0.04, 95% CI (0.01 to 0.32)) and good-to-fair SRH (OR 0.19, 95% CI (0.06 to 0.63)) were associated with a decreased risk of frailty compared with constantly fair SRH.
Multivariate logistic regression of SRH trajectories predicting frailty
Discussion
In this population cohort study, we created a trajectory-based model for 1956 Taiwanese adults aged 53–69-year old in 1999. Based on their SRH trajectories over the 8-year follow-up, the cohort could be classified into four groups: constantly poor SRH, constantly fair SRH, constantly good SRH and good-to-fair SRH. Multivariate logistic regression demonstrated an elevated risk of frailty for the constantly poor SRH group. We also observed significant protective effects for the groups with constantly good SRH and good-to-fair SRH.
To the best of our knowledge, this is the first long-term study to investigate the relationship between SRH trajectory and frailty. Our results are consistent with previous studies, which investigated SRH at a single time point. Huohvanainen et al found that poor SRH in midlife was associated with prefrailty, frailty and mortality in later life after 26 years of follow-up in Finland.23 A short-term study of 22 institutionalised older individuals by Gijzel et al found that variance in the SRH score time series was significantly higher in frail participants across physical, mental and social domains.40 Baddour et al reported that SRH correlated moderately with frailty and found that good-to-excellent SRH was predictive of non-frail status and preservation of activities of daily living.41
We believe this study provides strong evidence of a causal relationship between SRH and frailty. First, this study was a well-designed cohort study with nationally representative subjects and we excluded those who had disability and frailty at baseline. Second, a significantly elevated risk of frailty was observed in the poor SRH group, even after adjusting for confounding factors related to frailty, including age, gender, level of education, income level, major disease, health behaviours, social participation and employment status in the multivariate regression analysis. Third, in the analysis of the relationships between SRH trajectory and frailty, the constantly poor SRH group had an elevated risk of frailty, and significant protective effects were observed for the constantly good SRH and good-to-fair SRH groups. Thus, a causal relationship may exist between SRH and frailty.
However, some studies have suggested that in the relationship between SRH and frailty, the direction of causality may be different. Pinto et al discovered that SRH is a mediator variable between physical and mental health and life satisfaction.42 Possibly, low-level daily activities prevent older adults from participating in community activities, leading to poor subjective health and life satisfaction. Our study showed that constantly poor SRH would lead to increased incidence of frailty, and we believe that this causal relationship does exist, because several studies have identified mechanisms that potentially link SRH to frailty. Dysregulation of neuroendocrine processes and the immune system may lead to further vulnerability and lower resistance,43 and previous studies showed that inflammatory responses are related to SRH. Christian et al found that poorer SRH was associated with elevated serum inflammatory markers, such as IL-6 and CRP, among generally healthy older adults.44 These inflammatory markers have been associated with frailty. Low physical activity could also be a factor. Granger et al reported that high levels of physical activity were positively associated with self-rated ‘good health’ status in European adolescents.45 Additionally, Savela et al found that a higher level of physical activity from midlife onwards was strongly associated with a lower risk of frailty in old age.46 Further investigation is warranted to explore this intervention for the prevention of frailty in people whose SRH is poor and to evaluate its cost-effectiveness.
Strengths and limitations
This study has several strengths. First, this 8-year retrospective cohort study was based on a nationally representative sample with extremely high survey response rates. The database contained data from a large, randomly selected population; thus, the external validity is high. Second, our analysis of SRH trajectory as a predictor of frailty strengthens the evidence of a causal relationship between SRH and frailty. Moreover, the study design included a trajectory-based model analysis, which minimised the possibility of misclassification bias, as SRH can change over time. Third, we adjusted for numerous confounding factors, including age, gender, level of education, income level, major disease, health behaviours, social participation and job status.
However, this study also has several limitations. First, all data were collected through self-reporting and were not measured objectively, which could have resulted in reporting bias. Additionally, proxy respondents completed the follow-up questionnaire for subjects who were severely ill, which possibly generated reporting bias. Second, the associations between SRH and frailty could be bidirectional. For example, a subject may experience poor SRH due to frailty. However, we attempted to address this issue by using a longitudinal study design and excluding people with frailty and/or disability at baseline, as frailty and/or disability could substantially affect the outcome. The design of this study also helped to eliminate the possibility of reverse causality. We also adjusted for a number of major chronic diseases to reduce the influence of bias. Third, when GBTM was applied, differences between subgroups could be determined, but not differences within subgroups. This was because in GBTM, it was assumed that all individuals in a trajectory class had the same behaviour.47 Thus, different trajectory modelling techniques could be applied to examine any differences in a specific SRH trajectory in future research. Fourth, we used subjective assessment for variables such as SRH or income level, and these measurements could, therefore, have been influenced by mood states such as depression48 or poor cognitive function, which may occur in certain diseases, such as dementia. Thus, further study is warranted to explore the relationships among SRH, depression, dementia and frailty. Fifth, interaction effects may have affected the results. For example, women have consistently reported poorer SRH compared with men in previous studies. Future research should take this issue into consideration. Finally, survival bias could have occurred due to multiple subjects being lost to follow-up, which is a common problem in cohort studies.
Conclusion
Poor SRH in older adults was associated with a higher risk of developing frailty, and constantly poor SRH appeared to confer a greater risk of frailty in older adults. Moreover, maintaining stable, good SRH may help to prevent frailty in later life. Thus, we suggest that policymakers design and implement programmes to regularly screen SRH in older adults. Further studies are necessary to define practical strategies for reducing the risk of disability and death among older adults with constantly poor SRH, thereby improving the quality of life of older people.
Data availability statement
Data are available upon reasonable request. The datasets used and analysed during the current study are not publicly available, but are available from the corresponding author on reasonable request with the permission of the Ministry of Health and Welfare, Taiwan.
Ethics statements
Ethics approval
The current study was approved by the Institutional Review Board of Health Promotion Administration, Ministry of Health and Welfare (Approval no. BHP-2007–002).
Acknowledgments
We thank our colleagues from Chung Shan Medical University, Taichung, Taiwan for assisting with the statistical analysis. The sponsor had no role in the design, methods, subject recruitment, data collection, analysis or preparation of paper.
References
Footnotes
Contributors The individual contributions of all authors: M-CL conceived of the study and supervised all aspects of its implementation. W-MC completed the analyses and drafted the content. Y-HH, S-HL and P-SH assisted with the study design and revised the content. H-EH and C-JY assisted with the statistical analysis and revised the content. All authors helped to conceptualise ideas, interpret findings and review drafts of the manuscript.
Funding This work was supported by the Ministry of Health and Welfare, Taiwan (grant number: M06M2346 awarded to M.-C.L.).
Competing interests None declared.
Patient and public involvement Patients and/or the public were involved in the design, or conduct, or reporting, or dissemination plans of this research. Refer to the Methods section for further details.
Provenance and peer review Not commissioned; externally peer reviewed.