Article Text

Abstract
Objective Patient-reported outcomes (PROs) provide self-reported patient assessments of their quality of life, daily functioning, and symptom severity after experiencing an illness and having contact with the health system. Feeding back summarised PROs data, aggregated at the health-service level, to healthcare professionals may inform clinical practice and quality improvement efforts. However, little is known about the best methods for providing these summarised data in a way that is meaningful for this audience. Therefore, the aim of this scoping review was to summarise the emerging approaches to PROs data for ‘service-level’ feedback to healthcare professionals.
Setting Healthcare professionals receiving PROs data feedback at the health-service level.
Data sources Databases selected for the search were Embase, Ovid Medline, Scopus, Web of Science and targeted web searching. The main search terms included: ‘patient-reported outcome measures’, ‘patient-reported outcomes’, ‘patient-centred care’, ‘value-based care’, ‘quality improvement’ and ‘feedback’. Studies included were those that were published in English between January 2009 and June 2019.
Primary and secondary outcome measures Data were extracted on the feedback methods of PROs to patients or healthcare providers. A standardised template was used to extract information from included documents and academic publications. Risk of bias was assessed using Joanna Briggs Institute Levels of Evidence for Effectiveness.
Results Overall, 3480 articles were identified after de-duplication. Of these, 19 academic publications and 22 documents from the grey literature were included in the final review. Guiding principles for data display methods and graphical formats were identified. Seven major factors that may influence PRO data interpretation and use by healthcare professionals were also identified.
Conclusion While a single best format or approach to feedback PROs data to healthcare professionals was not identified, numerous guiding principles emerged to inform the field.
- Clinical audit
- public health
- audit
- health services administration& management
This is an open access article distributed in accordance with the Creative Commons Attribution Non Commercial (CC BY-NC 4.0) license, which permits others to distribute, remix, adapt, build upon this work non-commercially, and license their derivative works on different terms, provided the original work is properly cited, appropriate credit is given, any changes made indicated, and the use is non-commercial. See: http://creativecommons.org/licenses/by-nc/4.0/.
Statistics from Altmetric.com
Strengths and limitations of this study
This scoping review provides a novel summation of the published and grey literature of the guiding principles for effectively feeding back patient-reported outcome data to healthcare providers.
The search strategy was broad, including individual patient-level, health service-level and system-level reporting of patient-reported outcome data to ensure no relevant articles were missed.
The grey literature search was restricted to seven countries due to the limited timeframe for completing the study.
Two reviewers conducted the literature syntheses, with one person completing the academic synthesis and one person completing the grey synthesis.
Using a standardised data extraction process for both types of literature, the findings from this review inform the rapidly growing fields of improvement science and implementation research related to health service-level reporting of aggregate patient-reported outcome data to healthcare professionals.
Introduction
There is growing interest in the use of patient-reported outcomes (PROs) for all aspects of healthcare. This is because information available from administrative and routinely collected clinical data does not provide a comprehensive picture related to health outcomes once patients leave hospital.1 PROs are outcome data collected directly from patients about their health and the potential impacts of treatments or management within the health system.2 PROs are differentiated from patient-reported outcome measures (PROMs), which are the instruments or survey tools used to obtain PROs.3 Reporting of PROs data can occur at the individual patient level and be used to inform decisions about patient-centred care, or at the aggregated service and system levels, and may be used to assess and compare organisational performance or for population surveillance.4 5
PROs were originally developed for use in research, such as comparative effectiveness studies and clinical trials.6 7 However, the value of using PROs to inform clinical practice has since been realised.8 9 PROs have evolved in a somewhat disparate manner between different countries, with each country aligning the use of PRO collections with a slightly different emphasis.5 For example, in England the focus of PRO collections is on hospital performance in selected elective surgeries; whereas in the Netherlands and Sweden, collection of PROs predominately occurs through disease-specific Clinical Quality Registries (CQRs).5
Healthcare professionals have reported challenges in relation to interpreting the meaning and implications of PROs data.6 10 These challenges can arise due to the variation by which PRO data are used, scored and reported.6 Methods for optimising the feedback of PRO data to healthcare professionals are an emerging field of research.2 11 12 Currently, little is known about the best methods for providing summarised PROs data in a way that is meaningful for healthcare providers. To the best of our knowledge, there is currently little empirical evidence available to support best practice in the feedback methods for PROs data, particularly at the health service level.
The aim of this review was to investigate the emerging approaches to the feedback and reporting of PROs data to healthcare professionals, in order to understand how to increase engagement and uptake of these data. Three questions were used to explore this aim: (1) What is the existing evidence on best practice in the readability and feedback of PROs data to healthcare professionals? (2) What PROs data presentation formats have the most utility for healthcare professionals? (3) Are there factors that influence PROs data interpretation or use in clinical practice?
Methods
The rapid scoping review was undertaken by a research team with clinical expertise (nursing, allied health, psychology) from the Australian Stroke Clinical Registry (AuSCR) with over 10 years’ experience collecting and reporting generic and disease-specific PROs in consultation with end-users who work in hospitals or government.13 Consultation was undertaken with government representatives from the Victorian Agency for Health Information (VAHI) including author PK, who are collecting PROs data on an ongoing basis from health services, including hospitals. Weekly team meetings were held to ensure a standardised screening and data extraction process, whereby information about papers under consideration was discussed based on the information gathered by author SLH (Honours, Psychology) or OFR (Honours, Health Information Management) using the relevant data extraction tool.
The methods used for the review (including inclusion criteria, search strategy, extraction and synthesis) were specified in advance in an unpublished protocol, based on the Joanna Briggs Institute Guidelines for conducting a scoping review.14 Two search strategies were used. The first covered the academic, peer-reviewed literature and the second covered grey literature (such as government reports and policy documents). Different strategies were used to search the two sources of evidence. Rapid review methods using recommended approaches by the Cochrane collaboration15 were drawn on for this scoping review. The Preferred Reporting Items for Systematic reviews and Meta-Analyses extension for Scoping Reviews (PRISMA-ScR) was used to report results.16
Academic literature search
For the academic literature, four databases were selected, including: Embase; Ovid Medline; Scopus and Web of Science. These databases were chosen to maximise the scope of articles that were retrieved. The search included phrases related to the following terms and concepts: patient-reported outcome measures, patient-reported outcomes, patient centred care, value-based care, quality improvement, feedback, audit and dashboard. A full list of search terms and the combinations used is available in online supplemental table 1.
Supplemental material
Studies included were those that were published in English between January 2009 and June 2019, where the feedback methods of PROs to patients or healthcare providers were described. Studies prior to 2009 were excluded to accommodate a contemporary, timely and comprehensive summary. Abstract booklets, conference abstracts and newsletters were excluded. Publications for studies that were pilot/development/protocol projects, focused on testing a PROs measurement tool, or in which PROs were used as the endpoint outcome for an observational or comparative-effectiveness study, were excluded. Further, studies related to primary care, emergency care or non-acute conditions (eg, surgical interventions or interventional devices) were also excluded. The initial search was broad to include studies related to individual patient-level feedback of PROs data to ensure no relevant articles were missed, however, the synthesis of the literature focused primarily on health service-level reporting of aggregate PROs data to healthcare professionals.
All references identified from these searches were downloaded and imported into Covidence software.17 Following removal of duplicates, the screening process involved one reviewer (SLH, Honours Psychology) reading the titles and abstracts of each article to determine relevance using the inclusion and exclusion criteria outlined above. The full text of the relevant articles was then assessed by one reviewer (SLH), with a second reviewer (CW, Masters, Health Information Management) conducting an independent assessment on a subset of the articles to ensure standardisation. If any disagreements for study eligibility arose, these were resolved through discussion and consensus between the two reviewers. If disagreements were unable to be resolved using this approach, the article was to be reviewed by a third reviewer to determine eligibility. This latter process was not required. SK provided training for the team in conducting a review, as a past Cochrane reviewer. Additional support was provided by SK and DAC, who have extensive experience conducting literature reviews.18–20
Academic literature data extraction and charting
Data from the included academic literature were systematically extracted using a predetermined data extraction template by one reviewer (SLH). The extraction template was developed by the review team in consultation with VAHI representatives. The template was then piloted and adapted as necessary. The final extraction template included: characteristics of study participants (including age, profession, area of practice and number of participants), type of article, which PROs were used, the purpose of the feedback and the findings of the study. Findings were extracted from all included academic literature by selecting those text passages and outcomes that related to each research question. The academic data extraction tool is available in online supplemental appendix 1.
Supplemental material
Level of evidence and critical appraisal of the academic literature
The methodological design of all included articles was assessed according to the Joanna Briggs Institute Levels of Evidence for Effectiveness21 by SLH, in order to assess the quality and rigour of the evidence. Studies were assigned level 1 (experimental), level 2 (quasi-experimental), level 3 (analytical), level 4 (descriptive) or level 5 (expert opinion). Further, the included research articles were appraised for strength of evidence by one reviewer (SLH) using the critical appraisal tools from the Joanna Briggs Institute.22 Each article was assigned a rating of quality based on how many of the criteria the article fulfilled (eg, ‘Were the criteria for inclusion in the sample clearly defined?’). Studies that met all criteria were rated as very high, studies that met 80% or more of the criteria were rated as high, studies that met 60% or more, 40% or more, and less than 40% of the criteria were rated as moderate, low and very low, respectively. While critical appraisal assessments are not mandatory for conducting a scoping review,14 given the breadth of studies and their designs that we were anticipating, we felt that an assessment of the article quality was relevant to considering the evidence we were extracting.
Grey literature search
We elected to use similar methods to those of a previous PROs literature search conducted by Williams et al.5 The grey literature component of our search included Google searches, targeted website searches and snowballing of reference lists, where appropriate. The first 10 pages of results retrieved from each Google search were reviewed.5 The following search terms were used:
‘Use of Patient-Reported Health Outcome Measures in (country)’
‘Feedback of Patient-Reported Health Outcome Measures in (country)’
‘patient-reported outcome measure + feedback + use in (country)’
‘Benchmarking of Patient-Reported Health Outcome Measures in (country)’
Due to the limited timeframe for completing the study, the grey literature search was restricted to seven countries. The countries included in the Google searches were Sweden, the Netherlands, Finland, Canada, the UK, the USA and Australia. The selection of these countries was based on the prior research of Williams et al 5 which found substantial examples of the use of PROs within these regions. The websites of relevant leading organisations (ie, health agencies, government organisations, professional organisations, special interest groups, research institutes and universities) were also searched. For example, the websites of organisations such as: the Institute for Healthcare Improvement, the International Consortium for Health Outcomes Measurement (ie, the USA), the Dutch Institute for Clinical Auditing (ie, The Netherlands) and the Organisation for Economic Co-operation and Development were searched. Further, the websites and annual reports of national CQRs that were known to collect and report PRO data were also searched.
Similar to the inclusion criteria applied for the academic literature, materials that were published in English between 2009 and 2019 were included. Internet page entries without PROs data, focused on single-centred studies or testing PRO instruments, were excluded. We also excluded literature related to primary care, emergency care or surgical interventions/devices; did not relate to the target country or were duplicate entries.
Grey literature data extraction and charting
A second data extraction template was used for the grey literature. Data from the included grey literature were systematically extracted using a predetermined data extraction template by two independent reviewers (OFR, Honours, Health Information Management; and VM, Nursing). Similar to the methods used for the academic literature template, the grey literature data extraction template was developed by the review team in consultation with VAHI representatives. The final template included information on: the type of document, title, name of the organisation that produced the document, background PROM information, PROs data display features, PROs data feedback mechanism(s), the identified barriers and enablers to PROs uptake among clinicians, and PROs data issues (eg, statistical/analytical methods). The grey literature data extraction tool is available in online supplemental appendix 2.
Supplemental material
Collating and synthesising results
The data within the extraction forms used for the academic and grey literature templates were sorted according to which research question they contributed to answering. The findings were then grouped into themes (eg, missing data, healthcare professional education and training). Once established, each theme was presented and discussed between SLH, OFR and VM. The preferences of PROs data formats among healthcare professionals determined in the current study were summated from all articles that described PRO data format preferences. An inductive approach was used to analyse the qualitative findings to address the research question related to factors that influence PROs data interpretation or use, whereby themes were developed by studying the findings and were considered how they fit within the developing themes.
Patient and public involvement
No patients were involved in setting the review questions or in the design of the initial protocol and overall study. No patients were asked to advise on the interpretation and write-up of the results. This study forms the first component of a broader programme of work initiated by VAHI, and stakeholder engagement methods were used in the subsequent stages of the project.
Results
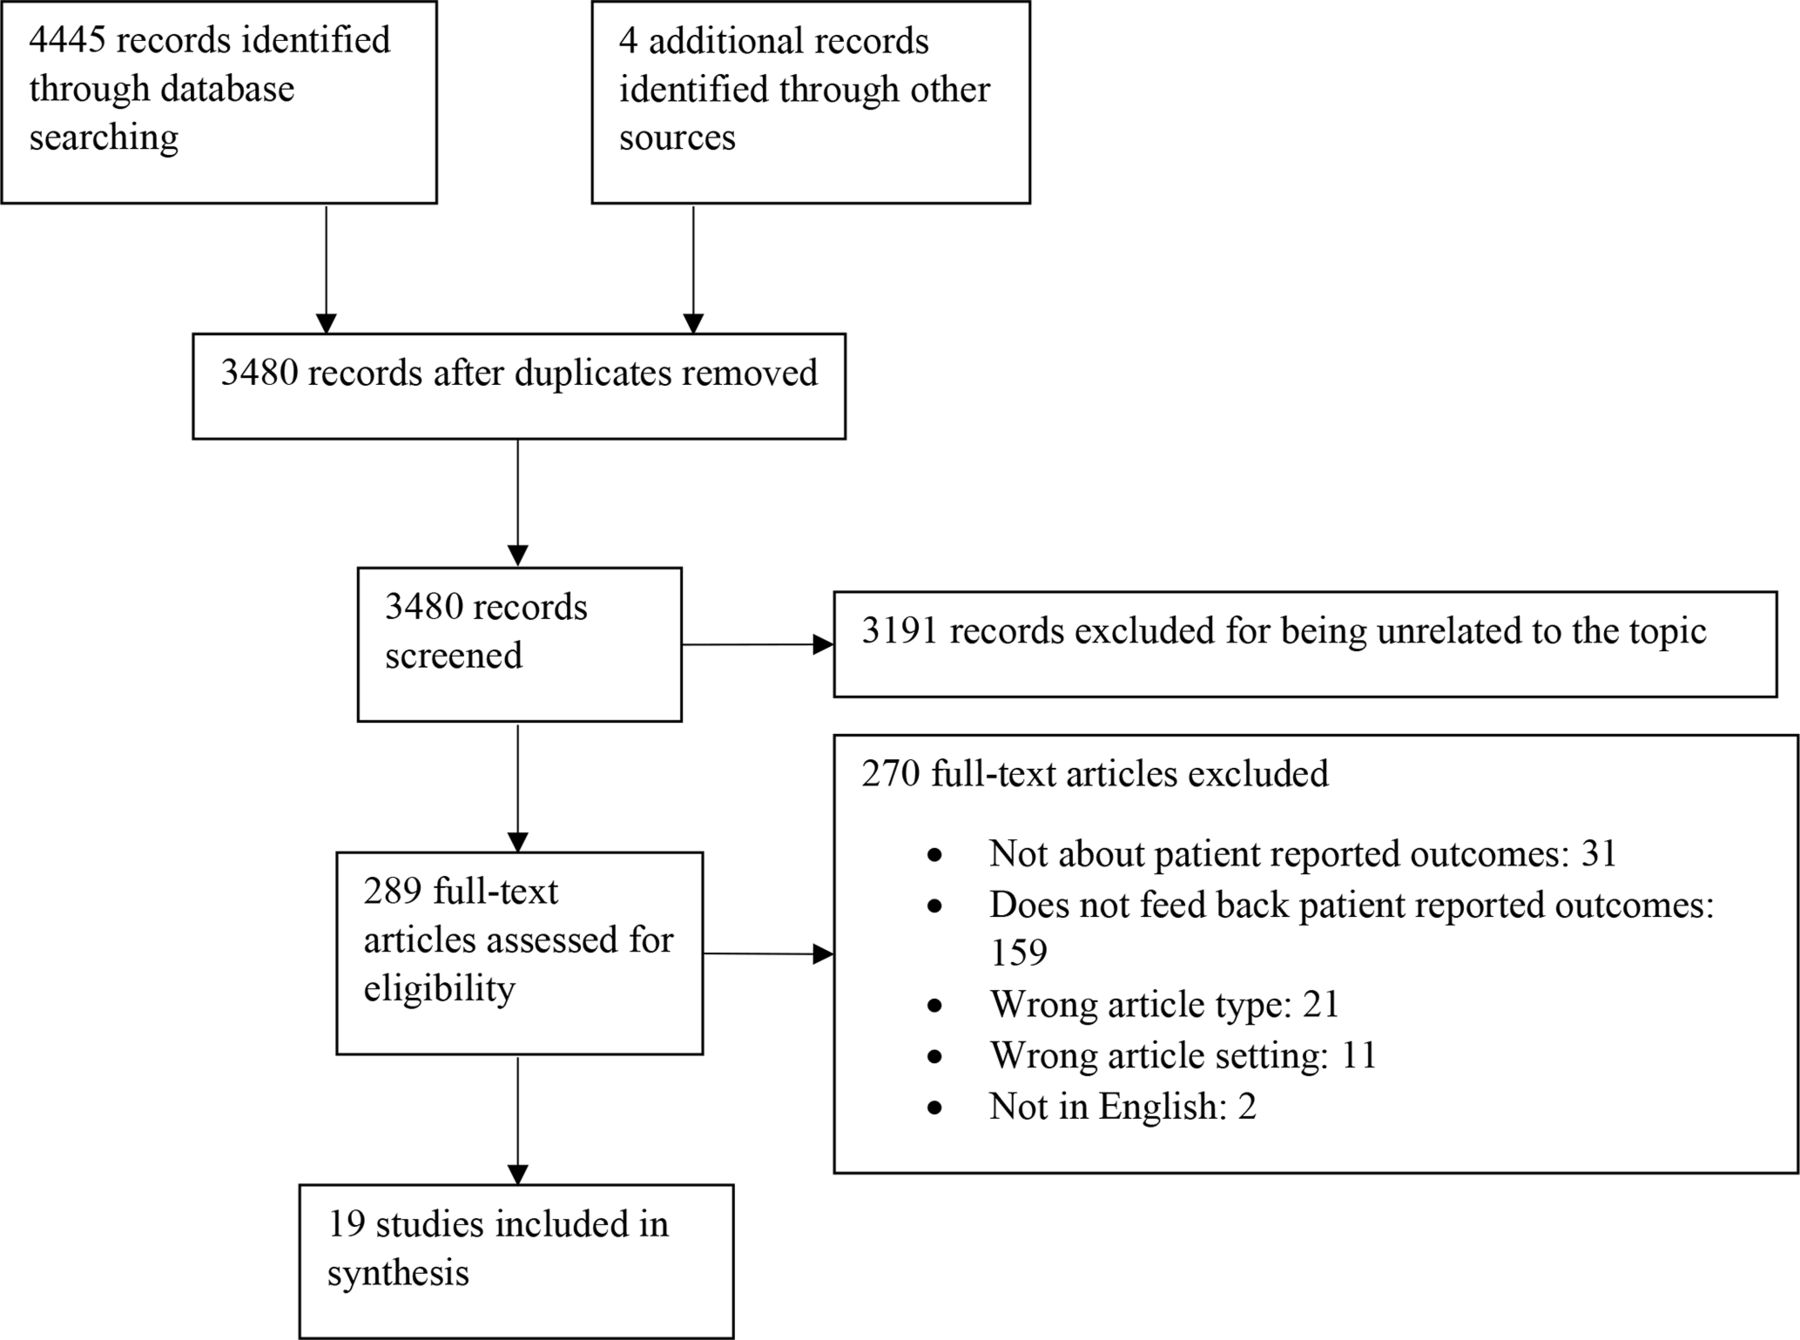
The initial search resulted in the identification of 4445 academic articles. Following the removal of duplicates, 3480 unique articles remained, 19 of which were included in the final review. Figure 1 summarises the academic literature search using a PRISMA flowchart.23 The publication characteristics, level of evidence and quality appraisal of the included academic literature are available in table 1. Research methods included 2 reviews,24 25 3 case studies,12 26 27 2 consensus panels,11 28 1 opinion article29 and 11 observational studies.2 6 30–38 According to the Joanna Briggs Institute Levels of Evidence for Effectiveness,21 the 19 included studies were classified according to the following levels: 1 (n=0), 2 (n=1), 3 (n=3), 4 (n=12), 5 (n=3). The studies were primarily conducted in the USA, Australia, Canada and European countries. From the grey literature search, 103 materials were determined to be topically relevant and were scanned for further information. Of these, a total of 22 were included in the final review, including 16 reports,1 3–5 39–49(Aspex Consulting, Evaluation Framework and Initial Appraisal of PROMS: Final Report, personal communications, 2018), 2 book chapters,50 51 1 dissertation,52 1 forum proceeding document,53 1 user’s guide54 and 1 research report.55 The summary of the included grey literature is available in table 2.
Shows the study identification and selection process that was applied to the academic literature during the study. The original database search resulted in 4445 records identified. An additional four records were identified from other sources. After duplicates were removed, there were 3480 unique records. The title and abstract screening process excluded 3191 records for being unrelated to the topic. The remaining 289 records underwent the full-text screening process, where 270 records were excluded for the following reasons: 31 were not about patient-reported outcomes, 159 did not feed back the patient-reported outcomes, 21 were the wrong article type, 11 were the wrong article setting and 2 records were not in English. Nineteen unique records were included in the final synthesis.
Characteristics of the included academic literature
Characteristics of the included grey literature
The following results are presented by research question.
What is best practice in the readability and feedback of PROs data to healthcare professionals?
Overall, the current evidence base provides some general guidance but inadequately describes specific optimal data display methods for the feedback of PROs data to healthcare professionals. From this review, several issues related to the reporting of PROs data to health professionals were explored and summarised, and recommendations identified to address these issues are provided below.
Authors from two publications suggested that in order to engage health professionals in reviewing PROs data, PROs reports need to be simplistic and easy to read.24 25 Suggested modifications to improve readability of feedback interventions included: reducing the number of metrics (ie, outcomes) presented within a report, minimising page counts, avoiding three-dimensional graphical elements, uncluttering reports to increase readability and including instructions where they will be needed.29
Six publications addressed the issue of directionality of PRO scores in graphical displays.2 11 12 35 38 55 A consensus panel found that there was no intuitive interpretation of symptom scores, with some people expecting higher scores to mean ‘better’ and other people expecting higher scores to mean ‘more’ of the symptom (and therefore worse).11 Healthcare professionals’ interpretation accuracy has been demonstrated to be greater for line graphs when higher scores indicated ‘better’ rather than indicating ‘more’.55 Despite these results, caution should be taken when modifying the directionality of PROs in order for all symptom scores to have the same directionality, due to potential confusion associated with inconsistencies across instruments.11 One suggestion to avoid potential confusion is to provide a label to denote ‘better’ alongside the chart to indicate the directionality of the PROs,2 38 or use coloured arrows: green for better scores and red arrows for worse scores.35
Further, the provision of a written explanation of the PRO score alongside the graph has also been recommended to assist with interpretation.29 Written explanations are particularly valuable for complex graphical displays.31 37 Another suggestion is to include descriptive labels (eg, mild/moderate/severe) alongside the chart, assuming data to support the use of these thresholds are available.11 27 The use of ‘traffic-light’ colours to colour code the thresholds has also been recommended to allow a quick and easy review.30 34–36
Displaying a reference population to use as a comparison was addressed in four publications.3 11 37 48 Reference populations, such as national averages or relevant norm information for peer groups, can help provide context for the interpretation of the PRO scores,37provided these data are available.11 However, there is a need to balance the complexity of presenting additional data and the healthcare professionals’ ability to understand the data.11 Furthermore, in an exploratory study, participants warned that providing comparison data can have unintended consequences, such as negative comparisons leading to reputational damage when the health service or healthcare professional is reported to be lesser performing in their PROs results.37
A cross-sectional mixed methods study in oncology reported that healthcare professionals indicated a preference towards the inclusion of statistical details for PROs data.6 There is a move away from reporting the p value alone to illustrate statistical significance, and instead the use of CIs is encouraged.6 11 The clinically important difference should also be included within the graphical representation of the PROs results, where appropriate.11 25 Though an asterisk is not recommended to indicate clinically important differences, as that symbol is commonly used to indicate statistical significance.11 Patients can find the inclusion of clinically important differences confusing,6 but it is valuable for them to know if the difference matters.11
What PRO data presentation formats have the most utility for healthcare professionals?
There are many different formatting approaches that have been used to display PROs results. Table 3 provides a summary of different formats that have been used to display PROs data, as well as an indication of the preference among healthcare professionals. Line graphs and bar graphs were identified as the most familiar and preferred format among healthcare professionals for comparing and reviewing their service.
Summary of different PRO data presentation formats
Are there factors that influence PRO data interpretation or use in clinical practice?
Within the current body of literature, several barriers and enablers associated with the use and uptake of PROs among healthcare professionals have been identified. However, the evidence base addressing these proposed challenges, or explicit recommendations to enable successful adoption of PROs among healthcare professionals, is limited.1 53 We identified seven factors that influence the interpretation of PROs: missing data, government and local leadership, healthcare professional education and training, engaging healthcare professionals to overcome resistance to change in clinical practice, case-mix adjustment, interoperability of information and communication technology (ICT) systems, and frequency/timeliness of feedback.
Missing data
Missing data pose a challenge with analysis and reporting of PRO results. Missing PROs data may be unavoidable due to a multitude of reasons. There may be specific population groups with missing PROs responses, or sensitive and difficult questions that may be omitted.50 Consequently, these instances may result in scepticism about completeness of the data among healthcare professionals.52
Achievement of high participation and completion rates at follow-up, both individually and at the aggregate level, influences overall usefulness of PROs data.39 However, due to the complex nature of PROs and their inevitable incompleteness in certain cases, strong evidence through a statistical analysis plan may assist in ensuring the resulting analyses, and reports are unaffected by missing data.50
The role of government and local leadership
It has been reported that ‘top-down’ approaches to PRO implementation, whereby government or management is driving the implementation process and performing the assessment and taking actions based on the roles, may be met with resistance from healthcare professionals.4 These endeavours can be complemented with ‘bottom-up’ approaches where PRO implementation is clinically driven and is more focused on quality improvement.4 The use of the data from these collections can be reported back at the micro-level (to inform decisions for individual patient care), as well as the meso-level (to assess performance of services and quality improvement) or the macro-level (to assess healthcare systems).4 5 Importantly, the most evidence for effectiveness of PROs feedback exists at the meso-level.5
Further, clinical/local champions and stakeholder initiatives are crucial to enhance healthcare professionals’ engagement with collecting and use of PROs data.53 Specifically, clinical champions may contribute to broader dissemination and use of PROs data among clinical units or within health services (Aspex Consulting, Evaluation Framework and Initial Appraisal of PROMS: Final Report, personal communications, 2018).
Healthcare professional education and training
Healthcare professionals’ education and training was addressed in nine publications.32 39 41 42 45 49 51 54 55 Healthcare professionals may not understand PRO data or know what to do with the results.39 49 There is a need to increase PRO-specific training and education to aid healthcare professionals’ ability to: interpret PRO data, integrate the use of PROs into clinical practice and respond to concerning PRO results.41 51 There is currently no recommendation for how to direct healthcare professionals to use and interpret PRO data or for how to respond to concerning results in a standardised, clinically appropriate manner.39 54 For example, our review found the need for disease-management pathways to be developed as a resource to respond to issues identified through PRO results.54 Implementation of a PRO training course has been demonstrated to improve attitudes and self-efficacy from healthcare professionals towards PRO data within the child mental health services.32
Engaging healthcare professionals to overcome resistance to change in clinical practice
There may be a lack of buy-in among the clinical community when healthcare professionals are uncertain or lack confidence in understanding how PROs results could be used to improve their clinical practice.42 As such, PROs should be implemented in a way that can be directly translated into specific actions for healthcare professionals, with clear recommendations on how to respond to PROs scores in clinical settings.26 28 Additional recommendations to improve healthcare professional buy-in include: co-designing data display formats and information content with healthcare professionals’ input to ensure the formats meet their needs,25 39 49and showcasing benefits to help health professionals see the merits of using PROs data.30 47
Analyses that include adjustment for differences in patient characteristics (case-mix adjustment)
Due to the differing characteristics of patients admitted to different health services, comparing outcomes between hospitals without case-mix adjustment may be misleading.53 Case-mix adjustments are particularly important to healthcare professionals.53 Case-mix adjustment uses statistical models to account for known variables that affect health (such as age, gender, ethnicity, symptom severity and socioeconomic background) to predict what each hospital outcome would be for a standard patient or population.1 The development of case-mix adjustment methods for PROs data are a widely recognised challenge in the field.1 48 53 For example, patients may be influenced by cultural, development or personality differences, contextual factors or life circumstances, and different health experiences or events when interpreting and responding to questions related to their health.53 Importantly, case-mix adjustment for PROs needs to be disease/condition specific, since demographic factors that may influence patients’ responses to PROs are likely to vary across patient cohorts and clinical settings.42 Published evidence related to the development of case-mix adjustment methods for PRO data is limited. Further development and refinement of robust case-mix adjustment methods is required to guide meaningful interpretation and use of PROs data.1 43 53
Interoperability of ICT systems
A lack of efficient, interoperable health information systems and robust data governance frameworks are a significant barrier to integration and reporting of PROs.44 48 ICT system interoperability issues prohibit patient-level linkage between datasets, impacting on the ability to conduct risk-adjustments and draw meaningful conclusions from some PRO collections.48
Frequency/timeliness of feedback
The frequency or timeliness of PROs feedback was addressed in 10 publications.3 5 29 30 37 45–47 52 53 Perceived time lags associated with PROs data feedback, such as reports fed back annually, may lead to information being discounted as irrelevant.29 45 53 One solution is to routinely report PRO results to healthcare professionals or provide the capacity for clinical teams to continuously retrieve and review their own data.46 52 Conversely, too much feedback could result in ‘alert fatigue’, which may lead healthcare professionals to ignore the PROs results.30 Despite reporting delays as a known barrier to healthcare professionals’ uptake of PROs, optimal intervals for feedback have seldom been investigated in this area.29 One suggested timing for audit and feedback to professional practice is one to four times a year for process and outcome indicators, but more frequently where there is greater possibility for improvement.37
A summary of the overall prevailing consensus-based guiding principles is outlined in box 1.
Summary of basic guiding principles
Recommendations to guide best practice in patient-reported outcome (PRO) data feedback to clinicians:
Reporting PROs data back to clinicians should be done in a simple format that is easy to read to reduce the chance of misinterpretation.25
Features that may be used to facilitate simple reporting include: reducing the number of metrics presented within a report and minimising page counts.29
PROs reporting should avoid mixing the directions of scores that are displayed. Exceptionally clear labelling, titling and annotations should also be used to increase interpretability.2 11 35
The use of coloured arrows (eg, green for better scores and red for worse scores) may enhance clinicians’ interpretation of PROs scores presented across different domains.35
Clinically significant differences and CIs should be included where possible. There is a move away from reporting just the p value.6 11
Recommendations for optimal data presentation formats:
The choice of which graphical format to use to display the PROs data will depend on the type of data (ie, single outcome/multiple outcomes, single time point/multiple time points, amount of data to display and so on) and the intended purpose of the data.24
Line graphs and bar graphs are preferred and reduce the chance of misinterpreting the data.24 33
The maximum number of bars presented within a bar graph should be six, while the maximum number of lines within a line graph should be four.24
More complex displays such as funnel plots or caterpillar plots should be accompanied by a description of how to interpret the graph.31
Recommendations to address barriers and enablers associated with feedback and reporting of PROs:
The inclusion of clinical/local champions is critical to generate buy-in from the clinical community (Aspex Consulting, Evaluation Framework and Initial Appraisal of PROMS: Final Report, personal communications, 2018).
PROs should be reported in a way that can be directly translated into specifications to guide clinicians to respond to concerning results.26
Training and education are needed to improve the clinician’s ability to interpret PRO data, to integrate the use of PROs into their routine practice and to respond to concerning results.39 51
The optimal time intervals for PROs feedback need to be determined. One suggested timeframe for audit and feedback to clinicians is one to four times a year.37
Discussion
PROs data may be used to improve the safety and quality of healthcare, but in order to achieve this, it is critical that feedback methods are optimised. This scoping review provides a novel summation of the published and grey literature of the guiding principles for effectively feeding back PROs data to healthcare providers. The overall synthesis of the literature revealed various issues that provide opportunities to advance this field.
What constitutes ‘best practice’ feedback for PROs is not yet firmly established. Despite this gap in the evidence, we were able to highlight multiple prevailing consensus-based approaches.
Studies on the feedback of PROs data are limited, however there is a large body of literature that informs graphical presentation of clinical data in general. This extensive research can inform understanding for the graphical representation of PROs. For example, similar graphical display features have been demonstrated in other forms of feedback to clinicians. In a review of quality dashboards used in clinical settings, Dowding et al 56 found that most dashboards used the ‘traffic-light’ colour coding in their displays to indicate what type of action is required. Converse to the suggestions made in the current review, Dowding et al 56 found that most dashboards used a table format to represent the data. Providing peer group data or benchmarking to enable comparison of current practice using clinical audits with feedback is also a common technique to improve engagement.57 58
To facilitate the successful uptake of PROs data in clinical practice, it is also recommended that a knowledge translation strategy is developed.59 Identification of local barriers and enablers, and the development of a theory-based integrative knowledge translation plan may support greater uptake and use of PROs data. Further, recommendations to improve knowledge translation have been identified in other types of clinical audit and feedback. The authors from multiple clinical audit and feedback studies have indicated that feedback is more effective when there is a local champion.60 61 The timeliness and actionability of the feedback are other factors that are consistently mentioned for effective clinical feedback.58 60 62 63 These findings are in line with the current study. Additional factors to improve the effectiveness of feedback include: providing feedback both verbally and in written format, and using feedback to decrease rather than increase certain behaviours.60
There have also been several initiatives to develop guidance on communicating data in general, which can further inform the development of PROs data feedback. In a guide published by authors from the National Cancer Institute,64 several suggestions for how to present data effectively are given, and multiple are in line with the current review, including: the use of labels and the use of colour. There are also additional suggestions including: the use of verbal qualifiers or metaphors to help explain the meaning of the numbers and rounding most decimals to the nearest whole number for ease of understanding. Simpson provides guidance on how to choose the appropriate graph type.65 Nominal and ordinal data can be displayed using a pie graph or bar chart, but interval and ratio data may have too many categories to be displayed in a pie chart. Further, box plots are best used to display variables that are not normally distributed.
Strengths of our review included that each reviewer used a predefined protocol and the information from the included literature was summarised using a template to ensure consistency. Despite our rigorous search strategy, several limitations deserve comment. Due to the available timeframe, both the academic and grey literature search and screening process were largely conducted by a single reviewer. This may have resulted in selection and interpretation bias as some relevant literature may have been overlooked. Further, the grey literature search was limited to only seven countries. Despite this limitation, it is reasonable to assume that, much like the standards available for the presentation of data in other healthcare settings, the general guiding principles for PROs data feedback would be consistent across jurisdictions and between countries. Overall, we found limited high-quality published evidence related to optimal feedback methods and formats for PROs data. Our findings here suggest that there is a need for more rigorous testing of PROs feedback methods in the future.
Future directions
PROs represent a key building block required to move towards a health system that can assess the value of healthcare from a consumer’s perspective (Paxton Partners, Patient-Reported Outcome Measures: Literature scan, personal communication, 2018). Little is known about the best way to feedback PROs data effectively to healthcare providers in considering the performance of their health services compared with peer services. We sought to summarise the current evidence base and use this information to facilitate a process to determine the best methods for future implementation of PROs reporting. As part of planned future work associated with the AuSCR,13 66 we seek to test various formats based on our findings and extend the work conducted to date. AuSCR is one of the few national stroke clinical registries around the world to collect PROs.18 The outcome of this work will also inform the field and may be adopted by other CQRs.
Conclusion
While ‘best practice’ feedback methods and presentation formats of PROs data to healthcare professionals are emerging, there remains many unanswered questions. The basic guiding principles and recommendations presented in the body of the current review draw on the findings of the prevailing, consensus-based literature. Further research is required to determine what healthcare professionals perceive to be simple, easy-to-read and interpretable PROs reports for aggregated data. Healthcare professionals require support to interpret the data and should be part of the process of co-designing formats that will be the most meaningful to them. Our work here provides some guidance towards these efforts.
Acknowledgments
The authors thank Claire Weickhardt (CW) for her assistance with the screening of the literature.
References
Supplementary materials
Supplementary Data
This web only file has been produced by the BMJ Publishing Group from an electronic file supplied by the author(s) and has not been edited for content.
Footnotes
Contributors All authors were involved in the planning of the project. SLH, OFR and VM were involved in the search strategy, extraction and synthesis of data, and wrote the manuscript in consultation with SK, SB and DAC. All authors contributed to the final version of the manuscript.
Funding This work was funded by the Victorian Agency for Health Information as a consultancy.
Competing interests None declared.
Patient consent for publication Not required.
Provenance and peer review Not commissioned; externally peer reviewed.
Data availability statement All data relevant to the study are included in the article or uploaded as supplemental information. All data relevant to the study are included in the article or supplemental material.
Supplemental material This content has been supplied by the author(s). It has not been vetted by BMJ Publishing Group Limited (BMJ) and may not have been peer-reviewed. Any opinions or recommendations discussed are solely those of the author(s) and are not endorsed by BMJ. BMJ disclaims all liability and responsibility arising from any reliance placed on the content. Where the content includes any translated material, BMJ does not warrant the accuracy and reliability of the translations (including but not limited to local regulations, clinical guidelines, terminology, drug names and drug dosages), and is not responsible for any error and/or omissions arising from translation and adaptation or otherwise.