Article Text

Abstract
Objectives To report on the causes of blindness certifications in England and Wales in working age adults (16–64 years) in 2009–2010; and to compare these with figures from 1999 to 2000.
Design Analysis of the national database of blindness certificates of vision impairment (CVIs) received by the Certifications Office.
Setting and participants Working age (16–64 years) population of England and Wales.
Main outcome measures Number and cause of blindness certifications.
Results The Certifications Office received 1756 CVIs for blindness from persons aged between 16 and 64 inclusive between 1 April 2009 and 31 March 2010. The main causes of blindness certifications were hereditary retinal disorders (354 certifications comprising 20.2% of the total), diabetic retinopathy/maculopathy (253 persons, 14.4%) and optic atrophy (248 persons, 14.1%). Together, these three leading causes accounted for almost 50% of all blindness certifications. Between 1 April 1999 and 31 March 2000, the leading causes of blindness certification were diabetic retinopathy/maculopathy (17.7%), hereditary retinal disorders (15.8%) and optic atrophy (10.1%).
Conclusions For the first time in at least five decades, diabetic retinopathy/maculopathy is no longer the leading cause of certifiable blindness among working age adults in England and Wales, having been overtaken by inherited retinal disorders. This change may be related to factors including the introduction of nationwide diabetic retinopathy screening programmes in England and Wales and improved glycaemic control. Inherited retinal disease, now representing the commonest cause of certification in the working age population, has clinical and research implications, including with respect to the provision of care/resources in the NHS and the allocation of research funding.
- Public Health
This is an Open Access article distributed in accordance with the Creative Commons Attribution Non Commercial (CC BY-NC 3.0) license, which permits others to distribute, remix, adapt, build upon this work non-commercially, and license their derivative works on different terms, provided the original work is properly cited and the use is non-commercial. See: http://creativecommons.org/licenses/by-nc/3.0/
Statistics from Altmetric.com
Strengths and limitations of this study
-
Strengths of the data include nationwide coverage, collection of uniform data fields with prespecified tick boxes, and clear and consistent definitions of sight impairment.
-
Limitations include comparisons across two slightly different data collection forms.
Introduction
England and Wales have collected data on the number of blind people in the country since 1851.1 ,2 From 1930 until 2003, the causes of blindness have also been collected through use of a designated certificate, the BD8, which was completed by the examining ophthalmologist.2 The BD8 was replaced in England in September 2005 by the certificate of vision impairment (CVI), and in Wales in April 2007 by the equivalent form, the CVI-W. One copy each of the CVI and CVI-W is then sent to the Certifications Office, London for anonymised epidemiological analysis. The Certifications Office is currently funded by the Royal National Institute for the Blind (RNIB) and operates under the auspices of the Royal College of Ophthalmologists with CVI data under Crown copyright, meaning the copyright is owned by the British Government.
Although not compulsory, certification allows patients to be registered (ie, placed on an official local council register) as either severely sight impaired (blind) or sight impaired (partially sighted), which then permits access to certain state benefits and social service provisions. There is hence an incentive for patients to be certified and counted, providing an estimate, albeit imperfect,3 ,4 of the causes and burden of blindness in England and Wales. The importance of these data is highlighted by the fact that certification figures have recently been adopted in 2012 as an indicator for preventable sight loss and included in the Public Health Outcomes Framework.5 In this report, we present the findings from an analysis of working age blindness certifications from 2009 to 2010 and compare these with figures from 1999 to 2000.6 Major changes in leading causes of blindness certification in this age group have occurred over this period; subsequent publications will report on findings in persons of other age groups.
Methods
Details of data entry, collections and transmission have been reported previously.6–8 Between 1 April 2009 and 31 March 2010, data were obtained from CVI forms, whereas between 1 April 1999 and 31 March 2000, data were obtained from BD8 forms. With regard to CVI forms, data were transcribed from these paper-based forms into a database at the Certification Office. Part C of the CVI form collects information on the causes of visual loss and requires the completing ophthalmologist to select from a list of common diagnoses. More than one cause of visual loss can be selected in which case the main cause should be highlighted using either an asterisk or a circle. Guidelines are provided to assist with this process when the main cause is not evident. ‘Multiple’ causes are used where the ophthalmologist completing the form has not indicated a single main cause. Possible reasons for this selection include differing causes in the two eyes, or more than one cause within one eye, and the ophthalmologist is unable to determine which contributes the most to the visual loss. Causes for visual impairment were coded using the International Classification of Diseases (ICD)-9 codes and grouped into disease categories as in previous reports.6–8
For 1999–2000, data were extracted from paper-based BD8 forms in a similar fashion.6 Part 5 of the BD8 form has 16 fields for medical information including one for the main cause of visual loss and five for each eye for contributory causes. For records where the main cause was not filled, this field was imputed wherever possible using an algorithm published previously.8 In short, this algorithm brought forward as the main cause the contributing cause if any were so listed; if more than one contributory cause was listed, the patient was listed as having ‘multiple causes’. The main difference between data collected from the CVI and BD8 forms is the number of certifications with ‘multiple causes’ of visual impairment, which was higher in the CVI forms.7 We have previously minimised bias from this source by re-examining the certificates with ‘multiple causes’, extracting the contributory causes listed and tabulating them with the main causes.7 We follow the same procedure in this report.
Blindness was defined according to criteria previously described on the BD8 and CVI forms as either best corrected visual acuity in the better eye of either (1) worse than 3/60 or (2) worse than 6/60 with severely constricted visual fields or (3) better than 6/60 with severely constricted visual fields, particularly the inferior field.
Analyses
Data regarding the main cause of visual impairment were extracted from the forms and grouped into disease categories as previously described.6–8 For CVI data, those with ‘multiple causes’ or ‘no information on main cause’ of visual impairment had contributory causes extracted and listed, which were later combined with the main causes. Pie and bar charts were used to graphically illustrate the distribution of the main causes of visual impairment. Proportions of blindness registrations due to each cause are presented rather than adjusted incidence rates in order to indicate the relative contribution of each condition to the pool of vision impairment. Currently, almost every grant application for diabetic retinopathy projects starts with a statement that diabetic retinopathy is the most common cause of visual loss in the working age population—we present proportions of blindness registrations to determine if this statement remains valid. χ2 tests were performed to test differences in proportions.
Results
For the period 1 April 2009 to 31 March 2010, the Certifications Office received 1756 CVIs for blindness from persons aged between 16 and 64 inclusive. This compares with 1637 BD8 forms for blindness received between 1 April 1999 and 31 March 2000, details of which have been reported previously.8 Table 1 shows the number of persons certified blind for each of the disease categories. Hereditary retinal disorders, including Stargardt disease and retinitis pigmentosa, formed the largest category with 354 certifications comprising 20.2% of the total. Diabetic retinopathy/maculopathy was the second largest cause of certifiable blindness with 253 persons (14.4%), followed by optic atrophy with 248 persons (14.1%). Together, these three leading causes accounted for almost 50% of all blindness certifications in the working age group. Glaucoma was responsible for 104 (5.9%) blindness certifications, followed by congenital abnormalities of the eye, which included congenital cataracts and retinopathy of prematurity (89 certifications, 5.1%). Multiple pathologies were listed for 242 persons (13.8%) and no information on the main cause was listed for 42 persons (2.4%). When these categories were examined for contributory causes, the most common contributory causes recorded were glaucoma (60 persons), diabetic retinopathy/maculopathy (56 persons) and optic atrophy (46 persons). Combining the main and contributory causes resulted in small changes in the overall proportion of certifications due to specific causes, but did not change the relative rankings of the top six causes of blindness (table 1). ‘Other conditions’ comprised 150 certifications (8.5%), of which the most common were malignant neoplasms of the brain and nervous system (27 persons, 1.5%) and retinal detachments (24 persons, 1.4%). Figure 1 shows the distribution of the causes of blindness certifications graphically in a pie chart.
Numbers of working age adults (age 16–64) with severe sight impairment (blindness) in England and Wales: certifications 2009–2010
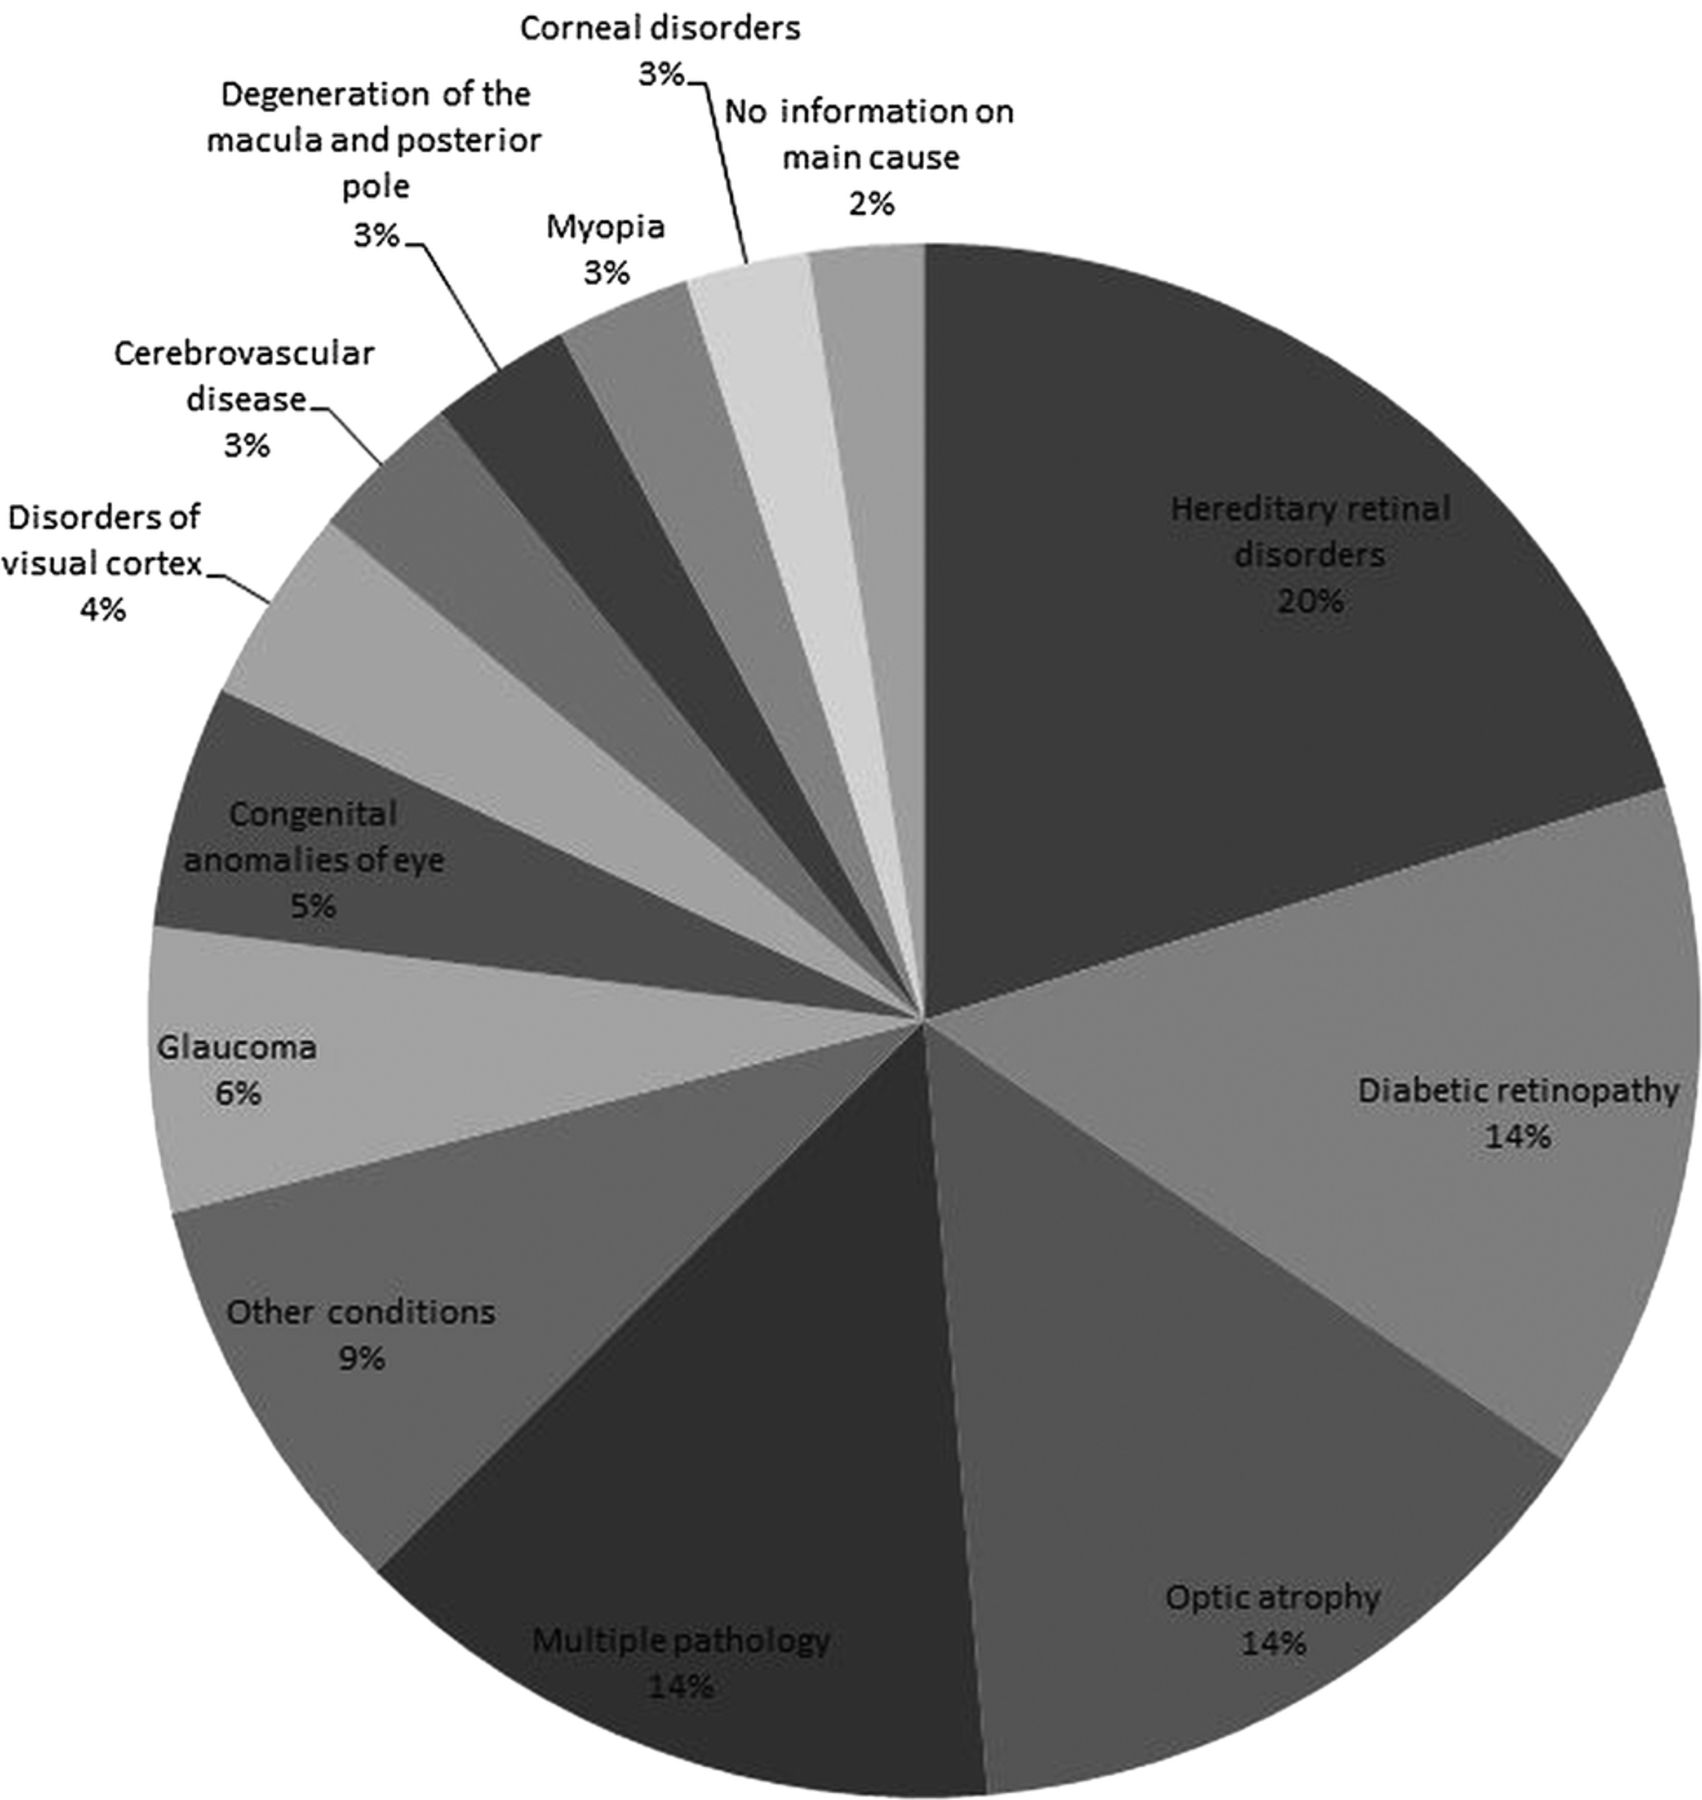
Main causes of severe sight impairment (blindness) in England and Wales in working age adults (age 16–64): certifications 2009–2010.
We next compared the main causes of blindness certifications from 1999 to 2000 (n=1637) with the figures above from 2009 to 2010 (n=1756). The results are shown graphically in figure 2. From 1999 to 2000, the leading cause of blindness certification was diabetic retinopathy/maculopathy, which accounted for 290 certifications (17.7%). By 2009–2010, this figure had decreased to 253 (14.4%), and diabetic retinopathy/maculopathy was now the second leading cause of blindness certification. This difference was statistically significant (p=0.009). In contrast, hereditary retinal disorders, which were the second leading cause of blindness certification in 1999–2000, accounting for 258 cases (15.8% of total), had increased to 354 cases (20.2%) by 2009–2010 and have now become the leading cause of certifiable blindness in the working age group in England and Wales. Optic atrophy remained the third leading cause in 1999–2000 and 2009–2010 with an increase from 165 cases (10.1%) to 248 cases (14.1%), respectively. A notable finding was that degeneration of the macula and posterior pole, which accounted for 7.7% of blindness registration in 1999–2000, had dropped in percentage terms and now accounted for only 3% by 2009–2010. Other causes of blindness registration remained roughly similar for the two time periods.

Ten-year change in causes of severe sight impairment (blindness) in England and Wales in working age adults (age 16–64): certifications 1999–2000 and 2009–2010.
Discussion
This report provides updated estimates on the causes of certifiable blindness in England and Wales in working age adults. Three main diseases were responsible for half of all certifications—hereditary retinal disorders (20.2%), diabetic retinopathy/maculopathy (14.4%) and optic atrophy (14.1%). A marked change has occurred in the relative importance of these main causes of blindness certifications since the last major analysis in 1999–2000,6 with diabetic retinopathy/maculopathy now no longer the leading cause of blindness in working age adults. Since at least 1963,9 diabetic retinopathy/maculopathy has been the leading cause of blindness among working age adults in England and Wales; a similar situation exists in other developed countries such as the USA.10 Over the past decade, the proportion of certifications for hereditary retinal disorders has risen slowly,8 while that for diabetic retinopathy/maculopathy has reduced, resulting in the two conditions swapping rankings.
This report is not designed to identify the reasons behind these changes or estimate the incidence of blindness from diabetes. The prevalence of diabetes in the UK is not known with certainty, with several limited general practice surveys suggesting a range of between 1% and 2% of the general population11–14; we are thus not able to estimate the incidence of blindness from diabetes. Nonetheless, available data suggest that the prevalence of diabetes in England and Wales has increased over the period in question,11 ,13 which would be expected to lead to increased rates of blindness if other factors remained constant. In this context, we speculate that several intervening public health developments may have contributed to the reduction in absolute and proportional rates of registrable blindness from diabetes among working age adults. Between 2003 and 2008, England and Wales introduced nationwide diabetic retinopathy screening services with the aim of reducing the incidence of blindness from diabetic eye disease. These are known as the National Health Service (NHS) Diabetic Eye Screening Program (England)15 and Diabetic Retinopathy Screening Service Wales (DRSSW),16 and these programmes annually screen almost 2 million and 150 000 patients with diabetes, respectively. Concurrent with these screening programmes, in 2004 the Quality and Outcomes Framework17 was introduced to incentivise general practitioners in the UK to improve primary care management of several conditions including diabetes. Several studies have documented an improvement in the quality of care for diabetes since this was introduced,18 ,19 and the effort may have contributed to the improvement in glycaemic control documented since the late 1990s.17 ,20 The decline in the absolute number and relative proportion of blindness certifications due to diabetic retinopathy/maculopathy among working age adults since the introduction of these public health measures may be an indicator of their effectiveness. Nonetheless, this remains speculative at present, and such explanations should be read with caution.
Whether increased numbers of certification for inherited eye diseases reflect improved certification of existing sight impairment or a true increase in incidence of these disorders is unclear. The progress made over the last decade in molecular genetics/diagnostics and the increasing avenues of research/clinical trials for inherited retinal disease with widespread media coverage may plausibly have resulted in higher community awareness and increased clinic visits and thereby registration,4 without a true increase in incidence rates. An observation in favour of this scenario is that the numbers of blindness certification for optic atrophy have also increased over the last decade, in tandem with those for inherited retinal disease, while those for other non-inherited conditions such as glaucoma have remained fairly constant. Hereditary retinal diseases occur more frequently in communities with a higher rate of consanguinity, and it is conceivable that increased rates of immigration from countries where consanguinity is more prevalent may have contributed to these findings, though at this stage this remains speculative. Another possibility is that diagnostic transfer or misclassification may have occurred, for example, where some cases of hereditary retinal disorders may have been mislabelled as ‘degeneration of macula and posterior pole’. In order to explain the increase in hereditary retinal disorders, this would have had to occur preferentially in 1999–2000 versus 2009–2010. However, misclassification of diabetic retinopathy/maculopathy as hereditary retinal disorders is unlikely to occur given how different the conditions are, and so would not explain the absolute reduction in the number of certifications for blindness due to diabetes.
These findings have implications for clinical care and research budget allocation. A prolonged focus on prevention and treatment of diabetic eye disease has most likely contributed to the decline in blindness certifications from this disorder among working age adults, and the rate is expected to decline further with the recent National Institute for Clinical Excellence (NICE) approval of ranibizumab for treatment of diabetic maculopathy. Now that hereditary retinal diseases comprise the leading cause of blindness certifications in working age adults, an increased focus on clinical management of these conditions (eg, with low vision aids and visual rehabilitation) and greater allocation of research funding to study these disorders may be appropriate. Funding bodies may need to reassess their funding priorities.
Strengths and limitations
Data from BD8 and CVI registrations represent some of the best available epidemiological data on sight impairment in England and Wales and are regarded as a major public health indicator.5 Strengths of the data include nationwide coverage, collection of uniform data fields with prespecified tick boxes, and clear and consistent definitions of sight impairment.
Limitations that should be highlighted include the fact that blindness certifications are not equivalent to blindness rates. This has been discussed previously,3 ,4 and it is estimated that up to 53% of eligible patients may not be registered blind despite consultation with an ophthalmologist.7 However, arguments have been advanced that in time, most patients eligible to be registered will in fact do so,7 and studies have shown a major increase in registration rates with increasing clinic visits.4
Another caveat to these results is that some patients who are certified blind may not always satisfy all of the official criteria, with one study suggesting an inappropriate blindness certification rate of 23%.3 Such inappropriate certifications may inflate the numbers somewhat, but it should be borne in mind that the aim of certification is not to identify persons meeting rigid clinical criteria but to identify and count those with significant visual impairment who may benefit from state assistance. Indeed, current guidelines for completion of CVI forms state that the criteria should be interpreted in the context of the patient's functional status rather than as strict cut-offs. Another precaution when interpreting these results is that the figures for the two time periods were collated from different forms. The differences in these forms are discussed elsewhere,7 and one of the main complications in comparing temporal trends is the increase in the number of forms where a main cause has not been identified. In the 1999–2000 dataset, which was derived from BD8, approximately 4% of forms had ‘multiple pathology’; in the 2009–2010 dataset derived from CVI, this had increased to 14%. This raised the possibility that diabetic retinopathy/maculopathy may have been under-reported for the 2009–2010 period. We attempted to address this by examining the contributory causes in those without a main cause recorded and using these in place of the missing main cause; this analysis resulted in only small changes to the percentage of blindness due to each cause and did not change the overall ranking of the top six causes. This suggests that the rate of under-reporting of main causes was similar for most categories and not responsible for the shift in the leading causes of blindness certifications.
In summary, this report found that three main causes were responsible for half of all blindness certifications among working age adults in England and Wales from 2009 to 2010—hereditary retinal disorders (20.2%), followed by diabetic retinopathy/maculopathy (14.4%) and optic atrophy (14.1%). This marks the first time in almost five decades that diabetic retinopathy/maculopathy is no longer the leading cause of blindness in working age adults, which may be related to the introduction of nationwide public health measures in England and Wales. The results have implications for resource allocations for clinical care delivery and research.
References
Footnotes
-
Contributors GL, MM and CB have contributed to (1) conception and design, acquisition of data, and analysis and interpretation of data; (2) drafting of the article and revising it critically for important intellectual content and (3) given final approval of the version to be published.
-
Funding This study was supported by grants from the RNIB and the National Institute for Health Research Biomedical Research Centre at Moorfields Eye Hospital NHS Foundation Trust and UCL Institute of Ophthalmology. The data captured by CVI are DH copyright and this work was made possible by collaboration with the Royal College of Ophthalmologists.
-
Competing interests MM is a recipient of a Foundation Fighting Blindness Career Development Award.
-
Provenance and peer review Not commissioned; externally peer reviewed.
-
Data sharing statement Technical appendix, statistical code and dataset available from the corresponding author or at the Dryad repository, which will provide a permanent, citable and open access home for the database.