
Abstract
The potential of construction of machine learning models was considered as applied to water level forecasting in mountain river reaches in Krasnodar Krai based on observation data on water levels at automated hydrological complexes of the Automated System of Flood Conditions Monitoring in Krasnodar Krai. The study objects were two mountain rivers in Krasnodar Krai―the Pshish and Mzymta. These rivers flow in different natural conditions and differ in their water regimes and the character of lateral inflow in the reaches under consideration. The study focused on three widely used machine learning architectures: regression model of decision trees M5P, gradient boosting of decision trees XGBoost, and artificial neural network based on multilayer perceptron. The forecast quality was evaluated for lead time from 1 to 20 h; variations for rivers with different water regimes and the potential of the examined models as applied to operational forecasting are discussed. The optimal lead time for the Pshish river was found to be 15–18 h (with S/σΔ varying within 0.38–0.39 for XGBoost model); the simulation quality for the Mzymta river is evaluated as good; however, the necessary forecast efficiency is not attained (at the lead time of 5 h, we have S/σΔ = 0.87 for MLP model). The obtained results allow the machine learning models to be regarded as acceptable for short-term hydrological forecasting based on high-frequency water level observation data.
INTRODUCTION
Floods are among the most destructive natural disasters both in Russia and in the World, and their forecasting is a key factor in the protection of the population and economy from floods. In Russia, flood casualties occur every year, and since the early 2000s, more than 80% of people were killed by floods of rain origin and more than 50%, by flash floods [2]. To ensure the forecast advance time required for emergency services to respond and to alert the population in the case of flood hazard, the system of hydrological forecast is to be developed basing on monitoring data, up-to-date forecast methods, and skilled staff [6, 29].
Under current climate changes, the frequency and the scale of hazardous meteorological phenomena, including extreme storm rainfalls, are expected to increase in many regions of the world, thus making the problem of flood forecasting extremely hard at any time scale [22, 25, 27]. In Russia, the contribution of heavy showers to the total precipitation has been also increasing in the recent years [21].
The progress in forecasting flash floods can be engaged through increasing the availability of data (from gaging stations, the population, and remote sensing) and methods of their effective use, with the aim to improve the understanding of hydrometeorological phenomena and their socioeconomic effects [38]. In the Krasnodar Krai, a unique for Russia regional automated monitoring system for flood situation (AMSFS KK) has been operating since 2013, including more than 250 automated hydrological complexes (AHC) and more than 90 automated meteorological stations (AMS). Automated gages measure water level in rivers with a frequency of once in 10 min, along with some other weather characteristics, and transmit the data on a real-time basis to the information server of the system through cellular communication channels based on technologies of Emercit company [12]. Advantages of the system are the high density of the monitoring network (<170 km2 per 1 AHC in the mountain part of the territory), the high frequency of data transmission, and their open-access in the Internet, emphasizing its significance in ensuring online monitoring of floods and alerting the population about floods. AMSFS KK fits well into the international practice of developing local hydrometeorological systems for solving monitoring problems and flash floods forecasting [46]. At the same time, the array of high-frequency data acquired by the regional monitoring system can be used to develop methods for simulating and forecasting flash floods. Notwithstanding the relatively short operation period of the Emercit system, measurement results are being actively used by researchers to study hydrological and geomorphological phenomena [5, 13, 14].
The achievements in the field of artificial intelligence (AI) and machine learning (ML) [23, 31, 32, 40] provide promising methods for incorporating the full potential of large datasets for the analysis and forecasts with the aim to provide accurate and timely data to stakeholders, the population, and the authorities.
The problems of short-term hydrological forecasting often require not detailed description of the processes of runoff formation but an accurate description of the response of the river system to meteorological forcing data [17]. This is done with the use of simplified models relating previously observed weather and river flow with the future river flow by effectively incorporating the (auto)correlation of time series [4].
The problem of forecasting water levels in the mountain rivers in Krasnodar Krai is of great importance because of the frequent floods. Water levels are characteristics that can be measured more accurately and easily than water discharges, especially in mountain rivers, and forecasting water levels at a downstream gage of a river reach, considering the observations at the upstream gage is a common hydrological task. The objective of this study is to construct machine learning models for forecasting water levels in the rivers of Pshish (at Guriiskaya Vil.) and Mzymta (at Kazachii Brod Vil.) in Krasnodar Krai, using data on water levels at upstream gages. For the first time we use initial dataset containing high frequency water level observation data on the AMSFS KK network. We employ the three widely used ML model architectures for model construction, i.e., decision tree regression model M5P [37], gradient boosting of decision trees XGBoost [20], and an artificial neural network based on multilayer perceptron (hereafter, MLP [24]). The forecasting effectiveness is tested for the forecast lead time from 1 to 20 h.
STUDY OBJECT
The catchments of the Pshish and Mzymta rivers (Fig. 1) lie on different macroslopes of the Western Caucasus. These rivers were chosen because of their similar catchment sizes (Table 1) and contrast natural conditions in their catchments. The Pshish River is a tributary of the Kuban in its middle reaches; it contributes to the Krasnodar Reservoir. The Mzymta basin lies in the southern Russian part of the Black Sea coast at the Caucasus. This river flows into the Black Sea. The upper reaches of the Mzymta lie further westward in a higher part of the Greater Caucasus; the maximum elevation in the basin is >3250 m, while that on the ridges of the Pshish River catchment is as little as 1800 m. The relief and elevation of the catchments determine their climate features, snow accumulation regime, and the water regime of rivers.
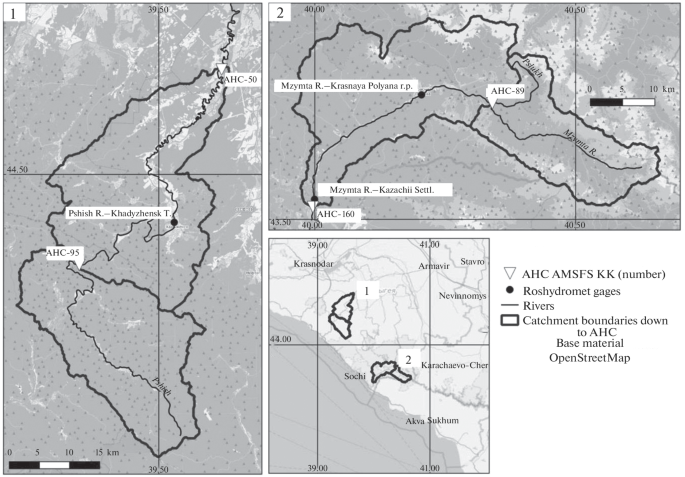
Schematic map of the catchments of (1) the Pshish and (2) Mzymta rivers and the layout of the chosen AHCs.
The Pshish River catchment lies in the zone of temperate climate with annual precipitation >900 mm (with 950 mm in Khadyzhensk T., and 1660 mm in Gornyi Vil.), the snow cover is intermittent. The Mzymta R. basin lies in the zone of humid subtropical climate with an annual rainfall of >1300 mm (1377 mm in Adler City, 1795 mm in Krasnaya Polyana Town) [10]. Part of the catchment above 600–1300 m belongs to the zone of seasonal snow cover, where snow falls every year and lies during >120 days, thus enabling the operation of ski resorts on the slopes of the Mzymta valley.
According to P.S. Kuzin’s classification [7], the Pshish is a river with rain floods occurring all year round, though more frequent in the cold season, while the Mzymta is a river with spring–summer freshets and rain floods in all other seasons. The mean maximal level increase in the Pshish R. is 2.9 m at AGK-95 and 6.1 m at AGK-50. The mean rate of level rise during freshets is 0.1–0.6, and maximum of 1.1 m/h. The concentration time between the peaks of high floods in the Pshish River varies from 18 to 28 h, which corresponds to the flood wave propagation velocity of 3−4 m/s in this river reach.
The range of level variations in the Mzymta R. during flood events is 2–3 m. The rate of level rise is commonly relatively low in the upper reaches (0.05–0.24 m/h), while that in the lower reaches is higher―up to 0.5 m/h. In the lower reaches, flood formation often begins earlier because of damp air moving from the sea [1]. Peak levels can also occur earlier in the lower gage. A definitive case is the flood of June 25, 2015, when showers caused floods on rivers in the coastal zone and in low mountains; at Kazachii Brod, the flood peak passed at 1 p.m., and air masses rose into the mountain part a day later and formed a flood peak at the confluence of the Mzymta and Pslukh rivers at 10 a.m. on June 26.
Notwithstanding the relatively short operation period of AMSFS KK, its sensors have already recorded extreme water level rises, during the flood on October 24–25, 2018, the level rise in the Pshish R. was >6.2 m near Navaginskoe Vil. and 9.3 m at Guriiskaya Vil. According to data of Roshydromet gages for Khadyzhensk T. and Bzhedukhovskaya Vil., this was the highest flood over the observation period since 1936. On the same dates of October 24–25, 2018, a high flood was developing in the Mzymta R. with level rises by 2.0–3.1 m upstream of the confluence with the Pslukh R. and at Kazachii Brod Vil. In the area near Kazachii Brod, this flood ranked second in magnitude after that of October 25, 2003 (or third, taking into account the highest flood recorded on the gage at Kepsha Station on June 26, 1956) during the period of instrumental observations.
Available Hydrometeorological Data
In the chosen rivers, observations on AMSFS KK network are carried out in parallel to observations at Roshydromet gages, thus enabling mutual quality control of the obtained data. The regional AMSFS KKnetwork includes 3 AHCs on the Mzymta R. and 3 AHCs on its tributaries. On the Pshish River and its tributaries, 6 and 2 AHCs are now in operation, respectively. In this study, two pairs of AHC AMSFS KK were chosen at each river with the most complete observation series (with few gaps and outliers) observation series (Table 1). The distance between those gages is 86.5 km along the Pshish R. and 40 km along the Mzymta R.
Processing Data of Water Level Measurements, Removal of Spikes, and Filter Tuning to Reduce Noise in the Series
The study uses the archive dataset of 10-min water level measurements at AHC-95, AHC-50, AHC-89, and AHC- 160 from April 2014 to January 2021.
Due to the design features of the measuring radar sensor and high measurement frequency the time-series are noisy and contain numerous outliers. The majority of the existing procedures used to analyze time series for outliers, spikes, or anomalies are unsuitable for the analysis of water level variations in small mountain rivers because of the specifics of their hydrological regime. The abrupt and fast water level rises, typical for West Caucasian rivers, analyzed with the use of statistical tests known to the authors (Chauvenet’s statistical criterion, Grubbs’s test, Pearse’s test, Dixon’s Q-test) rejected the null hypothesis assuming that the values considered are not outliers. Therefore, the following algorithm has been developed to remove such values caused by measurement errors. First, the regular measurement interval of 10 min was introduced. Next the series was analyzed to identify outliers through revealing events in which water level rose by >1.5 m within 10 min and next dropped by >40 cm. The proportion of outliers at selected AHC varied from 0.05 (18–25 values, associated with sensor calibrations, according to data of JSC Emersit) to 0.24%. Within the 7 years of sensor operation, the proportion of gaps varied from 2.29 to 7.77% of series length. The identified erroneous data were removed, and the gaps were filled by linear interpolation.
After the determination of outliers and the restoration of a regular measurement step, the data were filtered to remove high-frequency noise, typical for this kind of data. The methods of linear and nonlinear filtration [39] are not suitable for this problem, because they largely reduce the actual range of level variations during floods. Therefore, this was made by Savitzky–Golay smoothing method [42], which is widely used to process high-frequency observation data in various fields [28, 45]. A distinctive feature of this filter is the ability to smooth noises and to preserve the actual variation amplitude [36]. The smoothing is carried out using 41 samples wide rolling window with 8th degree polynomial. It is followed by linear interpolation aimed to fill in the small gaps <8 h that form due to the removal of outliers and faulty measurements. This is necessary to obtain the most complete series for further modeling.
Preparation of Dataset for Experiments
Matrices of data from 2014 to 2020 were prepared for computation experiments. The calculations were made for a step of 1 h; therefore, before their use, the data were converted to a one-hour step. For each hour, water level was forecasted with some lead time based on the data available at the moment of forecast. The datasets included a set of 54 predictors, i.e., water level series obtained by processing the initial AMSFS KK data. The same dataset contained 8 predicates―series of the forecasted characteristic (water level) with a lead time from 1 to 20 h (the future water levels Lt+1, Lt+2, Lt+3, Lt+5, Lt+10, Lt+15, Lt+18, Lt+20).
The predictors included:
water levels at the upstream gage Ht-τ (m) at the moment of forecasting and for the previous period τ = 1…48 h;
water levels at the downstream gage Lt-τ (m) at the moment of forecasting and for the previous period τ = 1…24 h.
The construction of this dataset allows to account for flood wave routing time along the river channel. The initial datasets are arranged by rows. The data in the first position of each row are the date and the hour t for which the experimental forecast is made.
Next the series of water levels were divided into the training and testing samples according to the recommendations [18] with a sufficient length and similar statistical characteristics. The training period for the Pshish River was chosen from March 3, 2015, to August 31, 2018 (70% of the data), and the testing period was from September 1, 2018, to January 5, 2020 (30%). The respective periods for the Mzymta were from January 1, 2014, to August 31, 2018 (teaching, 80%) and from September 1, 2018, to January 5, 2020 (check, 20% because of gaps).
THE MODELS AND THE METHODS OF THEIR CONSTRUCTION
Description of M5R Model
The algorithm M5R is based on the algorithm of construction of regression model trees M5 [37]. This algorithm includes three stages. At the first stage a decision tree is constructed, where the splitting criterion minimizes the variations of predicate values in each branch. At the second stage, truncation is made at each leaf. At the truncation, the inner nodes of the tree form a regression plane. At the third stage, to prevent the formation of breaks, a smoothing procedure is applied. It combines the forecasts of the model in a leaf with the values for each leaf toward the root of the decision tree. An advantage of the algorithm is its compactness and the relatively simple interpretation of the obtained models. The algorithm uses unscaled initial data.
Description of XGBoost Model
XGBoost is gradient boosting of decision trees. Boosting is a technique that helps successively constructing the composition of algorithms; in this case, each new algorithm is constructed in order to minimize the errors of the previous one. The base algorithms of the composition are shallow decision trees.
Suppose we have a composition of N – 1 decision trees:
At the next step, we have to add an algorithm \({{b}_{N}}(x)\) that will decrease the composition error on the learning sample. In other words, we have to determine which values \({{s}_{1}}, \ldots .,{{s}_{t}}\) are to be taken by algorithm \({{b}_{N}}({{x}_{i}}) = {{s}_{i}}\) on the objects of the learning sample for the error of the entire composition to be minimal:
Now, the vector s can be sought for as the antigradient of the error function:
Therefore, training the algorithm \({{b}_{N}}(x)\) is the minimization of the quadratic error function of algorithm responses and elements of vector s.
The model is written in Python language. Library xgboost, version 0.90, was used for the construction. Library sklearn was used to validate the model. The input data for the model were standardized variables within the range [–1; 1].
Description of MLP Model
The neural network model commonly used for hydrological problems [16, 33, 43] is multilayer perceptron MLP [24]. This is a computation network consisting of artificial neurons, simulating brain neurons. A mathematical model of neuron was first proposed in [30], however, it started rapidly developing only after the introduction of backpropagation algorithm [41] for evaluating model parameters (the weights of the input variables). Multilayer perceptron model is based on the use of a single or several layers of artificial neurons, which receive many observation data series on their inputs (for example, water levels with different time shifts) and transform them into an output signal (for example, water levels with a specified lead time) through nonlinear transformations and combinations of input signals with various weights. Mathematically, the artificial neuron can be represented by the dependence
relating the output signal y with a vector of input data \({{x}_{i}}\) (i = 1, 2, …n), which enter the model with different weights \({{w}_{i}}\), and neuron activation threshold b via activation function \({{\varphi }}\). The activation function is commonly represented by a nonlinear sigmoid function of the form:
The weights with which the vectors of source data enter the artificial neural network were determined based on the comparison of the output signal with the learning vector (observation data) and back propagation, which leads to repeated weighing. This process is referred to as learning a neural network. The learning process is to minimize the chosen error function, which is commonly the root-mean-square deviation (though any other function can be chosen).
The nonlinear relationships established between ANN input and output, as well as the use of any other input data for automated search for model structure allows ANN to be used in various problems, not limited to hydrology. In terms of the structure of hydrological models, ANN is a classical black box model [19]. Such model does not require a detailed description of the system to be simulated (in our case, the processes of runoff formation in a river basin) for identifying relationships between its inputs and outputs. An advantage of ANN, as applied to complex nonlinear systems, over models with distributed parameters is their less strict requirements to input data. The initial data for the model are standardized characteristics varying within the range [–1; 1].
The process of ANN model development consists of the following. The measurement data used to develop the model are divided into two groups: training and testing. First, the ANN model is trained on the first set of data, and the simulation result is compared with observation data to evaluate simulation quality. Next, the model is tested on an independent dataset under a specified condition regarding the admissible decrease in model quality. The model thus developed and trained can yield an output signal whatever the amount of input data.
The model for forecasting water level variations based on measurement data from AHC AMSFS KK was developed with the use of software components of scikit-learn library of Python language [35]; the regression problems with training were solved with the use of MLPRegressor software. The main parameters of the model are the number of its hidden layers, the number of neurons in them, the form of the activation function, the algorithm used to search for the global minimum of the optimization function, and the maximal number of iterations. The models’ hyperparameters were optimized by grid search algorithm with ten-fold cross-validation (the training data set is randomly divided into 10 parts, of which 9 are used for parameter tuning and 1 is used for testing; next the dataset is divided in another way; this test is repeated 10 times). These procedures are also implemented as functions of scikit-learn library.
The Methods Used to Evaluate Model Quality
We used the following metrics to evaluate the models’ performance. The root-mean-square error of the simulated values from the observed was calculated using the formula
here \(H_{i}^{{{\text{sim}}}}\) is the simulated water level, m; \(H_{i}^{{{\text{obs}}}}\) is the observed water level; N is the length of the series.
The Nash–Sutcliffe model efficiency coefficient NSE [34]:
The Nash–Sutcliffe coefficient NSE vary within the range \(\left( { - \infty ;1} \right]\), at NSE > 0.75, the simulation quality is excellent, at 0.36 < NSE < 0.75, it is satisfactory; and at NSE < 0.36, unsatisfactory.
The quality of the tendency forecast of the models was evaluated by the characteristic S/σΔ [4, 9], where σΔ is the deviation of the inertial forecast for each lead time:
The values of S/σΔ vary within the range \(\left[ {0; + \infty } \right)\), with the values of 0–0.5 implying excellent; 0.5–0.7, good; 0.7–0.8, satisfactory; and >1, unsatisfactory quality of the forecast procedure.
It is worth mentioning that the metrics given above are commonly used to evaluate the quality of simulation and forecasting water discharges; however, they can be used for water levels as well.
RESULTS
In the machine learning models that incorporate linear regression, in our case, M5P and XGBoost, the degree of association of predictors and the predicate often determines the quality of modeling and can be evaluated beforehand through (auto)correlation analysis of variables. For the chosen pairs of AHC in the examined rivers, we estimated the correlation between water levels at a downstream AHC with different lead times and the levels at an upstream AHC with different time shift. In the case of the Pshish River, the correlation between the downstream AHC-95 and the upstream AHC-50 was highest―up to 0.93―at the lead time of 15–20 h (Fig. 2a). Similarly, the travel time, determined by the time of passage of appropriate high flood peaks in this reach, as mentioned above, is ~18 h. The autocorrelation at AHC-95 at an lead time up to 8 h, never falls below 0.95 and that at an lead time up to 13 h, below 0.90 (Fig. 2b). In the case of the Mzymta, because of the considerable changes in the drainage area between AHCs and a large lateral inflow, the correlation between the levels at the downstream AHC-160 and the upstream AHC-89 is not high (Fig. 2c): it is not greater than 0.74 for the lead time of 1 h and starts decreasing after 5 h. At active snow melting in the Mzymta R. catchment, the travel time of the wave of the daily level variation in the reach under consideration is 2–3.5 h. Conversely, the autocorrelation between the hourly levels of AHC-160 is relatively high: it is 0.97 below 1 h and 0.90 below 17 h (Fig. 2d). The obtained estimates correspond to the travel time between AHCs.
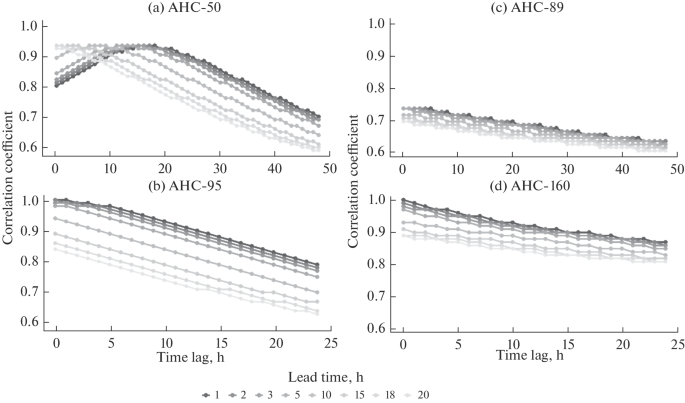
Corellogram of water levels in (a, b) the Pshish and (c, d) Mzymta rivers between the upstream and downstream gages and (b, d) autocorellogram at the downstream gage.
Grid search in the models’ hyperparameter space with ten-fold cross-validation on the training sample was used to determine optimal parameters and structures of the models and to evaluate modeling quality criteria with lead times of 1, 2, 3, 5, 10, 15, 18, and 20 h (Table 2). The structure of the classification tree for model M5R became more complex with an increase in the lead time, though the interpretation of the chosen model configuration is available for any lead time in the form of a problem-solving graph (as, for example, in Fig. 3 for the lead time of 1 h). In the process of XGBoost model tuning, possible combinations of parameters were tested: the number of trees \( \in \)[100,300,500,800], the maximal depth of trees \(~ \in \) [3, 5, 8]. The best results were obtained with a model with 1000 trees with depth ≤5. In MLP model for the lead time of 5 h, a structure with one layer containing 10 neurons was used, while at another lead time, the structure is more complex―two or three layers each containing 10 neurons.
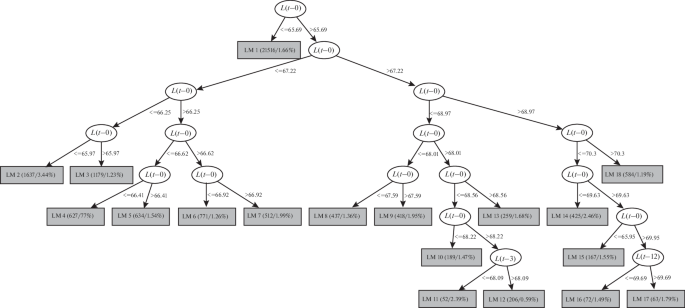
Decision tree of M5P model for water level forecast in the Pshish river at Guriiskaya Vil. at lead time of 1 h.
For the Pshish River, the best result in terms of NSE values was obtained for all models on the training and test samples with the lead times of 1–5 h. In the case of lead times less than 5 h, the root-mean-square error of simulation S ≤ 0.2 m. In the test period, the error S increases faster than in the calibration period and amounts to 0.25–0.41 m. As the lead time increases, the quality estimates in the form of NSE criterion steadily decrease, though remaining greater than 0.8, which corresponds to an excellent result of simulation. Tests based on independent data show that the best estimates were given by models M5P and XGBoost, in the latter case, with the lead time ≥10 h.
Estimates of the prognostic properties of simulation results by the S/σΔ criterion show that the best forecast can be obtained at the lead times of 15 and 18 h, which is close to the travel time in the reach between the chosen gages AGK-95 and AGK-50 in the Pshish river and which is in agreement with the results of correlation analysis.
Simulation of individual flood events in the Pshish river was analyzed. Below, we discuss the simulation of the highest (historical) flood of October 24–26, 2018, with examples of lead time of 5 and 15 h (Fig. 4).
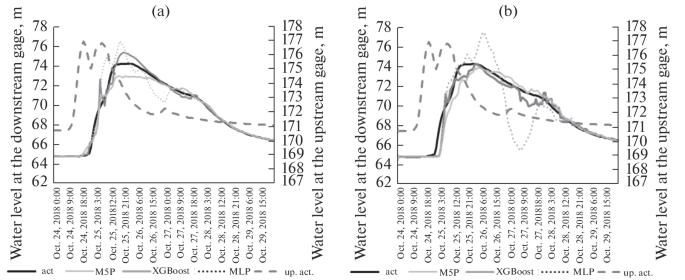
Actual and simulated plots of water level variations at the passage of flood of October 25–26, 2018, in the Pshish river. The lead time is 5 h in the left part and 15 h in the right part.
For the lead time of 5 and 15 h in the case of the flood of October 25, 2018, MLP model appreciably overestimates the maximal level―by 2.3–3.2 m, respectively. MLP model predicts earlier rise of the level to the marks of an adverse event (AE) (71.802 m) and a hazardous event (HE) (72.802 m) 5 h earlier than their actual time at the lead time of 5 and 4 h earlier than that at the lead time of 15 h. At the flood decay, MLP model demonstrates an abrupt drop in the level, which may be due to the interpretation by the model of a two-peak flood at the upper gage AHC-95, the levels of which are components of predictors for level forecasts at the lower gage AHC-50.
Some perturbation at the flood rise can be seen in the results of M5P model; however, this perturbation decays quickly. At the lead time of 5 h, M5P model overestimates peak floods by 1.1 m; at an lead time of 15 h, the model predicts level reaching AE mark 2 h earlier, but the forecasted time of HE mark is later and the level is 1.0–1.3 m lower than the observed values.
The results of simulation of the same flood by XGBoost model are less convincing, because the model predicts later times of AE and HE marks and underestimates the water levels by 1.0–1.7 m. In that case, at the lead time of 5 h, XGBoost model always underestimates peak water levels, and at the lead time of 15 h, its behavior is similar to that of M5P model, and its forecast of the time of HE level is 4 h later. Thus, the actual lead time in the forecast of HE mark time is 19 and 12–11 h by the models MLP and M5P, respectively.
Overall, the best results of simulation for the historical flood of October 24–25, 2018, on the Pshish river are obtained by two models: M5P and MLP. It is also worth mentioning that XGBoost shows smoother flood rises and falls, unlike MLP with its more abrupt response to changes in predictors. Models M5P and MLP at the forecast can overestimate the values of flood levels in the domain of the values not observed before. Notwithstanding the poorer result of MLP model, estimates NSE and S/σΔ show good prognostic qualities of the model in the case of an outstanding flood.
Similar tests of the models were made for the Mzymta river. The obtained results are given in Table 3. Note that the efficiency of the models estimated by NSE, decays with each step at the lead time from 0.98 to 0.6 much faster than it does in the case of the Pshish river. This is due to the much shorter travel time between the upstream AHC-89 and downstream AHC-160, which is <4 h. In addition, at high floods, the peak forms earlier at the downstream gage because of the direction of motion of air masses from the coast toward mountains and the successive inclusion of parts of the catchment in the runoff formation and transformation processes, which reduces the role of levels at the upstream gage as predictors. The root-mean-square errors of simulation vary from 0.02 to 0.40 m over the training period and from 0.03 to 0.19 m over the test period.
All three models show an appreciable decrease in NSE efficiency over the test period, though most stable results in this case were obtained with the use of multilayer perceptron. The considerable decrease of the efficiency M5P and XGBoost models over the verification period can be attributed to overfitting.
In the case of the Mzymta river, the prognostic efficiency by criterion S/σΔ is not met. Better simulation results were obtained for the lead times of 3 and 5 h. This demonstrates the need to incorporate additional hydrometeorological predictors for the development of more efficient prognostic procedures and for increasing the lead time. Similarly, the simulation of individual flood events was analyzed for the Mzymta river. The highest flood of October 25–26, 2018, included in the test period, is described by all models with underestimation of maximal water levels and a time lag relative to the observed values (Fig. 5).
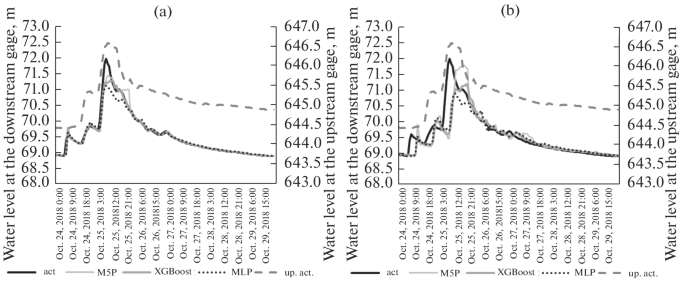
Actual and simulated plots of water level variations at the passage of flood of October 25, 2018, in the Mzymta river. The lead time is 1 h in the left part and 5 h in the right part.
DISCUSSION
The quality of water level simulations over the chosen period for the Pshish river is higher than that for the reach of the Mzymta river. The observed differences between simulation quality in the reaches of the Pshish and Mzymta can be attributed to differences between the natural conditions in their catchments. The area of the lateral part of the catchment is larger than that of the catchments for upstream gages (by factors of 1.3 and 1.9, respectively); however, the inflow has no considerable effect on the propagation of the flood wave in the Pshish river alone. The lateral catchment in the Pshish river reach from Navaginskoe Vil. to Guriiskaya st. has fairly smooth slope with elevations ≤700 m, and the processes in it appear to be synchronous with those in the upper catchment, where the runoff of high floods is mainly formed due to high rainfall. Downstream of Khadyzhensk town, additional inflow can be very low because of the small rainfall-runoff ratio in the lowland part of the catchment, and the character of the Pshish river becomes transit [8]. The large travel time in this reach is due to the small channel slope (with a drop from 180 to 80 m abs.).
Within the boundaries of the higher catchment of the Mzymta R., the processes of runoff formation and flood wave transformation in the examined reach are more complicated because of altitudinal zonation (which affect the proportions between the snowmelt and rain runoff) and a system of differently directed ridges, which affect moist air masses’ movement. The catchment of the Mzymta from its confluence with the Pslukh river to Kazachii Brod includes middle-mountain Krasnopolyanskaya depression (with elevations of 500–2000 m) and a low-mountain zone of the so-called pre-ascent of air masses (up to ~1000 m), open toward the Black Sea coast [10]. Here, the lateral inflow is a powerful factor that affects the variations of water level and hampers the development of level regime models taking into account only the upper gages (ANS-89) located in the upper reaches of the river. In addition, dredging and bank protection operations are carried out in the river channel even after the Winter Olympic Games 2014; these operations can have an effect on the level regime near the upstream gage. In the area near the downstream gage at Kazachii Brod, the level regime in some periods (e.g., October 17–28, 2019) shows the effects of releases from the Krasnopolyanskaya HPP with a range of variations up to 25 cm. The small travel time in this reach is due, in particular, to the large channel slope (with a drop from 650 to 70 m abs. in a reach half as long as that in the Pshish river).
In the Pshish river case study, which shows considerable correlation between water levels at the upper and lower AHC, the best results were obtained using decision trees boosting model, i.e., in essence, an ensemble of linear models, which most effectively utilizes the correlation within the sample. The complex nonlinear MLP model showed the worst results among the three models at each lead time, clearly, because of overfitting. However, its results can have a high prognostic potential for high floods, as it has been shown in the case of an extreme flood in October 2018. The effectiveness of the forecast is highest at the lead time of 15 and 18 h. Therefore, the results of simulation for the Pshish river, which simulate the patterns of flood wave transformation in a river reach, complement the results obtained by the method of corresponding levels (water discharges) for a larger river in the region, i.e., the Kuban [15], though with a one-hour instead of one-day step and with the use of state of the art technologies.
In the Mzymta river case study the relationship between the predictor and predictant is significantly weaker because of the substantial and asynchronous lateral inflow (Fig. 2). The nonlinear model MLP was found to be best among the three models, which can be an indirect indication to its ability to detect additional relationships within the sample. And, although the simulation quality with an lead time up to 5 h is evaluated by NSE criterion as excellent, the stricter criterion of forecast efficiency S/σΔ does not consider the results as satisfactory. Details of behavior of this criterion with an increase in lead time are discussed in [11]. More effective forecast models for water levels and/or discharges in the Mzymta river can be developed with the incorporation of additional data on the behavior of tributaries and meteorological data.
CONCLUSIONS
The study showed that machine learning methods applied to simulate water levels can give reliable forecasts. For the lower reaches of the Pshish river, the optimal lead time is 15–18 h. In the case of the Mzymta river at Kazachii Brod, with data on water levels at the upper gage at the confluence with the Pslukh river taken into account, the quality of simulation is estimated as good, though the required forecast efficiency has not been achieved. This is the effect of the considerable lateral inflow in the middle and lower reaches of the river and the asynchronous runoff formation in different parts of the catchment.
For the reach of the Pshish river, the best results of water level simulation were obtained with the use of the model of decision tree boosting (XGBoost), e.g., an ensemble of linear models, which most effectively use the correlation within the sample. Models M5P and MLP can successfully supplement and improve the forecasts in the case of high floods.
In the case of the Mzymta river, on the contrary, the best among the three models was the nonlinear MLP model, a fact, which may imply its ability to identify nonlinear relations within the dataset. Further studies will be focused on the search for interpretable neuron networks. This is currently a compelling research topic [26, 44]. To improve the simulation quality of water level in the Mzymta River, it is reasonable to incorporate additional source data on water levels in tributaries and meteorological data.
Overall, the use of machine learning methods to construct procedures for forecasting floods in Krasnodar Krai rivers based on data of AMSFS KK network looks promising. The accumulation of long enough sets of precipitation data with an hourly step will enable studying the potential of artificial intelligence models in problems of rainfall-runoff forecasting and nowcasting.
REFERENCES
Alekseevskii, N.I., Magritskii, D.V., Koltermann, P.K., Toropov, P.A., Shkol’nyi, D.I., and Belyakova, P.A., Inundations on the Black Sea Coast of Krasnodar Krai, Water Resour., 2016, vol. 43, no. 1, pp. 1–14.
Belyakova, P.A., Moreido, V.M., and P’yankova, A.I., Flood fatalities age and gender structure analysis in Russia in 2000−2014, Tret’i Vinogradovskie chteniya. Grani gidrologii (Third Vinogradov Conference. Facets of Hydrology), 2018, pp. 849–853.
Borsch, S.V., Simonov, Yu.A., and Khristoforov, A.V., Flood forecasting and early warning system for rivers of the Black Sea shore of Caucasian region and the Kuban river basin, Tr. Gidromettsentra RF, 2015, Special Issue 356.
Borsch, S.V. and Khristoforov, A.V., Hydrologic flow forecast verification, Tr. Gidromettsentra Rossii, 2015, Spec. Iss. 355.
Vasil’eva, E.S., Belyakova, P.A., Aleksyuk, A.I., Selezneva, N.V., and Belikov, V.V., Simulating flash floods in small rivers of the Northern Caucasus with the use of data of automated hydrometeorological network, Water Resour., 2021, vol. 48, no. 2, pp. 182–193.
Integrirovannoe upravlenie pavodkami. Kontseptual’nyi dokument VMO no. 1047 (Integrated Flood Management. Concept Paper. WMO-no.1047), Geneva, 2009.
Kuzin, P.S., Klassifikatsiya rek i gidrologicheskoe raionirovanie SSSR (Classification of Rivers and Hydrological Zoning of the USSR), Leningrad: Gidrometeoizdat, 1960.
Lur’e, P.M., Panov, V.D., and Tkachenko, Yu.Yu., Reka Kuban’. Gidrografiya i rezhim stoka (The Kuban River: Hydrography and Flow Regime), St. Petersburg: Gidrometeoizdat, 2005.
Nastavlenie po sluzhbe prognozov (Instruction on Forecast Service), Section 3, Pt. 1, Prognozy rezhima vod sushi (Forecasts of Continental Water Regime), Leningrad: Gidrometeoizdat, 1962.
Panov, V.D., Bazelyuk, A.A., and Lur’e, P.M., Reki Chernomorskogo Poberezh’ya Kavkaza: gidrografiya i rezhim stoka (Rivers of the Caucasian Black Sea Coast: Hydrography and Flow Regime), Rostov-on-Don.: Donskoi izd. dom, 2012.
Sokolov, A.A. and Bugaets, A.N., To the problem of verification of methods for short-range forecasting of hydrological parameters, Russ. Meteorol. Hydrol., 2018, no. 8, pp. 539–543.
Tkachenko, Yu.Yu. and Sherzhukov, E.L., Experience in developing systems of short-term forecast of hydrological type of hazards, Vod. Khoz. Rossii: Probl., Tekhnol., Upravl., 2014, no. 3, pp. 75–82.
Sheverdyaev, I.V., Kleshchenkov, A.V., and Misirov, S.A., Flood hazard factors in rivers of the Northwestern Caucasus, Nauka Yuga Ross., 2021, vol. 17, no. 1, pp. 37–51.
Tsyplenkov, A.S., Ivanova, N.N., Botavin, D.V., Kuznetsova, Yu.S., and Golosov, V.N., Hydro-meteorological preconditions and geomorphological consequences of extreme flood in the small river basin in the wet subtropical zone (the Tsanyk River case study, Sochi region), Vestn. S.-Peterb. Univ., Nauki Zemle, 2021, vol. 66, no. 1, pp. 144–166.
Yumina, N.M. and Kuksina, L.V., Forecasted and calculated river discharge in the Kuban river basin, Vestn. Mosk. Univ., Ser. 5: Geogr., 2011, no. 1, pp. 55–59.
Abrahart, R.J., Anctil, F., Coulibaly, P., Dawson, Ch.W., Mount, N.J., See, L.M., Shamseldin, A.Y., Solomatine, D.P., Toth, E., and Wilby, R.L., Two decades of anarchy? Emerging themes and outstanding challenges for neural network river forecasting, Progr. Phys. Geogr.: Earth Environ., 2012, vol. 36, no. 4, pp. 480–513. https://doi.org/10.1177/0309133312444943
Beven, K., Deep learning, hydrological processes and the uniqueness of place, Hydrol. Processes, 2020, vol. 34, no. 16, pp. 3608–3613.
Bhattacharya, B. and Solomatine, D.P., Machine learning in sedimentation modelling, Neur. Networks, 2006, vol. 19, no. 2, pp. 208–214. https://doi.org/10.1016/j.neunet.2006.01.007
Brooks, K.N., Ffolliott, P.F., and Magner, J.A., Hydrology and the Management of Watersheds, 4th ed., Ames, Iowa: Wiley-Blackwell, 2013. https://doi.org/10.1002/9781118459751
Chen, T. and Guestrin, C., XGBoost: A Scalable Tree Boosting System, Proc., 22nd ACM SIGKDD Int. Conf. Knowledge Discovery Data Mining, pp. 785–794. https://doi.org/10.1145/2939672.2939785
Chernokulsky, A.V., Kozlov, F.A., Zolina, O.G., Bulygina, O.N., Mokhov, I.I., and Semenov, V.A., Observed changes in convective and stratiform precipitation in Northern Eurasia over the last five decades, Environ. Res. Let., 2019, vol. 4, no. 4, ACM SIGKDD Int. Conf. Knowledge Discovery Data Mining. P. 785–794. https://doi.org/10.1145/2939672.2939785
Emori, S. and Brown, S.J., Dynamic and thermodynamic changes in mean and extreme precipitation under changed climate, Geophys. Res. Lett., 2005, vol. 32, p. L17706. https://doi.org/10.1029/2005GL023272
Ghahramani, Z., Probabilistic machine learning and artificial intelligence, Nature, 2015, vol. 521, pp. 452–459. https://doi.org/10.1038/nature14541
Haykin, S., Neural Networks and Learning Machines, 3rd ed. Upper Sadle River, New York: Prentice Hall Publ., 2009.
IPCC, 2013: Climate Change 2013: The Physical Science, Basis. Contribution of Working Group I to the Fifth Assessment Report of the Intergovernmental Panel on Climate Change, T.F. Stocker, D. Qin, G.-K. Plattner, M. Tignor, S.K. Allen, J. Boschung, A. Nauels, Y. Xia, V. Bex, and P.M. Midgey, Cambridge, United Kingdom; NY, USA: Cambridge Univ. Press,
Jain, A., Sudheer, K.P., and Srinivasulu, S., Identification of physical processes inherent in artificial neural network rainfall runoff models, Hydrol. Processes, 2004, vol. 18, no. 3, pp. 571–581.
Lehmann, J., Coumou, D., and Frieler, K., Increased record-breaking precipitation events under global warming, Clim. Change, 2015, no. 4, vol. 132, pp. 501–515.
Luo, J., Ying, K., and Bai, J., Savitzky-Golay smoothing and differentiation filter for even number data, Signal Process., 2005, vol. 85, no. 7, pp. 1429–1434. https://doi.org/10.1016/j.sigpro.2005.02.002
Manual on Flood Forecasting and Warning, WMO, no. 1072, Geneva, 2011.
McCulloch, W.S. and Pitts, W., A logical calculus of the ideas immanent in nervous activity, Bull. Math. Biophys., 1943, vol. 5, pp. 115–133. https://doi.org/10.1007/BF02478259
Moreido, V.M., Gartsman, B.I., Solomatine, D.P., and Suchilina, Z.A., Prospects for short-term forecasting of river streamflow from small watershed runoff using machine learning methods, Hydrosphere. Hazard Process. Phenom., 2020, vol. 2, no. 4, pp. 375–390. https://doi.org/10.34753/HS.2020.2.4.375
Moreido, V., Gartsman, B., Solomatine, D.P., and Suchilina, Z., How well can machine learning models perform without hydrologists? Application of rational feature selection to improve hydrological forecasting, Water (Switzerland), 2021, vol. 13, no. 12, p. 1696. https://doi.org/10.3390/w13121696
Mutlu, E., Chaubey, I., Hexmoor, H., and Bajwa, S.G., Comparison of artificial neural network models for hydrologic predictions at multiple gauging stations in an agricultural watershed, Hydrol. Process., 2008, vol. 22, no. 26, pp. 5097–5106. https://doi.org/10.1002/hyp.7136
Nash, J.E. and Sutcliffe, J.V., River flow forecasting through conceptual models part I—A discussion of principles, J. Hydrol., 1970, vol. 10, no. 3, pp. 282–290. https://doi.org/10.1016/0022-1694(70)90255-6
Pedregosa, F., Varoquaux, G., Gramfort, A., Michel, V., Thirion, B., Grisel, O., Blondel, M., Prettenhofer, P., Weiss, R., Dubourg, V., Vanderplas, J., Passos, A., Cournapeau, D., Brucher, M., Perrot, M., and Duchesnay, E., Scikit-learn: Machine Learning in Python, J. Machine Learning Res., 2011, vol. 12, pp. 2825–2830.
Press, W.H. and Teukolsky, S.A., Savitzky-Golay smoothing filters, Comput. Phys., 1990, vol. 4, no. 6, p. 669. https://doi.org/10.1063/1.4822961
Quinlan, J.R., Learning with continuous classes, Proc. 5th Australian Joint Conf. Artificial Intelligence, 1992, pp. 343–348.
Reichstein, M., Camps-Valls, G., Stevens, B., Jung, M., Denzler, J., and Carvalhais, N., Prabhat, Deep learning and process understanding for data-driven Earth system science, Nature, 2019, vol. 566, pp. 195–204. https://doi.org/10.1038/s41586-019-0912-1
Rodda, H.J.E. and Little, M.A., Understanding Mathematical and Statistical Techniques in Hydrology, Chichester: UK: Wiley, 2015. https://doi.org/10.1002/9781119077985
Rolnick, D., Ahuja, A., Schwarz, J., Lillicrap, T.P., and Wayne, G., Experience replay for continual learning, Advances in Neural Information Processing Systems, 2018, vol. 32. http://arxiv.org/abs/1811.11682
Rumelhart, D.E., Hinton, G.E., and Williams, R.J., Learning representations by back-propagating errors, Nature, 1986, vol. 323, pp. 533–536. https://doi.org/10.1038/323533a0
Savitzky, A. and Golay, M.J.E., Smoothing and differentiation of data by simplified least squares procedures, Anal. Chem., 1964, vol. 36, no. 8, pp. 1627–1639. https://doi.org/10.1021/ac60214a047
Senthil Kumar, A.R., Sudheer, K.P., Jain, S.K., and Agarwal, P.K., Rainfall-runoff modelling using artificial neural networks: comparison of network types, Hydrol. Processes, 2005, vol. 19, no. 6, pp. 1277–1291. https://doi.org/10.1002/hyp.5581
Shen, C.A., Transdisciplinary review of deep learning research and its relevance for water resources scientists, Water Resour. Res., 2018, vol. 54, no. 11, pp. 8558–8593.
Sylvester, Z., Durkin, P., Covault, J.A., and Sharman, G.R., High curvatures drive river meandering: REPLY, Geol., 2019, vol. 47, no. 10. P. e486–e486. https://doi.org/10.1130/G46838Y.1
WMO, 2012. Management of Flash Floods, Integrated Flood Management Tools Series, no. 16, Geneva, 2012.
Funding
Data processing and modeling were supported by the Russian Science Foundation and Krasnodar krai under research project 19-45-233007; DEM was processed under RFBR Project 19-05-00353; the interpretation of results was carried out under subject 147-2019-0001 (state registration AAAA-A18-118022090056-0) of the State Assignment to Water Problems Institute, Russian Academy of Sciences. A.S. Tsyplenkov was supported by the Development Program of the Interdisciplinary Scientific-Educational School at Moscow State University “The Future of the Planet and Global Environmental Changes”).
Author information
Authors and Affiliations
Corresponding author
Rights and permissions
Open Access. This article is licensed under a Creative Commons Attribution 4.0 International License, which permits use, sharing, adaptation, distribution and reproduction in any medium or format, as long as you give appropriate credit to the original author(s) and the source, provide a link to the Creative Commons licence, and indicate if changes were made. The images or other third party material in this article are included in the article’s Creative Commons licence, unless indicated otherwise in a credit line to the material. If material is not included in the article’s Creative Commons licence and your intended use is not permitted by statutory regulation or exceeds the permitted use, you will need to obtain permission directly from the copyright holder. To view a copy of this licence, visit http://creativecommons.org/licenses/by/4.0/.
About this article

Cite this article
Belyakova, P.A., Moreido, V.M., Tsyplenkov, A.S. et al. Forecasting Water Levels in Krasnodar Krai Rivers with the Use of Machine Learning. Water Resour 49, 10–22 (2022). https://doi.org/10.1134/S0097807822010043
Received:
Revised:
Accepted:
Published:
Issue Date:
DOI: https://doi.org/10.1134/S0097807822010043