-
PDF
- Split View
-
Views
-
Cite
Cite
Xiaoqing He, Gary X. Lin, Michael G. Chen, Jennifer X. Zhang, Qiang Ma, Protection against Chromium (VI)–Induced Oxidative Stress and Apoptosis by Nrf2. Recruiting Nrf2 into the Nucleus and Disrupting the Nuclear Nrf2/Keap1 Association, Toxicological Sciences, Volume 98, Issue 1, July 2007, Pages 298–309, https://doi.org/10.1093/toxsci/kfm081
Close - Share Icon Share
Abstract
Chromium (Cr) (VI) is a major environmental toxic metal and a human carcinogen. The molecular events mediating cellular responses to Cr(VI) are not clear at present. We show that Cr(VI) potently induced apoptosis and production of reactive oxygen species (ROS) in mouse hepa1c1c7 cells in a concentration-dependent manner. Mouse embryonic fibroblast cells lacking Nrf2 exhibited elevated ROS production and apoptosis, which were markedly further increased by Cr(VI), suggesting a protective role of Nrf2 against Cr(VI) toxicity. Protection by Nrf2 correlated with induction of cytoprotective genes Ho-1 and Nqo1. Induction of the genes by Cr(VI) involved inhibition of ubiquitination of Nrf2 and accumulation of Nrf2 into the nucleus. In the nucleus, treatment with Cr(VI), but not phenolic antioxidant tert-butylhydroquinone, librates Nrf2 from the Nrf2/Keap1 association and recruits Nrf2 to the antioxidant response elements (ARE) located in the enhancers of Ho-1 and Nqo1. Activation of Nrf2 by Cr(VI) was accompanied by the nuclear translocation and deubiquitination of Keap1 implicating recycling of Keap1 in Nrf2 signaling. Thus, protection against Cr(VI) toxicity involves a transcriptional signaling loop that includes activation of Nrf2 by the toxic metal, transcription of ARE-driven genes, and reduction of ROS production.
Bodies protect against environmental chemicals by evolving genetic programs to maintain cellular homeostasis and function. Induction of cytoprotective enzymes and proteins constitutes an effective strategy of defense against xenochemicals in a number of chemical stress response systems (Klaassen et al., 1999; Leung et al., 2003; Ma and Lu, 2003; Motohashi et al., 2002; Nguyen et al., 2004; Palmiter, 1998; Ramos-Gomez et al., 2001). A common theme is observed in these systems: transcription of the genes is controlled by receptor/transcription factors that sense specific chemical environment of the cells by themselves or associated proteins; activated transcription factors coordinate the transcription of multiple genes through specific response elements located in the enhancers of the genes; and finally, the enzymes and proteins transcribed combat against the chemicals by eliminating the chemicals, antagonizing their action, or both (Hu et al., 2006). Aberrant function of the transcription factors can lead to the loss of or overexpression of the enzymes and proteins leading to disease.
Nrf2, a member of the cap “n” collar basic region-leucine zipper (CNC bZip) transcription factors, serves as one of the major receptor/transcription factors that defend against a range of toxicants or pathological processes, including carcinogens, oxidative lesions, and toxic chemicals. Nrf2 controls the constitutive expression and induction of detoxification enzymes and oxidative stress proteins such as NAD(P)H:quinone oxidoreductase (NQO1) and heme oxygenase 1 (HO-1) through the antioxidant response element (ARE) (Ma et al., 2004; Nguyen et al., 2004). Genetic data revealed that loss of Nrf2 function is associated with increased susceptibility to chemical carcinogenesis, inhalation particles, ovarian toxicants, and autoimmune disease (Chan et al., 2001; Hu et al., 2006; Li et al., 2004; Ma et al., 2006; Ramos-Gomez et al., 2001).
Chromium (Cr), a transition metal element abundantly present in the earth's crust, is widely used in industrial processes including mining, production of stainless steel and chrome pigments, leather tanning, and is used as anticorrosive in cooking systems and boilers. Occupational and environmental exposure to Cr(VI)-containing compounds is known to cause multiorgan toxicity such as renal damage, allergy and asthma, and cancer of the respiratory tract in humans (Goyer, 2001; WHO, 1988). Cr exists in several oxidation states with Cr(VI) and (III) being the most stable forms. While Cr(III) is predominantly present in the environment, Cr(VI) originates mostly from industrial use. Cr(VI) is generally considered to be the toxic form, which readily crosses cell membranes into cells through anion carriers. Inside cells, Cr(VI) is reduced to Cr(V) and (IV), which are unstable and are further reduced to Cr(III); Cr(III) derived from Cr(VI) is believed to be related to Cr(VI) toxicity in cells. On the other hand, Cr(III) from dietary supplements facilitates normal carbohydrate and lipid metabolism, thereby serving as a trace element in the body.
The molecular mechanism by which Cr(VI) elicits biological responses, either toxic or adaptive, is unclear at present but is hypothesized to be related to its reduction to Cr(III) in cells. Cr(V) and (III) derived from reduction of Cr(VI) form covalent interaction with DNA and protein. Moreover, reduction may accompany the production of reactive oxygen species (ROS) resulting in oxidative stress (Ye et al., 1999). Both can lead to cell cycle arrest, apoptosis, and neoplastic transformation. Cr(VI) appears to downregulate the expression and induction of metallothionein I and II (MT1/II) by inhibiting metal-activated transcription factor 1 (MTF1) (Majumder et al., 2003), which plays important roles in cellular protection against a number of heavy metals such as zinc, cadmium, copper, mercury, gold, silver, cobalt, nickel, and bismuth. How cells defend against Cr toxicity, in particular, whether adaptive transcriptional response to Cr plays a role in Cr toxicity, has not been addressed.
In this study, we found that Cr(VI) induced apoptosis and production of ROS dose dependently. Nrf2 protects cells against both apoptosis and ROS production induced by Cr(VI) by coordinately controlling the induction of cytoprotective genes Ho-1 and Nqo1. Moreover, the data revealed novel aspects of Nrf2 activation by Cr(VI), which are different from those by phenolic antioxidant tBHQ. Specifically, the study demonstrated that Nrf2 and Keap1 were translocated into the nucleus in association with each other. Both proteins were ubiquitinated in the cytoplasm but were deubiquitinated upon nuclear translocation. Finally, treatment with Cr(VI) but not tBHQ disrupted the Nrf2/Keap1 association in the nucleus. Our findings provided insights into the mechanism by which Cr(VI) activates gene transcription as a cellular defense against Cr(VI) toxicity.
MATERIALS AND METHODS
Cell culture and treatment.
Mouse hepa1c1c7 cells (kindly provided by Dr J.P. Whitlock, Jr, Stanford University, Stanford, CA), which are highly responsive to inducers of ARE-dependent genes, were grown in α-minimal essential medium (α-MEM) with 10% fetal bovine serum (FBS) and 5% CO2. Mouse Nrf2+/+ and Nrf2−/− embryonic fibroblast cells were derived from wild-type and Nrf2 null mice as described elsewhere (Ma et al., 2004). The cells were cultured in Dulbecco's-MEM with 10% FBS and 5% CO2. Penicillin (100 U/ml) and streptomycin (100 μg/ml) were added to the media to prevent contamination. Cells at confluency were treated as indicated. Potassium dichromate (K2Cr2O7), dimethyl sulfoxide (DMSO), and tert-butylhydroquinone (tBHQ) were purchased from Sigma-Aldrich (St Louis, MO). MG132 was from BioMol (Plymouth, PA). DMSO and water were used as the solvent controls for tBHQ and Cr(VI), respectively.
RNA preparation and northern blotting.
Total RNA was isolated from cells using the Qiagen total RNA isolation kit (Qiagen, Valencia, CA). Total RNA of 3 μg each was fractionated in a 1.2% agarose-formaldehyde gel, transferred to a supercharged nylon membrane, and blotted with a digoxigenin (DIG)-labeled riboprobe prepared with the DIG-labeling reagents (Roche Applied Science, Indianapolis, IN) (Ma et al., 2000). Template cDNAs for generating riboprobes of mouse Ho-1, Mt1, Cyp1a1, Nqo1, Nrf2, and actin were verified by sequencing. Northern signals were visualized by chemiluminescence using a DIG RNA detection kit with CDP Star as a substrate (Roche Applied Science). Actin was probed to control loading variations among samples. Results shown were repeated in two to three separate experiments with consistent observations.
Plasmid construction and transfection.
The full-length coding cDNAs of mouse Nrf2 and Keap1 were obtained by reverse transcription and PCR and were verified by sequencing. The cDNAs were subcloned into pCMV-HA (BD Clontech, Palo Alto, CA) or pcDNA3.1/V5-His (Invitrogen, Carlsbad, CA) to generate pCMV-HA-Nrf2 and pcDNA3.1-V5-His-Keap1. The Nqo1 ARE and Ho-1 ARE constructs were kindly provided by Drs K. Itoh and M. Yamamoto (University of Tsukuba, Tsukuba, Japan). The Nqo1 chimeric reporter contains the ARE enhancer from -865 to -897 base pairs upstream of the transcription start of the mouse Nqo1 gene fused to a β-globin promoter and luciferase cDNA; whereas, the Ho-1 reporter contains the enhancer sequence of mouse Ho-1 from -9728 to -9648. The reporter plasmids and pCMV-HA-Nrf2 were cotransfected into cells using the lipofectamine plus reagents from Invitrogen for induction of luciferase activity.
Immunofluorescent staining.
Hepa1c1c7 cells were grown on four-well chamber slides to 70% confluence and were then fixed with ice-cold 4% paraformaldehyde in phosphate-buffered saline (PBS) for 10 min and permeated with 0.2% Triton X-100 for 15 min. The cells were incubated with anti-Nrf2 antibody (Santa Cruz Biotechnologies, Inc., Santa Cruz, CA) in 1% FBS MEM medium for 1 h at room temperature followed by incubation with Alexa 488–conjugated second antibodies (green, Invitrogen) for another 1 h. After washing with ice-cold PBS three times, the slides were mounted using mounting solution with 4′,6-diamidino-2-phenylindole (DAPI) (counterstaining, blue, Vector Laboratories, Burigame, CA) to visualize the nuclei. The cells were observed with Zeiss LSM510 confocal microscope using fluorescein isothiocyanate-DAPI setting. Fluorescent pictures were taken with equal exposure times.
Cell fractionation.
Nuclear and cytoplasmic fractions were prepared using the Nuclei EZ PREP reagents from Sigma. Briefly, cells at 90% confluency in 10-cm dishes were washed with ice-cold PBS and were lysed with ice-cold Nuclei EZ PREP lysis buffer containing protease and phosphatase inhibitors (1mM phenylmethylsulfonyl fluoride, 1mM Na3VO4, 1mM NaF, and 1 μg/ml of each aprotinin, leupeptin, and pepstain; all added immediately before use). The cell lysate was centrifuged at 500 × g for 5 min at 4°C to give rise to nuclei (pellet fraction) and cytosol (supernatant fraction). The nuclei pellets were washed once with the lysis buffer and resuspended in a radioimmune precipitation assay buffer (RIPA) buffer (50mM Tris-HCl, pH 7.4 with 1% NP-40, 0.25% sodium deoxycholate, and 1mM EDTA; protease and phosphatase inhibitors were added as described above). The nuclear and cytoplasmic fractions were stored at − 80°C till use.
Immunoblotting analysis.
Cells were washed twice with ice-cold PBS and lysed on ice with the RIPA buffer containing protease and phosphatase inhibitors for 30 min. The cell lysate was sonicated briefly and was centrifuged at 14,000 × g for 20 min. Cell lysate (10 μg), nuclear (5–10 μg), or cytoplasmic (30 μg) proteins were fractionated on 10% sodium dodecyl sulfate-polyacrylamide gel electrophoresis (SDS-PAGE), transferred to polyvinylidene difluoride membranes (Bio-Rad Laboratories, Hercules, CA), and blocked with 5% nonfat milk in PBST (PBS plus 0.05% Tween-20). The membrane was blotted with primary antibodies at 4°C overnight with shaking, followed by incubation with horseradish peroxidase–conjugated second antibodies for 1 h at room temperature. Protein bands were visualized using enhanced chemiluminescence detection reagents from Amersham Biosciences (Piscataway, NJ). Actin was blotted to ensure equal loading.
Immunoprecipitation (IP).
Cell lysates or cell fractions were precleared with protein G-agarose (Invitrogen) for 1 h at 4°C, followed by incubation with IP antibodies at 4°C overnight with shaking. Immune complexes were precipitated by incubation with protein G-agarose at 4°C for 1 h and a brief centrifugation. The precipitates were washed extensively with PBST and were subjected to fractionation by SDS-PAGE. Protein bands were detected by immunoblotting with specific antibodies as specified in the figures. Data shown were representatives from two to three separate experiments. Antibodies against Nrf2, Keap1, Cul3, c-Myc, HO-1, MafG/K, c-jun, or c-fos were purchased from Santa Cruz Biotechnology, Inc. The antibodies were tested for specificity and titers by comparing immunoblotting of endogenous proteins, in vitro transcription/translation products, and transiently expressed and tagged proteins before use; the antibodies recognize corresponding proteins as single bands with expected apparent molecular weights (He et al., 2006; Hong et al., 2005; Kobayashi et al., 2004) (data not shown). The antibody against HA tag was obtained from BAbCO (Berkeley Antibody Company, Richmond, CA). Anti-ubiquitin antibody was from Zymed Laboratories, Inc. (South San Francisco, CA). Anti-poly(ADP ribose) polymerase (PARP) antibodies were from Cell Signaling Technology, Inc. (Beverly, MA).
Cytochrome c release.
Cells were grown in 35-mm dishes to 90% confluence and were treated as indicated. Cytoplasmic and mitochondrial fractions were prepared according to a published procedure (Saikumar et al., 1998). Briefly, cells were permealized with 0.05% digitonin isotonic buffer (250mM sucrose, 10mM HEPES, 10mM KCl, 1.5mM MgCl2, 1mM EDTA, and 1mM EGTA, pH 7.1) for 1 min. Soluble fractions of permealized cells containing cytosol were saved by a brief spin. Insoluble fraction was further extracted with 0.5% triton X-100 isotonic buffer for 10 min to release membrane and organelle-bound soluble proteins. Cellular fractions were further centrifuged at 15,000 × g for 20 min at 4°C. Proteins in the resultant supernatant were resolved by SDS-PAGE and immunoblotted with anti-cytochrome c antibody (Cell Signaling Technology, Inc.).
ROS detection.
Intracellular ROS production was detected as described previously (Carter et al., 1994). Cells were cultured in a four-well chamber slides to reach 80–90% confluence and treated as indicated. Thirty minutes prior to the end of treatment, dihydroethium (hydroethidine or DHE, Invitrogen) was added at 5μM as a fluorescent indicator of ROS generation. Cells were washed with ice-cold PBS for three times, fixed with 4% paraformaldehyde, and mounted with mounting solution with DAPI to counterstaining the nucleus. Images were collected with Zeiss LSM510 confocal microscope using Rhodamin-DAPI setting. Micrographs were taken with fixed exposure times. Fluorescence intensity was quantitated using the Optimus Version 6.51 software (Media Cybernetics, Silver Springs, MD). Quantitative data represent means and SDs from five separate fields for each treatment.
Chromatin immunoprecipitation (ChIP) assay.
Cells were treated with Cr(VI) or tBHQ for 5 h. ChIP assay was performed as follows. DNA-proteins were cross-linked by incubating cells with 1% formaldehyde at 37°C. Excess formaldehyde was quenched with glycine at room temperature. Cells were collected in a lysis buffer (5mM Pipes, pH 8.0, 85mM KCl, and 0.5% Igepal CA-630) with protease inhibitors and were centrifuged to pellet nuclei. The nuclei were resuspended in the lysis buffer, repelleted, and resuspended in a nuclei lysis buffer (50mM Tris/HCl, pH 8.0, 10mM EDTA, and 1% SDS) with protease inhibitors. Chromatin was sonicated using a tapered microtip at 40% power output. Cell debris was removed by centrifugation at 4°C. Sheared chromatin was diluted in an IP dilution buffer (0.01% SDS, 1.1% Triton X-100, 1.2mM EDTA, 16.7mM Tris/HCl, pH 8.0, and 167mM NaCl), precleared with protein G containing salmon sperm DNA, and immunoprecipitated with antibodies as described under IP section. DNA-protein complexes were eluted from the protein G-agarose beads with an elution buffer (50mM NaHCO2 and 1% SDS) and were reverse cross-linked by incubating with NaCl at 65°C. The DNA samples were purified and were analyzed by real-time PCR using SYBR green PCR master mix (Applied Biosystems, Foster City, CA) performed on a Bio-Rad iCycler (Bio-Rad) following standard procedures. Briefly, for each reaction, DNA template, forward and reverse primers (10μM each), PCR master mix, and water were added to make a final volume of 50 μl. Thermal cycling was carried out as follows: 95°C for 3 min as initial denaturing, followed by 45 cycles of 94°C for 30 s, 60°C for 30 s, and 72°C for 60 s, and a final extension at 72°C for 2 min. Threshold cycles (CT values) were determined using the iCycler IQ software (Bio-Rad). Real-time PCR results were normalized using 1% of input as an internal control. Relative DNA amounts were calculated from CT values for each sample by interpolating into the standard curve obtained using a series of dilution of standard DNA samples run under the same conditions. The sequences of the primer sets used for real-time PCR are available upon request. The ChIP experiments were routinely performed with two types of negative controls: (1) normal IgG from the same species as that of each IP antibody and (2) specific primer pair of the coding region of Ho-1 or Nqo1.
Cytotoxicity assay.
Hepa1c1c7 cells were seeded into 96-well plate at 8 × 10⁴ cells per well and were cultured overnight. The cells were treated with Cr(VI) for 5 h at concentrations of 0.5, 1, 2, 5, 10, 20, 50, 100, and 200μM. Twenty microliters of Cell Titer 96 AQueous One Solution (Promega, Madison, WI) was added into each well per 100 μl of the culture medium, and the plate was incubated at 37°C for 3 h in a humidified, 5% CO2 incubator. Absorbance at 490 nm was recorded in a 96-well plate reader.
NQO1 enzyme activity assay.
NQO1 activity was performed as described previously (Prochaska and Santamaria, 1988). Briefly, hepa1c1c7 cells were seeded in 96-well plates at a density of 2 × 10⁴ cells/ml and cultured overnight. The culture was replaced with fresh medium with different treatments as described in the figures. After an additional 48 h of culture, the medium was decanted, and the cells were incubated with 50 μl of digitonin and 2mM of EDTA solution for 10 min at 37°C. A reaction mixture was prepared as follows: 0.375 ml of 1M Tris-HCl (pH 7.4), 10 mg of bovine serum albumin, 0.1 ml of 1.5% Tween-20, 10 μl of 7.5mM FAD+ (Sigma), 0.1 ml of 150mM glucose 6-phosphate (Sigma), 9 μl of 50mM NADP+ (Sigma), 30 units of yeast glucose 6-phosphate dehydrogenase (Sigma), 4.4 mg of MTT (Sigma), 15 μl of 50mM menadione (Sigma, added just before use), and distilled water to a volume of 15 ml. Two hundred microliters of the reaction mixture was added to each well for 5 min, and the reaction was stopped by adding a stop solution containing 0.3mM dicoumarol in 0.5% DMSO and 5mM potassium phosphate, pH 7.4. Absorbance at 595 nm was measured with a 96-well plate reader.
Data quantification and statistical analysis.
Quantification of RNA or protein bands was performed using the Image Quant program (Molecular Dynamics, San Jose, CA). Statistical analysis was performed with one-way ANOVA followed by t-test using the GraphPad Prism program (GraphPad Software, San Diego, CA).
RESULTS
Protection against Cr(VI)-Induced Apoptosis and ROS Production by Nrf2
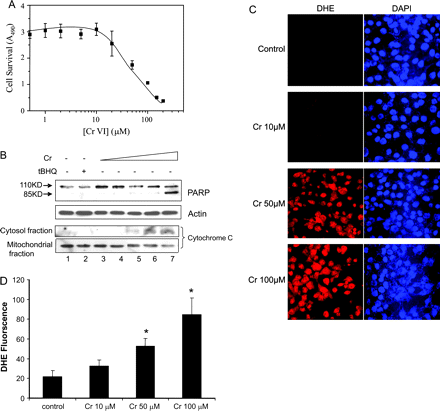
To examine the role of Nrf2 in Cr(VI) toxicity, we first characterized the concentration dependence of Cr(VI)-induced cell death in hepa1c1c7 cells, a cell line highly responsive for induction of Nrf2-regulated genes and sensitive to metal-induced cell damage. As shown in Figure 1A, treatment with Cr(VI) for 5 h reduced cell survival, as indicated by a loss of metabolically active cells, in a concentration-dependent manner; detectable reduction in cell survival was seen at 20μM and 50% reduction was at 45μM (EC50 = 45μM) of Cr(VI). Cr(VI)-induced toxicity was further examined for apoptosis. Figure 1B shows that treatment with Cr(VI) for 5 h induced PARP cleavage and cytochrome c release, two parameters of apoptosis, concentration dependently. The PARP cleavage was detected at Cr(VI) concentrations of 5–10μM and it was dramatically increased at 100μM (upper panel). There was no apparent cell loss during the treatment as indicated by the equal amounts of actin (second panel). Similarly, Cr(VI) induced cytochrome c release (lower two panels). Release of cytochrome c into the soluble cytosolic fraction was detected at 10μM and was largely increased at 50 and 100μM; concomitantly, mitochondrial cytochrome c contents were reduced at these concentrations of Cr(VI), reflecting the release of cytochrome c from the mitochondria into the cytosolic fraction (lanes 5–7). The data indicate that Cr(VI)-induced apoptosis occur at lower concentrations (5–10μM) than cell death (∼20μM) in hepa1c1c7 cells. DHE, an O2•−-sensitive intracellular redox indicator, was used to probe ROS production by Cr(VI). Treatment with Cr(VI) at 10μM for 5 h increased nuclear staining of the oxidized form of DHE (red) indicating increased production of ROS in comparison with that of solvent control (Figs. 1C and 1D). Cr(VI) at 50μM drastically increased ROS production and at 100μM further increased the production. Taken together, Cr(VI) induced apoptosis concentration dependently that correlated well with increased production of ROS, thus implicating ROS production in Cr(VI)-induced cell toxicity.
Cr(VI) induces apoptosis and ROS production in hepa1c1c7 cells. (A) Cell survival. Cells grown in 96-well plates were treated with increasing concentrations of Cr(VI) for 5 h. Cell survival was assayed as described under “Materials and Methods” section. EC50 was estimated to be at 45μM. (B) Apoptosis. Cells were treated with DMSO (lane 1), tBHQ (30μM, lane 2), or Cr(VI) at 2, 5, 10, 50, and 100μM (lanes 3–7) for 5 h. Upper 2 panels: total cell lysate was collected and immunoblotted with anti-PARP or actin antibodies. Arrows indicate PARP and its cleavage product. Lower 2 panels: cytoplasmic and mitochondrial fractions were prepared and immunoblotted with anti-cytochrome c antibodies. (C) ROS production. Cells were treated for 5 h. DHE, a fluorescent dye specific for superoxide anion radical (O2•−), was added 30 min prior to the end of the treatment. DHE, which is blue in the cytoplasm, is oxidized to ethidium by ROS that intercalates with DNA and stains the nucleus in bright red color. Cells were also stained with DAPI for the nucleus (blue). Fluorescence was examined under a fluorescent confocal microscope. (D) Quantification of DHE fluorescence. Data represents means and SD from five separate view fields. *p < 0.01.
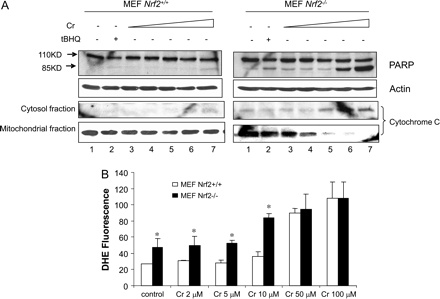
To analyze the role of Nrf2 in Cr(VI) toxicity, we took a genetic approach by utilizing the mouse embryonic fibroblasts with wild-type (MEF Nrf2+/+) and Nrf2 null (MEF Nrf2−/−) genotypes (Fig. 2). Apparent PARP cleavage and cytochrome c release were detected in the absence of Cr(VI) in Nrf2−/− cells compared with Nrf2+/+ cells (Fig. 2A). In Nrf2−/− cells, Cr(VI) increased PARP cleavage at concentrations as low as 2μM, and the increases were dramatic at concentrations of 50 and 100μM; whereas, in Nrf2+/+ cells, Cr(VI) only induced detectable PARP cleavage at 100μM. Similarly, Cr(VI) induced reduction of mitochondrial cytochrome c and increase of cytosolic cytochrome c in a concentration-dependent manner in Nrf2−/− cells. In contrast, only a barely detectable increase of cytochrome c in cytosol was found in Nrf2+/+ cells treated with a high concentration of Cr(VI) (100μM). The data revealed that Nrf2 protected the cells from apoptosis both under a basal condition and in the presence of Cr(VI). We tested if loss of Nrf2 correlates with increased ROS production in the cells (Fig. 2B). As expected, increased DHE nuclear staining was seen in Nrf2−/− cells even without Cr(VI) treatment or at low concentrations of Cr(VI) (2 and 5μM) compared with Nrf2+/+ cells. Cr(VI) at 10μM significantly increased the staining that was further enhanced by treatments with 50 or 100μM of Cr(VI) in Nrf2−/− cells. In Nrf2+/+ cells, apparent increase in DHE staining was only seen at high concentrations of Cr(VI) (50 and 100μM). Together, the data revealed that loss of Nrf2 significantly increased oxidative stress in cells and impaired the capability of the cells to defend against Cr(VI)-induced ROS production and apoptosis.
Nrf2 protects against Cr(VI)-induced apoptosis and oxidative stress in MEF cells. (A) MEF Nrf2+/+ and Nrf2−/− cells were treated as described for Figure 1B. PARP cleavage and cytochrome c release were examined. (B) MEF cells were treated for 5 h. ROS production was detected by staining with DHE and examined using fluorescent confocal microscopy as described for Figures 1C and 1D. Data represent means and SD from five separate view fields. *p < 0.05.
Induction of Nrf2 Target Genes by Cr(VI) via Recruiting Nrf2 to ARE Enhancer
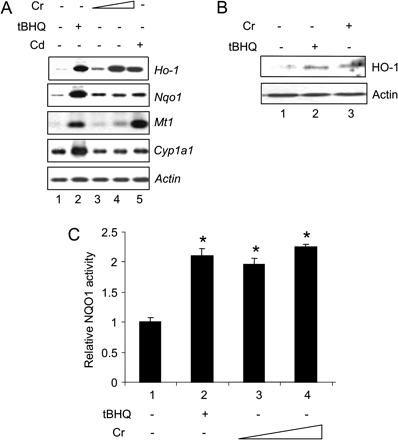
Nrf2 coordinates the transcription of multiple genes in response to environmental stimuli. To identify potential target genes of Cr(VI), we examined the induction of a panel of protective genes. Cr(VI) at 5 and 10μM induced Ho-1, a stress-inducible gene involved in heme catabolism and ROS defense, and Nqo1, a detoxification gene important in quinone reduction and ROS metabolism (Fig. 3A, lanes 3 and 4). In contrast, Cr(VI) did not affect the expression of Mt1 or Cyp1a1. tBHQ, a known activator of Nrf2 and MTF1, was shown to induce Ho-1, Nqo1, Mt1, and Cyp1a1 at 30μM (lane 2), while Cd (10μM), another toxic transition metal, induced Ho-1, Nqo1, and Mt1 (lane 5). Thus, Cr(VI) specifically induced Nrf2 target genes Ho-1 and Nqo1, which is consistent with a role of Nrf2 in protection against Cr(VI) toxicity and oxidative damage (Fig. 2).
Induction of Ho-1 and Nqo1 by Cr(VI) in hepa1c1c7 cells. (A) Northern blotting. Cells were treated with tBHQ (30μM, lane 2), Cr(VI) at 5 or 10μM (lanes 3 and 4), or Cd (10μM, lane 5) for 5 h to analyze induction. Total RNA of 3 μg each was analyzed by northern blotting. (B) Immunoblotting. Cells were treated with tBHQ (30μM, lane 2) or Cr(VI) (10μM, lane 3) for 5 h. Total cell lysate was immunoblotted with anti-HO-1 and actin. (C) Induction of NQO1 activity. Cells were treated with tBHQ (30μM) or Cr(VI) at 2 and 5μM for 48 h. NQO1 activity was determined. *p < 0.05.
Induction of Ho-1 and Nqo1 was accompanied by an increase in the protein level of HO-1 (Fig. 3B) or the enzyme activity of NQO1 (Fig. 3C). Examination of concentration dependence of the induction revealed that induction of the genes by Cr(VI) is concentration dependent within 10μM; whereas at higher concentrations of Cr(VI) (> 50μM), the mRNA expression of the genes were decreased (data not shown). Together with the finding that lack of Nrf2 significantly increased Cr(VI) toxicity and ROS production but reduced the basal and inducible expression of the enzymes without or with low concentrations of Cr(VI), the results suggest that Cr(VI) induces both protective and apoptotic responses in a concentration-dependent manner: at low concentrations, induction of detoxification genes is apparent, whereas at high concentrations, toxicity predominates. Alternatively, Cr(VI) at high concentrations may inhibit the induction of the genes in a manner independent of apoptosis.
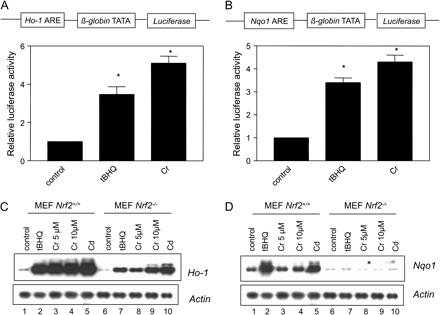
We examined whether induction of Ho-1 and Nqo1 by Cr(VI) is mediated through the Nrf2 pathway. Cr(VI) induced the luciferase reporter expression under the control of either Ho-1 ARE (fivefold induction, Fig. 4A) or Nqo1 ARE (fourfold induction, Fig. 4B). Induction was comparable to that by tBHQ (three- to fourfold). Cr(VI), tBHQ, or Cd induced Ho-1 strongly in MEF Nrf2+/+ cells; induction was largely reduced in MEF Nrf2−/− cells (Fig. 4C). Induction of Nqo1 was similar to that of Ho-1 (Fig. 4D). However, differences in the induction of the two genes were observed. Notably, induction of Ho-1 by Cr(VI) was more robust than that of Nqo1, and induction of Ho-1 was largely reduced but remained detectable in Nrf2 null cells; whereas, both the basal expression and induction of Nqo1 were nearly totally lost in Nrf2−/− cells. The findings suggest that, while expression and induction of Nqo1 is largely dependent upon the function of Nrf2, additional mechanisms contribute to the low-level induction of Ho-1 by Cr(VI) in Nrf2−/− cells.
ARE and Nrf2 dependence of Ho-1 and Nqo1 induction by Cr(VI). (A) and (B) Induction of ARE-luciferase reporter. Hepa1c1c7 cells were transfected with pHo-1-ARE (A) or pNqo1-ARE (B) together with pCMV-HA-Nrf2 and the Rinilla construct (as an internal control, Promega), followed by induction with tBHQ (30μM) or Cr(VI) (10μM) for 5 h. Cell lysate was prepared and luciferase activity was measured using the dual luciferase assay reagents (Promega). Data represent means ± SD from three separate samples. *p < 0.05. (C) and (D) Northern blotting. MEF cells were treated as indicated for 5 h. Total RNA of 3 μg was analyzed by Northern blotting for Ho-1 (C) or Nqo1 (D). Actin was used for loading control.
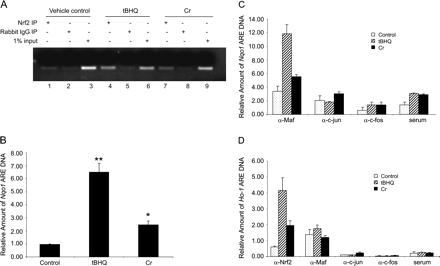
To test if Cr(VI) increases Nrf2 binding to the ARE enhancers of endogenous Ho-1 and Nqo1 genes, ChIP was performed. Hepa1c1c7 cells were treated with Cr(VI) or tBHQ; chromatin DNA was coimunoprecipitated with anti-Nrf2 or other antibodies and was amplified with primers specific to the ARE region of mouse Nqo1 (Figs. 5A–C) or Ho-1 gene (Fig. 5D). As shown in Figure 5A, Nqo1 ARE was readily immunoprecipitated by anti-Nrf2 but not by normal rabbit IgG in tBHQ (as a positive control) or Cr(VI)-treated cells (compare lane 4 with 5 and lane 7 with 8). The amount of DNA input for PCR was comparable among the samples (lanes 3, 6, and 9). Quantification of Nqo1 ARE immunoprecipitated by anti-Nrf2 was performed with quantitative real-time PCR (Fig. 5B). Cr(VI) significantly induced the binding of Nrf2 to Nqo1 ARE (threefold), while tBHQ induced the binding to a larger extent (sixfold). Similarly, Cr(VI) and tBHQ induced the binding of Maf (G/K) to Nqo1 ARE (Fig. 5C). ChIP with antibodies against c-jun or c-fos, two AP-1 proteins that bind to AP-1 sequences similar to ARE, failed to detect significant binding of the proteins to Nqo1 ARE (Fig. 5C). Therefore, Cr(VI) induces the binding of Nrf2/Maf (G/K) but not c-jun/c-fos to endogenous Nqo1 ARE in vivo.
ChIP in hepa1c1c7 cells. (A) Cells were treated with tBHQ (30μM), or Cr(VI) (10μM) for 5 h. Nqo1 ARE cross-linked to proteins was coimmunoprecipitated with anti-Nrf2 antibody or normal rabbit IgG and amplified by real-time PCR with primers specific for mouse Nqo1 ARE enhancer. PCR products were run on 1.5% agorase gel. One percent of input was shown for equal input of the samples. (B) ChIP was performed with quantitative real-time PCR. Quantification of Nqo1 ARE DNA bound to Nrf2 was shown. (C) Association of Maf but not c-jun or c-fos with Nqo1 ARE. Cells were treated, and ChIP assay was performed with anti-Maf G/K, anti-c-jun, or anti-c-fos antibodies. Quantification of real-time PCR data was shown. (D) Association of Nrf2 and Maf but not c-jun or c-fos with Ho-1 ARE. ChIP was performed with anti-Nrf2, anti-Maf G/K, anti-c-jun, or anti-c-fos. Ho-1 ARE precipitated was detected by real-time PCR with primers specific for the Ho-1 ARE sequence. *p < 0.05; **p < 0.01.
Figure 5D shows that both Cr(VI) and tBHQ induced binding of Nrf2 to Ho-1 ARE by four- and eightfold, respectively. Unlike the Nqo1 ARE (Fig. 5C), Cr(VI) or tBHQ treatment did not significantly increase the amount of Ho-1 ARE immunoprecipitated by anti-Maf (G/K) compared with vehicle control, indicating that Maf was not recruited to the Ho-1 ARE by Cr(VI) or tBHQ for induction. Ho-1 ARE immunoprecipitated with anti-c-jun, anti-c-fos, or normal serum was minimal among all treatments, negating a role of the AP-1 proteins in the induction of Ho-1 by Cr(VI) and tBHQ. It was noticeable that the amounts of Ho-1 detected by ChIP with anti-Maf were over 10-fold higher than those with anti-c-jun or anti-c-fos antibody (Fig. 5D), suggesting a role of Maf in the constitutive expression of the gene.
Inhibition of Nrf2 Ubiquitination and Disruption of Nuclear Nrf2/Keap1 Complex by Cr(VI)
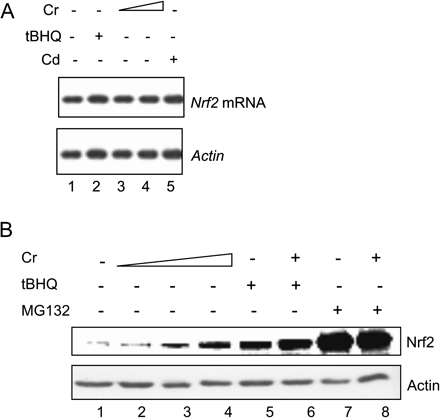
Nrf2 is a labile protein rapidly turned over through the Keap1/Cul3-dependent ubiquitination and proteasomal degradation with a t1/2 of ∼21 min in unstimulated hepa1c1c7 cells (He et al., 2006). To probe the molecular mechanism of Nrf2 activation by Cr(VI), we characterized Nrf2 degradation. Cr(VI) did not affect the mRNA expression level of Nrf2 (Fig. 6A, lanes 3 and 4) but increased the protein level of Nrf2 in both concentration and time-dependent manners (Fig. 6B; data not shown). tBHQ and MG132 were used as positive controls for Nrf2 stabilization. Cotreatment with Cr(VI) and tBHQ or Cr(VI) and MG132 did further increase Nrf2 protein compared with treatment with tBHQ or MG132 alone, indicating Cr(VI) stabilized Nrf2 via the same pathway as those by tBHQ and MG132.
Cr(VI) increases the protein but not mRNA level of Nrf2 protein in hepa1c1c7 cells. (A) Northern blotting. Cells were treated with tBHQ (30μM, lane 2), Cr(VI) (5 and 10 μM, lanes 3 and 4), or Cd (10μM, lane 5) for 5 h. Total RNA was blotted with an Nrf2 riboprobe. (B) Cells were treated for 5 h. Cr(VI), 2, 5, and 10μM (lanes 2–4); tBHQ, 30μM (lane 5); tBHQ + Cr (10μM) (lane 6); MG132, 15μM (lane 7); and MG132 + Cr (10μM) (lane 8). Total cell lystate was immunoblotted with anti-Nrf2. Actin mRNA or protein level of the same sample was shown for equal loading.
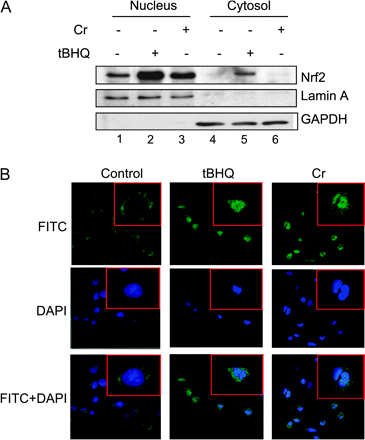
The cytoplasmic and nuclear distributions of Nrf2 upon stimulation with Cr(VI) were characterized (Fig. 7). Cytoplasmic and nuclear fractions were prepared, and their purities were assessed by the presence or absence of lamin A (a nuclear marker) or Glyceraldehyde-3-phosphate dehydrogenase (GAPDH) (a cytoplasmic marker) (Fig. 7A, lower panels). Nrf2 is present in the nucleus in untreated cells reflecting a function of Nrf2 in the basal expression of target genes (lane 1) (Ma et al., 2004). Cr(VI) or tBHQ dramatically increased the nuclear accumulation of the protein (compare lanes 2 and 3 with 1). In the cytoplasm, tBHQ increased the protein level of Nrf2 (lane 5). Similar observations were made with confocal fluorescence immunostaining of Nrf2 (Fig. 7B). In quiescent cells, Nrf2 was present both in the cytoplasm and the nucleus with more in the cytoplasmic compartment. Cr(VI) increased the Nrf2 stain in the nucleus, whereas tBHQ increased the stain in both compartments, consistent with the findings by immunoblotting of Nrf2 in cellular fractions (Fig. 7A). On the other hand, Cr(VI) did not affect the protein levels of Keap1 and Cul3, which are two major components of the Keap1/Cul3-dependent E3 ligase for Nrf2 ubiquitination (see “Discussion” section). Taken together, the data revealed that Cr(VI) activated Nrf2 by stabilizing the protein of Nrf2 but not Keap1 or Cul3.
Effect of Cr(VI) on Nrf2 protein level and nuclear accumulation. (A) Hepa1c1c7 cells were treated with tBHQ (30μM, lanes 2 and 5) or Cr(VI) (10μM, lanes 3 and 6) for 5 h. Nulcear and cytoplasmic fractions were prepared. Protein levels of Nrf2, lamin A (as a nuclear marker), and GAPDH (as a cytoplasmic marker) were examined by immunoblotting. (B) Cells were grown in chamber slides and were immunostained with anti-Nrf2 followed by Alexa 488–conjugated second antibodies (green). The nucleus was stained with DAPI (blue). Lower panels represent overlay of Nrf2 and DAPI fluorescent images.
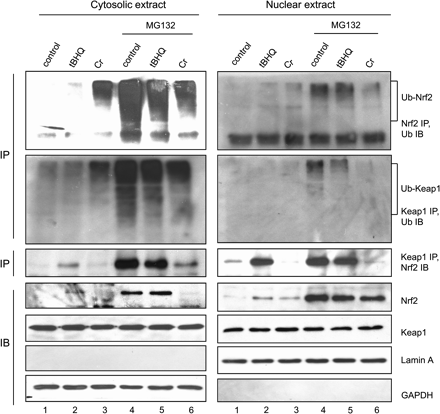
The effect of Cr(VI) on ubiquitination of Nrf2 in different fractions was analyzed. Cytoplasmic and nuclear fractions were prepared with high purity as evidenced by the presence of GAPDH and absence of lamin A in the cytoplasmic preparation and the presence of lamin A and absence of GAPDH in the nuclear fraction (Fig. 8, bottom two panels). The protein levels of Nrf2 and Keap1 were shown in the fourth and fifth panels, which are in agreement with stabilization and nuclear enrichment of Nrf2 but not Keap1 in the nucleus by Cr(VI). Cotreatment with MG132 increased the protein level of Nrf2 in both fractions (lanes 4–6). In the cytoplasm, cotreatment with MG132 and Cr(VI) (but not tBHQ) inhibited the stabilizing effect of MG132 (fourth panel, left, compare lane 6 with 4); the mechanism of the inhibition by Cr(VI) is currently unclear. This inhibitory effect was not seen in the nucleus (fourth panel, right, compare lane 6 with 4).
Cr(VI) inhibits ubiquitination of Nrf2 by disrupting the nuclear Nrf2/Keap1/Cul3 complex. Hepa1c1c7 cells were treated with tBHQ (30μM, lane 2) or Cr(VI) (10μM, lane 3) for 5 h or pretreated with MG132 for 2 h (lane 4) followed by tBHQ (lane 5) or Cr (lane 6) for 5 h. Cytoplasmic and nuclear fractions were prepared. Upper two panels: cytoplasmic (left) and nuclear (right) fractions were immunoprecipitated with anti-Nrf2 (upper panels) or anti-Keap1 (lower panels) and immunoblotted with anti-ubiquitin. Middle panels: cytoplasmic and nuclear fractions were immunoprecipitated with anti-Keap1 and immunoblotted with anti-Nrf2. Bottom 4 panels: cytoplasmic and nuclear fractions were immunoblotted with corresponding antibodies to show the protein levels of Nrf2, Keap1, lamin A (nuclear marker), and GAPDH (cytoplasmic marker).
Detectable ubiquitination of Nrf2 was observed in the cytoplasm of cells treated with Cr(VI) or tBHQ (Fig. 8, first panel, left, lanes 2 and 3). MG132 dramatically increased the ubiquitination of Nrf2 (lane 4). Cotreatment with Cr(VI) or tBHQ and MG132 reduced Nrf2 ubiquitination (first panel, left, compare lanes 5 and 6 with 4). In the nucleus, ubiquitination of Nrf2 was detectable but was largely reduced compared with those in the cytoplasm (first panel); reduction of ubiquitinated Nrf2 was not due to decreased protein levels of Nrf2 since Nrf2 protein was high and comparable among the treatments (third panel, right). Keap1 was found to be ubiquitinated upon treatment with Cr(VI), tBHQ, or MG132 to levels similar to those of Nrf2 in the cytoplasm (second panel, left). Ubiquitination of Keap1 was mostly lost in the nuclear fraction in an analogous manner to the deubiquitination of nuclear Nrf2 (second panel, right). Together, the findings revealed that Cr(VI) inhibits the ubiquitination of Nrf2. Nrf2 was deubiquitinated upon nuclear localization. Keap1 was ubiquitinated in the cytoplasm and deubiquitinated in the nucleus in a parallel fashion to that of Nrf2.
Inhibition of Nrf2 ubiquitination by Cr(VI) suggested the Nrf2/Keap1 complex as a target of Cr(VI). Association of Nrf2 with Keap1 was examined by co-IP. Detectable association of Nrf2 and Keap1 was seen in the cytoplasm of untreated, tBHQ, or Cr-treated cells consistent with the low protein levels of Nrf2 in the cytoplasm (Fig. 8, third panel, left, lanes 1–3). MG132 markedly increased the association (lane 4). tBHQ did not affect the association in the presence of MG132. A low level of Nrf2/Keap1 association was observed with the Cr(VI) and MG132 cotreatment, reflecting inhibition of Cr(VI) on MG132-induced stabilization of Nrf2 (third panel, left, compare lane 6 with 4). In the nucleus, association of the proteins was detected in untreated cells (third panel, right, lane 1). tBHQ increased the association (lane 2); however, treatment with Cr(VI) reduced the association to lower than the control (compare lane 3 with 1). Since the protein level of nuclear Nrf2 in Cr(VI)-treated cells was similar to that of tBHQ treatment (the fourth panel, right), the result implicates disruption of the Nrf2/Keap1 association in the nucleus by Cr(VI). To better compare the effect of Cr(VI) and tBHQ on Nrf2/Keap1 association, cells were cotreated with MG132 and Cr(VI) or tBHQ to increase the protein level of Nrf2 to a similar level (fourth panel, right, lanes 4–6). MG132 alone increased the nuclear Nrf2/Keap1 association (third panel, right, lane 4). A similar level of the association was observed with cotreatment of MG132 and tBHQ, consistent with the finding that tBHQ did not affect MG132-induced association in the cytoplasm (left, compare lane 5 with 4). However, treatment with Cr(VI) dramatically reduced the Nrf2/Keap1 association (right, lane 6), even though the protein level of nuclear Nrf2 was high. The findings revealed that, while tBHQ does not affect the association of Nrf2 and Keap1, Cr(VI) treatment markedly reduces the association in the nucleus.
DISCUSSION
Examination of Cr(VI) toxicity in hepatoma cells and Nrf2-deficient fibroblasts revealed a critical role of Nrf2 in defense against Cr(VI)-induced apoptosis and oxidative stress. Specifically, loss of Nrf2 function substantially increased the sensitivity of the cells to Cr(VI)-induced toxicity. At concentrations of up to 100μM of Cr(VI), no apparent PARP cleavage was seen in Nrf2+/+ cells; whereas in Nrf2−/− cells, PARP cleavage was detectable in the absence of Cr(VI) and at low concentrations of Cr(VI) (2μM) and was markedly increased at 50 and 100μM. Similarly, Cr(VI)-induced cytochrome c release from the mitochondria into the cytoplasm at concentrations of 10 to 100μM in the null cells, while apparent cytochrome c release was not observed in the wild-type cells at the same concentrations. Furthermore, Cr(VI) increased ROS production concentration dependently that correlated with the induction of apoptosis in the cells. Nrf2 null cells exhibited elevated levels of ROS production even in untreated cells or cells treated with low concentrations of Cr(VI). Cr(VI) at 10μM dramatically increased the ROS production in the null cells, while higher concentrations (> 50μM) was required to produce similar changes in the wild-type cells. In hepa1c1c7 cells, Cr(VI)-induced cell death, apoptosis, and ROS production occur at low concentrations of Cr(VI) (5–20μM) and are dramatically increased at high concentrations of Cr(VI) (50–100 μM). Thus, a potential mechanism by which Nrf2 mediates protection against Cr(VI)-induced cell death involves reduction of the basal as well as Cr(VI)-induced ROS production.
Induction of apoptosis and ROS production by Cr(VI) was inversely correlated with the induction of ARE-dependent expression of antioxidant gene Ho-1 and detoxification gene Nqo1 (controlled by Nrf2) but not Mt1 (controlled by MTF1) or Cyp1a1 (controlled by AhR). The induction spectrum corroborated with a role of Nrf2 (not MTF1 or AhR) in the protection against Cr(VI) toxicity. HO-1 and HO-2, two isozymes of HO, metabolize heme to carbon monoxide (a vasodilator) and biliverdin/bilirubin (endogenous antioxidants). While HO-2 is constitutively expressed in certain tissues, HO-1 is expressed at a low level under basal conditions but is highly inducible by a wide range of signals in many cell types. Ablation of Ho-1 leads to increased heme-mediated oxidative injury in astrocytes (Chen-Roetling et al., 2005), exacerbation of myocardial ischemia/reperfusion injury in diabetic mice (Liu et al., 2005), elevated ROS production in endothelial cells, and promoting atherosclerotic lesion formation and vascular remodeling (Yet et al., 2003). On the contrary, increased expression of Ho-1 is associated with resistance against oxidative stress–mediated cell death in neurons (Chen et al., 2000), anti-inflammatory responses, and prevention against antibody-induced transplant arteriosclerosis (Hancock et al., 1998). Loss or decrease in the expression of Nqo1 is associated with increased toxicity and carcinogenicity of benzene and menedione (Recio et al., 2005) and modulation of in vivo redox state and accumulation of abdominal adipose tissue (Gaikwad et al., 2001). Since oxidative damage is a hallmark and, at least in part, a mechanism of these lesions, these lines of studies support that both HO-1 and NQO1 protects against a wide range of chemical injury and pathological lesions including heavy metal toxicity by way of ROS reduction. This notion does not exclude other ARE-regulated and Nrf2-controlled genes, which are to be identified, as target genes of Cr(VI) in the protection against Cr(VI)-induced oxidative stress and apoptosis. The close correlation among Cr(VI)-induced apoptosis, ROS production, Nrf2 activation, and Ho-1 and Nqo1 induction in cultured cells at concentrations between 1 and 20μM suggests activation of Nrf2 as a sensitive mechanistic model of Cr(VI) action at a molecular level.
Protection against chemical toxicity by Nrf2 via induction of cytoprotective genes and ROS reduction has been reported in intact animals for a number of toxicants including acetaminophen, 4-vinyl cyclohexene diepoxide, and diesel exhaust (Chan et al., 2001; Hu et al., 2006; Li et al., 2004). Interestingly, a recent human study of chrome-plating workers exposed to Cr(VI), revealed a close correlation among Cr levels in exhaled breath condensate (EBC) and EBC oxidative stress biomarkers, H2O2 (r = 0.54, p < 0.01) and melondiadehyde (r = 0.59, p < 0.01), as well as urinary Cr levels (r = 0.25, p < 0.05). Thus, oxidative damage takes place in the human lungs due to occupational exposure to Cr(VI), consistent with the notion that oxidative damage serves as a potential mechanism of Cr toxicity in humans (Caglieri et al., 2006). Given that induction of ARE-dependent genes and expression of Nrf2 occur broadly in human tissues, it can be hypothesized that Nrf2 plays a role in protection against Cr(VI)-induced toxicity by way of reducing oxidative damage in human tissues and cells. Further studies are needed to substantiate this notion.
The cytoplasmic Nrf2 is regulated by ubiquitination and proteasomal degradation in the absence of an activator through the Keap1/Cul3-dependent E3 ligase, where Keap1 serves as a substrate adaptor (Cullinan et al., 2004; Kobayashi et al., 2004; Zhang et al., 2004). The mechanism by which Nrf2 is activated by environmental chemicals is, at the best, only partially known. According to the model, Keap1 appears to act as a sensor of environmental signals by interacting with xenochemicals through its thiol groups. The nuclear translocation and the fate of Nrf2 in the nucleus remain poorly understood. Analysis of induction of Ho-1 and Nqo1 by Cr(VI) revealed several unique signaling events in the activation of Nrf2 in comparison with that by phenolic antioxidant tBHQ. Notably, both Cr(VI) and tBHQ recruited Nrf2 into the nucleus; however, Nrf2 remained associated with Keap1 in the presence of tBHQ, while the Nrf2/Keap1 association was disrupted by Cr(VI) in the nucleus. Moreover, the disruption was observed even in the presence of MG132, a potent stabilizer of Nrf2, implying that Cr(VI) treatment not only prevents the formation of new Nrf2/Keap1 association but also dissociates Nrf2 from the existing complex. In a separate study, we observed that treatment with arsenic, a soft metal, also potently disrupts the Nrf2/Keap1 complex in the nucleus (He et al., 2006). These analyses strongly indicate that toxic metals activate Nrf2 through a different mechanism to that of phenolic antioxidants, suggesting multiple signaling events in the regulation of Nrf2 by different xenochemicals. In this respect, toxic metals serve as a unique probe to provide insights into Nrf2 signaling in the nucleus.
Nrf2 and Keap1 were detected in association with each other in the nucleus in the presence of MG132 or tBHQ. Cul3, a key component of the E3 complex for Nrf2 ubiquitination, was also detected in association with Nrf2 in the nucleus (data not shown) (He et al., 2006). The findings are consistent with a model in which Nrf2 translocates into the nucleus together with Keap1 and Cul3.
Ubiquitination of both Nrf2 and Keap1 is detected but is largely reduced in the nucleus compared with that in the cytoplasm of cells treated with Cr(VI), tBHQ, MG132, or MG132 plus Cr(VI) or tBHQ. Substrate-specific deubiquitinases have been reported. For instance, regulation of the protein stability of p53 involves a dynamic process that depends on the balance between the Mdm2-mediated ubiquitination and the herpesvirus-associated ubiquitin-specific protease-mediated deubiquitination of p53 in vivo (Li et al., 2002). By analogy with the findings of p53 ubiquitination/deubiquitination, we postulate that a nuclear deubiquitinase interacts with the ubiquitinated Nrf2/Keap1 complex and deubiquitinates the proteins. The nature of the deubiquitinase is currently under investigation.
The protein level of Keap1 was not altered by the treatments with Cr(VI), tBHQ, MG132, or combinations of the agents. Together with the fact of nuclear translocation and deubiquitination of the Keap1 protein, this observation supports a model of Keap1 cytoplasmic/nuclear cycling, in which ubiquitinated Keap1 is recruited into the nucleus in a complex with Nrf2. Both proteins were then deubiquitinated. Thereafter, Nrf2 is recruited to the ARE via an as-yet-unclear mechanism, and Keap1 is shuttled back to the cytoplasm assisting a new round of Nrf2 ubiquitination and activation. The recycling of Keap1 between the cytoplasm and the nucleus is also supported by findings that nuclear export inhibitors prevented Keap1 recycling leading to the accumulation of Keap1 in the nucleus (Nguyen et al., 2005). Therefore, in addition to functions of Keap1 described previously (i.e., chemical sensing, anchoring Nrf2 in the cytoplasm, and serving as a substrate adaptor in the Cul3-dependent E3 complex for Nrf2), our study provided evidence for an active role of Keap1 in Nrf2 nuclear translocation and processing.
The authors thank Dr L. Millecchia and Ms S. Friend for suggestions on confocal fluorescence microscopy. The findings and conclusions in this report are those of the authors and do not necessarily represent the views of the National Institute for Occupational Safety and Health.
References
Author notes
Present address: Department of Chemistry and Chemical Biology, Harvard University, 12 Oxford Street, Cambridge, MA 02138.




Comments