


Abstract
New noninvasive ventilation (NIV) modes can automatically adjust pressure support settings to deliver effective ventilation in response to varying ventilation demands. It is recommended that fixed expiratory positive airway pressure (FixedEPAP) is determined by attended laboratory polysomnographic (PSG) titration. This study investigated whether automatically determined EPAP (AutoEPAP) was noninferior to FixedEPAP for the control of obstructive sleep apnea (OSA) during intelligent volume-assured pressure support (iVAPS) treatment of chronic hypoventilation.
In this randomized, double-blind, crossover study, patients with chronic hypoventilation and OSA used iVAPS with AutoEPAP or FixedEPAP over two separate nights of attended PSG. PSG recordings were scored by an independent scorer using American Academy of Sleep Medicine 2012 criteria.
Twenty-five adults (14 male) with chronic hypoventilation secondary to obesity hypoventilation syndrome (n = 11), chronic obstructive pulmonary disease (n = 9), or neuromuscular disease (n = 5), all of whom were on established home NIV therapy, were included (age 57 ± 7 years, NIV for ≥3 months, apnea-hypopnea index [AHI] >5/hour). AutoEPAP was noninferior to FixedEPAP for the primary outcome measure (median [interquartile range] AHI 2.70 [1.70–6.05]/hour vs. 2.40 [0.25–5.95]/hour; p = .86). There were no significant between-mode differences in PSG sleep breathing and sleep quality, or self-reported sleep quality, device comfort, and patient preference. Mean EPAP with the Auto and Fixed modes was 10.8 ± 2.0 and 11.8 ± 3.9 cmH2O, respectively (p = .15).
In patients with chronic hypoventilation using iVAPS, the AutoEPAP algorithm was noninferior to FixedEPAP over a single night’s therapy.
It is unknown whether an automatically adjusting expiratory positive airway pressure (EPAP) mode is as efficacious as a polysomographically determined fixed EPAP for the control of the upper airway during noninvasive ventilation for disorders of chronic hypoventilation. In this study, the algorithms used to adjust EPAP were noninferior for the control of obstructive sleep apnea to a polysomographically determined fixed EPAP mode in an intelligent volume-assured pressure support device. This is the first study to demonstrate that a fully automatic noninvasive ventilator algorithm has similar efficacy to fixed pressures determined by full polysomnography; such devices may reduce the need for polysomnographic monitoring in disorders of chronic hypoventilation.
INTRODUCTION
The development of chronic hypoventilation in conditions such as obesity hypoventilation syndrome (OHS), chronic obstructive pulmonary disease (COPD), and neuromuscular disease (NMD) has major adverse consequences on health care utilization, quality of life, and mortality.1–3 Increasing numbers of patients with chronic hypoventilation are being treated with noninvasive ventilation (NIV), and numerous studies have reported improvements in gas exchange, hospitalization rates, quality of life, and mortality.4–11 Establishing patients on optimal NIV requires specialized expertise, careful review, and close monitoring. An attended titration polysomnography (PSG) or a review PSG in those initiated on NIV empirically is recommended to optimize therapy.12 PSG is also important to optimize the treatment of coexisting obstructive sleep apnea (OSA), as described by current recommendations.12,13 OSA is common in patients with chronic hypoventilation disorders.14–17 Effective treatment of OSA is important because, in addition to sleep disruption, upper airway obstruction is associated with reduced alveolar ventilation.
Although patients are often treated with fixed expiratory positive airway pressure (EPAP) and pressure support (PS) settings, NIV modes are now available that automatically adjust pressure settings to deliver effective ventilation in response to varying ventilation demands. One such NIV mode is volume-assured pressure support (VAPS) that uses automated algorithms to adjust PS to deliver, on average, an appropriate preset target ventilation in changing conditions. Automated algorithms to adjust EPAP with the aim of maintaining upper airway patency and controlling OSA (AutoEPAP) are also available in some VAPS devices. These devices respond in real time to changing pressure requirements during sleep18 and might have clinical benefits such as reduced air leak and improved patient comfort. In addition, they have the potential to reduce the need for PSG monitoring and to reduce health care costs.
To our knowledge, there are no studies assessing the effectiveness of an AutoEPAP algorithm for control of OSA in VAPS devices. Therefore, the primary aim of this study was to determine whether AutoEPAP was noninferior to fixed EPAP pressure (FixedEPAP) for the control of OSA during VAPS treatment. Specifically, we compared the effectiveness of an AutoEPAP VAPS device with a FixedEPAP VAPS mode (ResMed Ltd intelligent volume-assured pressure support [iVAPS] device, set in Auto or FixedEPAP modes, respectively, see Supplemental Material for more detail on algorithms used) in stable chronic hypoventilation patients established on traditional PS NIV.
METHODS
This noninferiority randomized crossover study included stable chronic hypoventilation patients with comorbid OSA who were receiving PS NIV. Details of patient recruitment and flow are shown in Figure 1. The study was approved by the Institutional Review Boards of the University of Western Australia and Sir Charles Gairdner Hospital (2014–143), and patients provided written informed consent prior to participation.
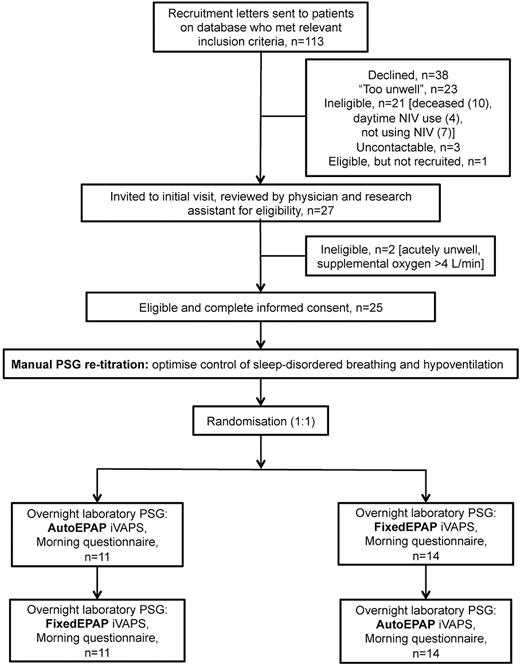
Study flow diagram. EPAP, expiratory positive airway pressure; iVAPS, intelligent volume-assured positive airway pressure support; PSG, polysomnography.
Patients
Patients were recruited from an existing database of a tertiary sleep center experienced in the management of chronic hypoventilation. All patients were diagnosed and managed by specialist sleep physicians, and titration of device settings included comprehensive clinical review, overnight treatment titration PSG(s), and regular follow-up blood gas measurements. Patients were included if clinically stable, at least 18 years of age, and well established on NIV prior to study entry (use of NIV for ≥3 months). They had a documented diagnosis of OHS, COPD, or NMD with sleep hypoventilation and/or daytime hypercapnia (arterial carbon dioxide pressure [PaCO2] >45 mmHg) and OSA (apnea-hypopnea index [AHI] ≥5/hour, as documented in diagnostic or pressure determination sleep study report). Patients were excluded if they were nonadherant with NIV treatment (usage <4 hours/night), required ventilator support during wakefulness, required supplemental oxygen at >4 L/minute, or were medically unsuitable (see online supplement for more detail).
Procedures
Patients were sent information about the study in the mail and phoned 2 weeks later by a research assistant and invited for an initial assessment visit. Participants were told “we will test a new software program for a home ventilator to treat sleep-disordered breathing.” At the initial visit, a physician (NM or BS) assessed the patient’s clinical status to determine eligibility based on the above criteria. Baseline medical diagnostic and treatment information was collected and an arterialized capillary blood gas measurement was taken. The patient’s current mask was reviewed and an appropriate new replacement mask (ResMed) was selected by an experienced sleep technologist. A target alveolar ventilation and resting respiratory rate was determined by the iVAPS “Learn Target” procedure (see online supplement).
An overnight PSG retitration was performed by experienced (≥5 years) sleep technologists to ensure current EPAP, and other device settings were optimal. PSG was performed using the Compumedics Grael PSG system (Compumedics Ltd, Abbotsford, Australia) which recorded the following signals: C3/A2, C4/A1, F3/A2, F4/A1, O3/A2, and O4/A1 electroencephalogram, bilateral electro-oculogram, submental electromyogram (EMG), electrocardiogram, mask flow and pressure, oximetry, transcutaneous carbon dioxide (TcCO2) (SenTec AG, Therwil, Switzerland), chest and abdominal movement (inductance plethysmography), body position, sound intensity, and bilateral tibial EMGs.
Titration took place with the device in spontaneous/timed mode, starting with the patient’s usual pressure and humidification settings, an optimal mask (see above) and usual chin strap. Other settings used a consistent approach for all patients (see online supplement, Table 1). If the device settings were not optimally controlling OSA and/or sleep hypoventilation or if there were other problems such as patient-device dysynchrony or patient discomfort, then the ventilator settings were adjusted by the experienced sleep technologist, based on current titration guidelines.12,13 Retitration studies were reviewed by at least two experienced sleep physicians (BS, DH, NM) and a consensus reached to determine the optimal device settings.
Randomization and Treatment Settings
Patients were studied on two separate nights using AutoEPAP or FixedEPAP iVAPS modes, applied in random order. Randomization was performed by the study sponsor using a computer program, and the randomization codes were sealed in opaque envelopes managed by a hospital staff member not involved in the study.
The FixedEPAP setting was determined from the retitration night and the AutoEPAP settings from the manufacturer’s default recommendations (see Supplementary Table 1) or according to physician judgement based on the retitration study. FixedEPAP was unchanged from usual settings in 18 participants and was increased by 1 (n = 2) or 2 (n = 3) cmH2O or decreased by 1 cmH2O (n = 2) in the remainder. On both study nights, the PS minimum was 5 cmH2O and maximum was 20 cmH2O; other settings (eg, final trigger setting) were determined from the titration night and were the same on both study nights. Patients who were on supplemental oxygen at baseline remained on supplemental oxygen, at the same flow rate, throughout all the study nights. The same iVAPS device was used throughout the study, and the mode and other settings were programed by a staff member not involved in overnight monitoring. On study nights, patients were monitored by experienced sleep technologists to ensure good PSG signal quality and to make mask adjustments for ongoing excessive leak, with no other interventions undertaken. One software change was made early in the trial, and repeat studies were performed on three patients, with no consequences for randomization order (see online supplement for additional details).
Outcomes
The primary study outcome was control of OSA as assessed by the AHI determined during PSG. Secondary outcomes were other PSG parameters relating to nocturnal breathing and sleep architecture, questionnaire comfort ratings, and device mode preference. Study night PSGs were scored according to current guidelines19 by an experienced sleep technologist unaware of the study hypothesis. A second sleep technologist scored a random 40% of the studies to assess interobserver reliability. The morning after each study night, patients completed an in-house 11-point Likert scale questionnaire asking about comfort using the device and, on the morning after the final night were asked, “which night’s therapy was your overall preference?”
Statistical Analysis
Analyses were performed using SPSS for windows (version 22.0, Chicago, Illinois, USA). Parametric data were described using mean and standard deviation and comparisons made using paired t tests or unpaired t tests, as appropriate. Nonparametric data were described using medians and interquartile ranges (IQRs) and comparisons made with the Mann-Whitney U test (paired) or Wilcoxon signed rank test (unpaired). Inter-rater reliability was assessed using intraclass correlation coefficient (ICC).
Post hoc analyses to determine predictors of individual differences between modes in nocturnal breathing PSG parameters used stepwise multiple linear regression. Putative predictors were age; gender; body mass index; disease group; difference between modes in mean: EPAP, inspiratory positive airway pressure (IPAP), and PS. Statistical significance was defined as a p-value <.05.
A standard deviation of 2.55 events/hour (based on data from the study sponsor) and a noninferiority margin of two events/hour were used.20 Based on a crossover noninferiority hypothesis test,21 with alpha of 5% and 80% power, a sample size of at least 22 patients was determined to be sufficient to detect inferiority of AutoEPAP compared with FixedEPAP iVAPS for a difference in AHI.
RESULTS
Study Participants
Twenty-five patients consented and completed the study, of whom 11 (44%) had OHS, nine (36%) had COPD, and five (20%) had NMD; baseline characteristics are shown in Table 1. At the time of enrolment, participants had been using NIV in the home for a median of 37 months (range: 3–174 months). Study nights were separated by a median (IQR) of 7 (7–8) days.
Baseline Characteristics of Study Participants.
| Baseline characteristic | OHS (n = 11) | COPD (n = 9)* | NMD (n = 5)* | Total (n = 25) |
|---|---|---|---|---|
| Age, years | 54.6 ± 7.7 | 57.8 ± 6.7 | 62.6 ± 5.5 | 57.3 ± 7.4 |
| Male, n (%) | 4 (36.4) | 7 (77.8) | 3 (60) | 14 (56) |
| BMI, kg/m2 | 55.7 ± 8.6 | 38.3 ± 13.2 | 31.4 ± 11.6 | 44.6 ± 14.8 |
| Diagnostic AHI**, /hour | 69.4 ± 46.8 | 71.4 ± 57.7 | 62.9 ± 24.7 | 69.0 ± 46.9 |
| Usual EPAP, cmH2O | 13.3 ± 3.3 | 10.4 ± 4.8 | 9.5 ± 4.4 | 11.5 ± 4.3 |
| Usual IPAP, cmH2O | 21.4 ± 2.1 | 19.3 ± 3.1 | 18.2 ± 4.7 | 20.0 ± 3.1 |
| S/T mode, n | 1 | 3 | 5 | 9 |
| Supplemental oxygen, n | 1 | 3 | 1 | 5 |
| pH¶ | 7.40 ± 0.02 | 7.40 ± 0.02 | 7.41 ± 0.03 | 7.40 ± 0.02 |
| pCO2¶, mmHg | 44.4 ± 3.1 | 43.0 ± 4.7 | 41.9 ± 5.0 | 43.1 ± 4.2 |
| pO2¶, mmHg | 64.9 ± 7.4 | 60.5 ± 8.2 | 63.5 ± 7.4 | 63.5 ± 7.9 |
| SO2¶, % | 92.6 ± 2.2 | 90.9 ± 2.8 | 92.2 ± 2.5 | 91.9 ± 2.5 |
Data are presented as number of patients (%) or mean ± standard deviation.
*To facilitate achieving the required subject numbers, two patients were recruited who did not meet the full recruitment inclusion criteria: one patient with airflow limitation due to cystic fibrosis was included in the COPD group; and one patient with congenital kyphoscoliosis was included in the NMD group.
**n=23, two patients were recruited on the basis of a treatment PSG AHI >5/hour.
¶Measurements were from an arterialized capillary blood gas, taken at the initial assessment visit.
AHI, apnea-hypopnea index; BMI, body mass index; COPD, chronic obstructive pulmonary disease; EPAP, expiratory positive airway pressure; IPAP, inspiratory positive airway pressure; NMD, neuromuscular disease; OHS, Obesity hypoventilation syndrome; pCO2, carbon dioxide pressure; pO2, oxygen pressure; SO2, oxygen saturation; S/T, spontaneous/timed.
Primary Outcome
The ICC for AHI between the two independent scorers was good22 (0.64, 95% confidence interval [CI] 0.30–0.83; p = .001). AHI data are presented showing both parametric and nonparametric comparisons. However, the AHI data were strongly skewed, and for the purposes of noninferiority testing, the data were normalized using log transformation. There was no statistically significant difference in AHI between AutoEPAP and FixedEPAP (Figure 2 and Table 2). The upper bound one-sided 95% CI for the mean difference in log (AHI+1) for AutoEPAP versus FixedEPAP was 0.21 and the log (noninferiority margin+1) was 0.48, meaning that AutoEPAP was noninferior to FixedEPAP. Of note, residual apneas were infrequent, found in only two patients on the FixedEPAP night and four on the AutoEPAP night, and their apnea index was usually low (one patient had apnea index of 7/hour and the others were <3/hour).
Comparison of Polysomnographic Data During Use of FixedEPAP and AutoEPAP iVAPS.
| Outcome* | FixedEPAP (n = 25) | AutoEPAP (n = 25) | Mean difference between modes (AutoFixed) (95% CI) | p-value |
|---|---|---|---|---|
| AHI, /hour | 4.27 ± 5.78 | 4.01 ± 3.82 | −0.26 (−2.58, 2.06) | .82 |
| AHI, /hour | 2.40 (0.25–5.95) | 2.70 (1.70–6.05) | N/A | .86 |
| Apneas, /hour | 0 (0-0) | 0 (0-0) | N/A | .34 |
| Hypopneas, /hour | 2.40 (0.27–5.75) | 2.55 (1.69–5.75) | N/A | .93 |
| Log (AHI+1), /hour | 0.52 ± 0.42 | 0.58 ± 0.34 | 0.06 (−0.08, 0.21) | .38 |
| ODI3%, /hour | 3.50 (1.45–9.60) | 4.20 (2.05–11.05) | N/A | .31 |
| ODI4%, /hour | 1.10 (0.20–4.65) | 1.60 (0.05–5.90) | N/A | .41 |
| Mean SpO2, % | 94.13 ± 2.22 | 93.75 ± 2.18 | −0.38 (−0.80, 0.04) | .07 |
| Time SpO2 <90%, min | 0.40 (0–5.70) | 0.50 (0–21.95) | N/A | .64 |
| Lowest SpO2, % | 87.95 ± 2.82 | 86.54 ± 4.74 | −1.41 (−3.29, 0.47) | .13 |
| Mean TcCO2, mmHg** | 46.78 ± 6.10 | 47.44 ± 5.04 | 0.66 (−1.61, 2.93) | .55 |
| Peak TcCO2, mmHg** | 52.8 ± 8.2 | 53.2 ± 5.4 | 0.4 (−3.4, 4.3) | .81 |
Data are presented as median (interquartile range) or mean ± standard deviation.
*All outcome measures are calculated per total sleep time.
**TcCO2, data presented for 24 patients (one case missing data due to equipment malfunction/failure).
AHI, apnea-hypopnea index; CI, confidence interval; EPAP, expiratory positive airway pressure; iVAPS, intelligent volume-assured positive airway pressure support; N/A, not applicable; ODI3%, oxygen desaturation index 3%, ODI4%, oxygen desaturation index 4%; SpO2, oxygen saturation; TcCO2, transcutaneous carbon dioxide tension.
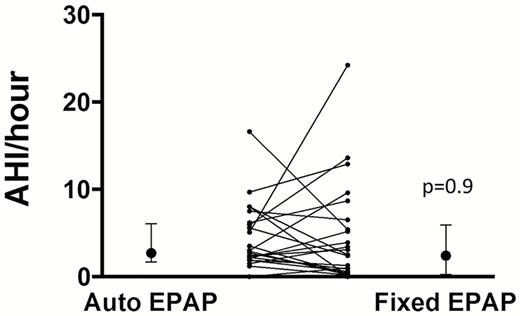
Primary outcome (apnoea-hypopnea index) comparisons between AutoEPAP and FixedEPAP iVAPS nights: individual data, medians (dots) and interquartile ranges (whiskers). EPAP, expiratory positive airway pressure; iVAPS, intelligent volume-assured positive airway pressure support.
Secondary Outcomes
There were no significant differences between treatment modalities for respiratory outcomes (Table 2), sleep architecture outcomes (Table 3), or self-reported sleep quality and comfort ratings on the morning after the study nights (Table 4). There was no difference in patient preference between the two treatment modes (p = .8).
Comparison of Polysomnographic Sleep Quality Outcomes Between FixedEPAP and AutoEPAP iVAPS.
| Outcome | FixedEPAP (n = 25) | AutoEPAP (n = 25) | Mean difference between modes (AutoFixed) (95% CI) | p-value |
|---|---|---|---|---|
| Total recording time, minutes | 513.6 ± 84.8 | 500.9 ± 105.4 | −12.7 (−46.8, 21.4) | .45 |
| Total sleep time, minutes | 340.7 ± 110.9 | 331.4 ± 109.3 | −9.4 (−49.9, 31.2) | .64 |
| Sleep efficiency, % | 65.5 ± 17.8 | 65.1 ± 15.1 | −0.4 (−7.0, 6.1) | .90 |
| Supine sleep, % | 51.9 ± 36.4 | 50.1 ± 34.0 | −1.8 (−14.7, 11.2) | .78 |
| Sleep latency, minutes | 16.5 (7.8–38.8) | 16.5 (9.3–35.0) | N/A | .37 |
| Stage 1, % | 26.2 ± 14.3 | 24.1 ± 13.1 | −2.1 (−8.4, 4.2) | .50 |
| Stage 2, % | 50.6 ± 12.4 | 52.3 ± 12.3 | 1.6 (−4.6, 7.8) | .59 |
| Stage 3, % | 9.0 ± 7.1 | 10.1 ± 7.4 | 1.1 (−1.7, 4.0) | .43 |
| Stage REM, % | 14.2 ± 9.4 | 13.5 ± 5.4 | −0.7 (−3.7, 2.4) | .66 |
| Respiratory arousal index, /hour | 3.3 (1.05–3.3) | 6.3 (2.45–8.90) | N/A | .74 |
| Spontaneous arousal index, /hour | 28.2 (16.7–41.8) | 24.5 (17.2–32.8) | N/A | .74 |
| PLM arousal index, /hour | 0 (0–2.0) | 0 (0–1.8) | N/A | .53 |
| Total arousal index, events/hour | 31.2 (23.9–61.4) | 34.1 (18.8–42.1) | N/A | .64 |
| PLM index, events/hour | 0 (0–38.05) | 1.90 (0–16.75) | N/A | 0.21 |
Data are presented as median (interquartile range) or mean ± standard deviation.
CI, confidence interval; EPAP, expiratory positive airway pressure; iVAPS, intelligent volume-assured positive airway pressure support; N/A, not applicable; PLM, periodic leg movements; REM, rapid eye movement.
Comparison of Questionnaire Outcomes Between FixedEPAP and AutoEPAP iVAPS.
| Question | N | FixedEPAP | AutoEPAP | p-value |
|---|---|---|---|---|
| How easy/difficult was it to fall asleep? | 21 | 6 (3.5–8) | 6 (4–8) | .96 |
| How comfortable/uncomfortable was the therapy/device? | 22 | 7 (5–8) | 7 (5–8) | .89 |
| How much did the therapy disturb your sleep last night? | 22 | 5.5 (3–9) | 6 (4–8.5) | .30 |
| How refreshed did you feel this morning? | 20 | 6.5 (3–8.75) | 6 (5–8) | .65 |
Data are presented as median (interquartile range).
Scores on a Likert scale from 0 to 10 where higher scores indicate a greater satisfaction.
EPAP, expiratory positive airway pressure; iVAPS, intelligent volume-assured positive airway pressure support.
Post Hoc Analyses
Mean PS was lower during nights with FixedEPAP compared with AutoEPAP, and there was no difference in mean EPAP or IPAP between the FixedEPAP and AutoEPAP (Table 5). The 95th centile EPAP on the AutoEPAP night was higher than the FixedEPAP determined from laboratory titration (Table 5 and Supplementary Figure 1). Median device leak was similar, but 95th centile leak was higher during AutoEPAP versus FixedEPAP (p = .02) (Table 5). The median (IQR) number of sleep scientist interventions for ongoing excessive leak tended to be more frequent with FixedEPAP (1.0 [0–2.5]/night) compared with AutoEPAP (0 [0–1.5]/night, p = .06).
Device Download Data.
| Pressure | FixedEPAP (n = 25) | AutoEPAP (n = 25) | Mean (95% CI) for the difference | p-value |
|---|---|---|---|---|
| Mean EPAP, cmH2O | 11.8 ± 3.9 | 10.8 ± 2.0 | −0.9 (−2.2, 0.4) | .15 |
| Median EPAP, cmH2O | 11.8 ± 3 .9 | 10.9 ± 2.0 | −0.9 (−2.3, 0.5) | .20 |
| 95th centile EPAP, cmH2O | 11.8 ± 3.9 | 14.0 ± 2.1 | 2.2 (0.7, 3.6) | .006 |
| Mean IPAP, cmH2O | 20.1 ± 3.3 | 20.2 ± 3.1 | 0.1 (−1.0, 1.2) | .90 |
| Mean pressure support, cmH2O | 8.4 ± 1.9 | 9.4 ± 2.1 | 1.0 (0.1, 1.8) | .027 |
| Median leak, L/minute | 3.6 (0.6–4.8) | 4.8 (0 – 8.4) | N/A | .24 |
| 95th centile leak, L/minute | 16.8 (5.4–27) | 19.2 (12–38.4) | N/A | .022 |
| Median respiratory rate, bpm | 17.34 ± 4.42 | 17.39 ± 4.53 | 0.06 (−0.37, 0.48) | .8 |
| Median tidal volume, mL | 609 ± 179 | 638 ± 216 | 30 (−5, 62) | .09 |
Data are shown as mean ± standard deviation or median (interquartile range).
CI, confidence interval; EPAP, expiratory positive airway pressure; iVAPS, intelligent volume-assured positive airway pressure support; bpm, breaths per minute; mL, milliliters.
PSG data from the initial retitration night were compared with each of the EPAP iVAPS study nights, and no significant differences were found in sleep breathing or sleep quality outcomes (see Supplementary Tables 2 and 3).
There were no predictors of interindividual difference in AHI between the two modes. The difference in mean EPAP between the modes was an independent predictor of changes in oxygen desaturation indices and mean and time <90% oxygen saturation between the modes. Lower levels of median leak were associated with less time with oxygen saturation less than 90%, but lower 95th centile leak was associated with a higher 4% oxygen desaturation index (ODI4%; it is postulated that both these findings may be due to the associated lower mean EPAP levels). COPD versus non-COPD group was the only predictor of changes in the highest TcCO2 between modes and was a univariate predictor of changes in mean TcCO2 between modes (difference in mean EPAP was an independent predictor of difference in meanTcCO2) (see online supplement for further details).
DISCUSSION
The main finding of this study was that AutoEPAP was noninferior to a FixedEPAP mode for controlling OSA during iVAPS treatment for chronic hypoventilation, as assessed by the gold standard of laboratory PSG. The study included clinically stable patients on long-term NIV, and therefore, we initially performed attended PSG retitration studies using up-to-date recommendations12,13 and reviewed by at least two experienced sleep physicians in all cases to ensure that the FixedEPAP levels (and other settings) were optimized prior to comparison with the AutoEPAP algorithm. Control of OSA is important during NIV therapy because upper airway obstruction impairs alveolar ventilation and because residual OSA may be associated with sleep disruption, impaired daytime functioning, and potential long-term cardiovascular consequences.23 In general, the patients studied had severe OSA on their original diagnostic sleep studies as assessed by AHI, the primary metric of sleep-disordered breathing severity. When treated with iVAPS, OSA was usually well controlled during both treatment modes. Baseline demographics and pressure differences between the modes were not predictive of interindividual differences in AHI change between the modes.
Although, on average, there was no AHI difference between the AutoEPAP and FixedEPAP modes, there were a number of patients where there was a significant divergence between the two modes; six patients had an AHI that was more than five events different between the study nights. We did not find any predictors of the individual difference in response to AutoEPAP compared to FixedEPAP. However, bench studies indicate that in the presence of air leak Automatic PAP devices may underestimate the effective treatment pressure for patients with OSA.24 Two of the three patients whose AHI on the AutoEPAP night was greater than the FixedEPAP AHI by more than five events had the highest median leaks and the second and third highest 95th centile leaks during the Auto night studies. We performed a post hoc analysis on the association between AHI and leak in each mode separately; which suggests that leaks in the AutoEPAP mode might influence control of OSA, although direction of causality is uncertain. In particular, on the Auto nights, there was a positive association between median leak and AHI (r = 0.44, Adj r2=0.16, p = .026) and a trend to association between 95th centile leak and AHI (r = 0.37, Adj r2=0.10, p = .07). There were no such associations found on the FixedEPAP nights (median leak, p = .12, 95th centile leak, p = .33). Of note, three patients had an AutoEPAP AHI at least five events/hour less than their FixedEPAP night AHI. The explanation for this difference is not entirely clear, but there may be a significant advantage in a subgroup of patients using the AutoEPAP algorithm compared to the Fixed EPAP determined from a manual titration.
Scoring of all sleep studies was performed by a single experienced sleep technologist, avoiding the problem of interobserver variability in the assessments. Scoring was performed using standard criteria,19 and there was good reproducibility of AHI in the subgroup of scores that were checked by a second scorer. However, scoring of respiratory events was less reproducible than for CPAP studies,25 possibly due to the severity of comorbid diseases and impaired sleep quality among these patients, which made scoring more difficult.26
Intermittent oxygen desaturation during NIV treatment can occur due to leak6 or periodic breathing27 in addition to OSA. Nevertheless, ODIs provide objective information about the frequency of respiratory events. The fact that these were low and similar across both iVAPS modes provides additional support for the primary study finding. In addition, PSG sleep quality and self-reported comfort and sleep quality were similar between the iVAPS modes. However, during both iVAPS nights (and the retitration night), there was impaired sleep quality on PSG in these patients, specifically reduced sleep efficiency, reduced percent of stage 3 nonrapid eye movement sleep, and increased arousal index compared with normal values. This pattern is consistent with other studies of NIV treatment in stable patients with disorders of hypoventilation.6,28
Mean PS was higher during AutoEPAP compared with FixedEPAP mode. This may be because the AutoEPAP iVAPS algorithm responds to partial upper airway obstruction by increasing EPAP and, if necessary, PS (in order to maintain alveolar ventilation which may have been reduced by upper airway narrowing). Hence, the higher PS delivered in the Auto versus FixedEPAP mode, to attain similar control of OSA, may be due to a greater use of PS rather than EPAP (not different between the two modes) to open the upper airway.
Median leak was similar in the two groups, but the 95th centile leak was higher during the AutoEPAP compared with the FixedEPAP study night. There was, however, a trend to less frequent sleep technologist intervention for ongoing excessive leak on the AutoEPAP versus FixedEPAP nights, which may explain this higher 95th centile leak. Important sleep breathing and quality outcomes were the same on the two study nights despite the higher 95th centile leak and trend to less frequent mask adjustment for leak on the AutoEPAP night.
We found no differences in PSG sleep breathing and sleep quality outcomes during the retitration (PS) night compared with subsequent iVAPS nights. These data are not order randomized, and the initial PS data were obtained during an attended PSG titration. However, patients had only minor changes to their usual settings on the retitration night, and previous studies comparing patients on chronic PS support with VAPS therapy have either not retitrated (ie, not optimized) settings,29–35 have titrated by polygraphy rather than PS,36,37 or assessed using PSG but excluded patients with suboptimal chronic settings.18 While there is also a potential bias in favor of the PS mode because patients are established on PS therapy and our comparisons are with a novel mode of therapy (iVAPS), this limitation is common to all previous studies.18,29–37 Hence, we believe these data are relevant to and support existing data indicating that iVAPS has similar efficacy to standard fixed PS devices; including the control of CO2 during sleep.
Study strengths include a low risk of bias, with patients unaware of the device mode being used and analyses performed by individuals unaware of device mode. In addition, overnight sleep technologists and PSG scorer(s) were unaware of the study hypothesis, but pressure signals were not removed so that airflow and chest/abdominal movement due to device-delivered pressure pulses could be identified.
We did not analyze patterns of dysynchrony, autotriggering, or periodic breathing in this study. Although such changes are often observed during NIV and have been associated with impaired oxygenation27 and sleep quality,27,38 their clinical significance remains unclear. Furthermore, there is no consensus on the definitions and quantification of such events. We studied a heterogeneous but representative group of disorders treated for hypoventilation in specialist centers. However, we may have limited power to assess outcomes within disease groups. Nevertheless, post hoc analysis indicated that disease group was not a predictor of differential sleep breathing outcomes between individuals, except for mean and highest TcCO2. Those with COPD had lower TcCO2 compared with non-COPD patients on the AutoEPAP versus FixedEPAP nights. While aware of potential small carryover effects of chronic PAP on OSA control,39 for safety reasons we did not believe it was justified to accommodate this in such a vulnerable patient group, for example, by ceasing NIV for two to three nights prior to testing. Regardless, such carryover effects are likely to apply equally to both study arms. The current study does not demonstrate that Auto EPAP iVAPS can replace the recommended approach of manual EPAP titration in previously untreated patients. However, by demonstrating noninferiority of the new AutoEPAP algorithm in stable patients established on NIV, we believe there is now a reasonable basis for a future study to test the efficacy of AutoEPAP iVAPS treatment in naive patients, who may be either clinically stable or unstable.
CONCLUSIONS
A night of AutoEPAP iVAPS in clinically stable patients on long-term NIV for chronic hypoventilation was noninferior to a night of FixedEPAP iVAPS for control of OSA (AHI). Other PSG sleep breathing and sleep quality and self-reported sleep quality outcomes were similar between the two iVAPS modes. Further studies are required to assess clinically relevant outcomes during treatment using the different modes both in NIV-naïve patients and over longer treatment durations.
SUPPLEMENTARY MATERIAL
Supplementary material is available at SLEEP online.
FUNDING
This study was funded by ResMed Ltd (Bella Vista, Sydney, Australia). The sponsor had no role in the study data collection, data analysis, data interpretation, or decision to publish. The corresponding author had full access to all the data in the study and had final responsibility for the decision to submit for publication.
CLINICAL TRIAL REGISTRATION
This study was part of the clinical trial: Treating chronic hypoventilation with automatic adjustable versus fixed EPAP intelligent volume-assured positive airway pressure support (iVAPS); a randomized controlled trial; URL: www.clinicaltrials.gov; NCT02317042
DISCLOSURE STATEMENT
Nigel McArdle, David Hillman, Bhajan Singh, and Peter Eastwood received funding support from ResMed Ltd for this study. Nigel McArdle has received expenses for travel to a conference to present this research from ResMed Ltd. Dinesh Ramanan, Sahisha Ketheeswaran, Lisa Erikli, Jeff Armitstead, and Glenn Richards receive salary from and/or are shareholders of ResMed Ltd.
ACKNOWLEDGMENTS
The authors thank the patients who took part in this study.
The work was performed at the Centre for Sleep Science, School of Anatomy, Physiology and Human Biology, University of Western Australia, Nedlands, Australia and the West Australian Sleep Disorders Research Institute, Department of Pulmonary Physiology and Sleep Medicine, Sir Charles Gairdner.
REFERENCES


Comments