


Abstract
Context: Picky eating behavior is prevalent among toddlers and may negatively impact their growth and development. Objective: This article summarizes the correlates of picky eating and food neophobia in young children, which were identified using a socio-ecological framework. Data Sources: A literature search was conducted in 4 electronic databases. Study Selection: Inclusion criteria were English-language peer-reviewed publications that investigated correlate(s) of picky eating or food neophobia in children aged ≤30 months. Data Extraction: Correlates were categorized into 4 levels: cell, child, clan (family), and community/country. Thirty-two studies, which examined 89 correlates, were identified from the keyword searches of the databases and manual searches of the reference lists of included articles. Results: The most examined correlates were characteristics related to the child (sex, weight, and dietary intake) and parent (feeding beliefs and practices). A meta-analysis estimated the prevalence of picky eating to be 22%. Each additional month of a child’s age was associated with a 0.06 U increase in the Children’s Eating Behavior Questionnaire food fussiness score. Conclusion: This review highlights the importance of investigating child–parent dyads and bidirectional feeding interactions and draws attention to the lack of picky eating research at the level of the cell and the community/country.
INTRODUCTION
Picky eating is characterized by low dietary variety, unwillingness to eat either familiar or novel foods, and problematic interference with the parent–child relationship.1,2 These behaviors are prevalent in young children—up to one half of toddlers are reported to be picky eaters.3 One longitudinal study showed that the highest incidence of picky eating occurred in children 2 years of age.4 The first 2 years of life are critical in the development of healthy eating habits,5,6 and dietary patterns and food preferences established in early life continue in preschool, school-aged years, and young adulthood.7–9 During infancy and toddlerhood, children develop autonomy, an emerging sense of self (such as self-concept), social competence, and self-regulation.10 Aligning with these developmental changes is the ability to control positive and negative emotions11 and comply with caregivers’ requests.12 Feeding difficulties often emerge in young children as they acquire skills related to gross motor development and self-feeding and transition from a liquid-based diet to foods consumed by the family.5,13 Picky eating behavior may persist later in life,14–18 and additional research is needed to develop a better understanding of the early life factors contributing to picky eating behavior during the transition to an adult diet.
Picky eating can affect children’s nutrition intake and dietary quality and, as a consequence, negatively impact their growth and development.19,20 Studies have also shown associations between picky eating and risk of depression,21 eating disorders,15 and emotional and behavioral problems.22 Although picky eating behavior has been hypothesized to be related to genetic contributions23 and environmental factors,20,24 the developmental pathway of picky eating in early childhood is largely unknown.25 Moreover, the vast majority of research assessing picky eating behavior focuses on preschoolers (children aged 2–5 years), whereas much less attention has been paid to children aged ≤2 years. Unlike preschoolers, infants and toddlers are completely dependent on parents and caregivers to feed them and are learning how to eat through familiarization, observation, and associative learning.5 Previous reviews have addressed picky eating in terms of prevalence estimates, assessment methods, and relation to dietary intake, parent–child interactions, cognition, and social factors.26–28 Although these studies provide an extensive review of picky eating, the evidence on children aged ≤2 years of age and younger is still unclear. As best as could be determined, a systematic review and meta-analysis of the multilevel correlates of picky eating in this young child population has not previously been conducted.
The objective of this study was to systematically review existing scientific evidence of correlates of picky eating and food neophobia in children aged ≤2 years. The authors adopted a socioecological model as a theoretical framework to examine picky eating research.29 Correlates were classified into 4 broad categories—namely, cell (genetic and biological factors), child (individual characteristics of the child), clan (familial and parental factors), and community/country (factors outside of the home). Use of a socioecological framework to classify study findings into major categories allows for a better understanding of the context of picky eating behavior and highlights areas where additional research is warranted. Through the investigation of multidimensional factors of picky eating, this review also aids the development of evidence-based recommendations and interventions to promote healthy eating patterns and weight-gain trajectories in young children.
METHODS
Study selection criteria
Systematic review and meta-analysis procedures were conducted in accordance with the Cochrane Handbook for Systematic Reviews of Interventions and Preferred Reporting Items for Systematic Reviews and Meta-Analyses (see Table S1 in the Supporting Information online).30,31 The PICO (population, intervention, comparison, outcomes) framework (Table 1) was established a priori to formulate the systematic research question and to determine the inclusion and exclusion criteria for studies. Studies that met both of the following criteria were included in the review: (1) presented a quantitative analysis of at least 1 correlate of picky eating behavior or food neophobia in children aged ≤30 months and, (2) was published in English in a peer-reviewed publication. The age ceiling of 30 months rather than 24 months was imposed to retain studies that included a sample with children slightly older than 2 years. Some authors argue that children aged ≤12 months may be too young to exhibit a true reflection of picky eating.26 Because picky eating assessment is often based on parental perception26 and complementary feeding often begins in the first year of life,5 studies on children aged ≤12 months were included in this review. There were no restrictions on publication dates or type of study design. Longitudinal studies were included if the data presented in the article were consistent with the age limits (eg, if the study examined participants at aged 2 years and again at age 7 years, only baseline measurements at age 2 years were used). Articles were excluded from the review if they met any of the following criteria: not published in English; not peer reviewed (eg, dissertation or conference proceeding); review paper or case study; reported a study done exclusively on animals or adult subjects; or reported a study that evaluated only children with chronic diseases, developmental disability, autism spectrum disorder, or avoidant/restrictive food intake disorder. Although review papers were not eligible for inclusion, relevant review articles were obtained and their reference lists were searched for eligible articles and to compare findings. If multiple publications were available from the same data source or study population, only the study with the most complete or recent data was included to prevent duplication. If the studies contained different information, then both were included.
Criteria used to define the research question for the systematic review
| Criteria | Description |
|---|---|
| Population | Children aged ≤30 mo without chronic diseases, developmental disability, autism spectrum disorder, or avoidant/restrictive food intake disorder |
| Intervention | Any cross-sectional or experimental study examining a correlate of picky eating or food neophobia |
| Comparison | Not applicable |
| Outcome(s) | Picky eating, pickiness, fussy eating, choosy eating, faddy eating, food neophobia, food fussiness, or selective eating |
Search strategy
Keyword searches were performed in 4 electronic bibliographic databases: PubMed, PyscINFO, Cochrane Library, and Web of Science. The search algorithm included all possible combinations of keywords from the following 2 groups: (1) “child,” “toddler,” “infant,” “baby,” or “babies” and (2) “picky eating,” “pickiness,” “fussy eating,” “choosy eating,” “faddy eating,” “food neophobia,” “food fussiness,” or “selective eating.” Titles and abstracts of the articles identified through the keyword search were screened against the study selection criteria by a single author (N.C.). Disagreement about study eligibility was solved through discussion with the coauthors (R.A., S.L., and S.D.). Potentially relevant articles were retrieved for evaluation of the full text by a single author (N.C.).
A reference list search (ie, backward reference search) and cited reference search (ie, forward reference search) were conducted based on the full-text articles meeting the study selection criteria that were identified from the keyword search. Articles identified from the backward and forward reference searches were further screened and evaluated using the same study selection criteria. Reference searches were repeated on all newly identified articles until no additional relevant article was found. The last search was completed on July 13, 2016.
Data extraction
A standardized data extraction form was used to collect the following methodological and outcome variables from each included study: author(s), publication year, country of study, study design, sample size, age of subjects, measurement tool(s) for assessing picky eating, method of reporting picky eating (ie, maternal report, parent report, etc.), prevalence of picky eating or food neophobia, specific picky eating behavior(s) of interest, and result(s) on the relationship of correlate(s) to picky eating. Data from included studies were extracted by one author (N.C.) and verified by a second author (R.A.). If there were missing data, then the corresponding author was contacted. Analysis included a narrative review of the correlates classified into 4 levels: cell, child, clan, and community/country. Food neophobia is often considered a subset of picky eating, and corresponding behaviors are frequently measured as 2 separate constructs because there is no clear distinction between them.28,32 Given that studies examining both picky eating and food neophobia were included in this review, the term picky eating is used when discussing overall findings, but food neophobia is specified when it was specifically measured.
Quantitative data synthesis
Meta-analysis was conducted to estimate (1) the prevalence of picky eating based on 5 studies that adopted a dichotomous definition for picky eating (ie, picky or not) and (2) the degree of picky eating based on 6 studies that adopted a continuous measure of picky eating—namely, the food fussiness subscale in the Children’s Eating Behavior Questionnaire (CEBQ). Due to data availability and measurement heterogeneity, additional meta-analyses could not be conducted on other covariates of picky eating such as sex, weight, and diet. Study heterogeneity was assessed using the I2 index. A random-effect model was estimated given an I2 statistic at or above 50%; otherwise, a fixed-effect model was estimated. Publication bias was assessed by visual inspection of the funnel plot and Begg’s and Egger’s tests. Meta-regression was performed to assess the relationship between the mean age of the study sample and the CEBQ food fussiness score. All statistical analyses were conducted using Stata 14.1 SE version (StataCorp, College Station, TX, USA). Statistical significance was set to P < 0.05.
Study quality assessment
The quality of included studies was assessed using the following 6 criteria based on quality assessment scales from the Methods Guide for Effectiveness and Comparative Effectiveness Reviews developed by the Agency for Healthcare Research and Quality;33 the National Heart, Lung, and Blood Institute;34 and methods previously used35: (1) a priori aim/hypothesis specific to picky eating behaviors; (2) study population clearly specified and defined; (3) study design; (4) sample size; (5) reliable and valid measure of picky eating behavior; and (6) well-validated measure of correlate(s). Scores for each criterion range 0–2 depending on whether the criterion was unmentioned or unmet (0), partially met (1), or completely met (2). For the a priori aim/hypothesis criteria, studies that explicitly stated picky eating behaviors were given a score of 2, studies that implied picky eating (eg, eating difficulties) were given a score of 1, and studies that did not indicate an aim/hypothesis specific to picky eating were given a score of 0. For study design, randomized controlled trials (RCTs) were given a score of 2, cohort studies were given a score of 1, and cross-sectional studies were given a score of 0. For sample size, study samples of ≥1000 were given a score of 2, samples of 100–999 were given a score of 1, and samples of <100 were given a score of 0. A total quality score ranging 0–12 was obtained for each study by summing the scores of each criterion. The overall study quality score helped measure the strength of the study evidence but was not used to determine the inclusion of studies in the review.
RESULTS
Study selection
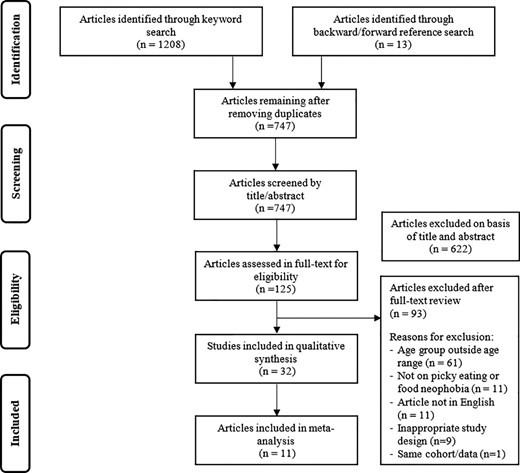
Figure 1 shows the flowchart of the study selection process and the reasons for exclusion. A total of 747 unduplicated articles were identified through keyword and reference searches, from which 622 were excluded in the title/abstract screening. The remaining 125 articles were reviewed in full text against the study selection criteria. Of these, 32 articles met the inclusion criteria and were included in the review.
Study selection flowchart.
Basic characteristics of the included studies
Table 2 summarizes the basic characteristics of the 32 articles included in the review. More than half of the studies (n = 22) were published from 2010 onward.36–57 Regarding study location, 20 were conducted in Europe (United Kingdom40,44,46,47,53–55,58–60; France39,49,50,57; Ireland48,61,62; Netherlands41,45; Sweden36); 5 studies were conducted in Australia38,42,43,51,56; 4 were conducted in the United States3,63–65; 1 was conducted in China37; 1 was conducted in Singapore52; and 1 was conducted in Canada.66 In terms of study design, 20 studies were cross-sectional3,37–40,43,46–49,51,54,55,58,60–65; 11 were longitudinal studies36,41,42,44,45,50,52,53,57,59,66; and 1 was an RCT.56 The sample sizes ranged from a small-scale preliminary study (n = 18)58 to a large longitudinal cohort (n = 9599).40 Five studies had a sample size of <100 participants36,41,58,61,62; 15 studies had a sample size of 100–99937–39,42–44,47,49,51,52,54,56,60,65,66; and 12 studies had a sample size >1000.3,40,45,46,48,50,53,55,57,59,63,64 The majority of studies (n = 24) included children during the transitional 12–24-month feeding period. However, some studies also included children aged <12 months3,63,64,66 or >24 months.43,47,54,60,65 In addition, 3 studies compared children who had been delivered preterm with those born full-term.39,55,66
Basic characteristics of the studies examining correlates of picky eating and food neophobia among young children
| Reference | Country | Study design | Sample size | Age, mo | Measure of PE or FN | Method of reporting PE or FN | Prevalence of PE or FN | Specific behavior of interest |
|---|---|---|---|---|---|---|---|---|
| Barends et al. (2014)41 | Netherlands | Longitudinal | 81 | 12–23 | Single questions | Maternal | NR | Picky eating, low food neophobiaa |
| Blossfeld et al. (2007)61 | Ireland | Cross-sectional | 53 | 18 | Children’s Eating Behavior Questionnaire | Maternal | NR | Food fussiness |
| Blossfeld et al. (2007)62 | Ireland | Cross-sectional | 70 | 12 | Picky eating questionnaire; Children’s Eating Behavior Questionnaire | Maternal | NR | Picky eating, low food neophobiaa; food fussiness |
| Briefel et al. (2006)63 | United States | Cross-sectional | 3022 | 4–24 | Single question | Parent or primary caregiver | NR | Picky eating |
| Brown and Lee (2015)44 | United Kingdom | Longitudinal | 298 | 18–24 | Children’s Eating Behavior Questionnaire | Maternal | NR | Food fussiness |
| Cao et al. (2012)37 | China | Cross-sectional | 219 | 12–18 | Children’s Eating Behavior Questionnaire | Parent or grandparent | NR | Food fussiness |
| Cardona Cano et al. (2015)45 | Netherlands | Longitudinal | 3618 | 18 | Child Behavior Checklist (2 items) | Maternal | 26.5% | Picky eating |
| Carruth et al. (2004)3 | United States | Cross-sectional | 3022 | 4–24 | Single question | Parent or primary caregiver | 30.5% | Picky eating |
| Cassells et al. (2014)42 | Australia | Longitudinal | 244 | 24 | Child Food Neophobia Scale | Maternal | NR | Food neophobia |
| Fildes et al. (2015)46 | United Kingdom | Cross-sectional | 1044 | 16 | Children’s Eating Behavior Questionnaire | Parent | NR | Food fussiness |
| Fletcher et al. (2016)54 | United Kingdom | Cross-sectional | 456 | 30 | Single question | Maternal | NR | Food neophobia |
| Hendricks et al. (2006)64 | United States | Cross-sectional | 2515 | 4–24 | Single question | Parent or primary caregiver | 42.2%b | Picky eating |
| Howard et al. (2012)38 | Australia | Cross-sectional | 245 | 24 | Child Food Neophobia Scale | Maternal | NR | Food neophobia |
| Jansen et al. (2014)43 | Australia | Cross-sectional | 462 | 21–27 | Children’s Eating Behavior Questionnaire | Maternal | NR | Food fussiness |
| Johnson and Harris (2004)58 | United Kingdom | Cross-sectional | 18 | 15–21 | CCTI Reaction to Food scale | Maternal | NR | Food neophobia |
| Johnson et al. (2016)55 | United Kingdom | Cross-sectional | 1387 | 24c | Eating behavior questionnaire | Parent | NR | Picky eating/refusal |
| Magarey et al. (2016)56 | Australia | RCT (midline data) | 698 | 24 | Children’s Eating Behavior Questionnaire | Maternal | NR | Food fussiness |
| Maslin et al. (2015)47 | United Kingdom | Cross-sectional | 126 | 8–30 | Picky eating questionnaire | Maternal | NR | Fussy eating |
| McCarthy et al. (2015)48 | Ireland | Cross-sectional | 1189 | 24 | Children’s Eating Behavior Questionnaire | Maternal | NR | Food fussiness |
| Migraine et al. (2013)39 | France | Cross-sectional | 479 | 24c | Children’s Eating Difficulties Questionnaire | Maternal | NR | Low food variety (picky eating + food neophobia) |
| Monnery-Patris et al. (2015)49 | France | Cross-sectional | 123 | 20–22 | Children’s Eating Difficulties Questionnaire | Maternal | NR | Food neophobia |
| Northstone and Emmett (2013)40 | United Kingdom | Cross-sectional | 9599 | 24 | Single question | Maternal | 9.8% | Choosy (picky) eating |
| Northstone et al. (2001)59 | United Kingdom | Longitudinal | 9360 | 15 | Single question | Maternal | NR | Choosy (picky) eating |
| Oliveira et al. (2015)50 | France | Longitudinal | 1077 | 24 | Study-specific questions | Maternal | NR | Food neophobia |
| Perry et al. (2015)51 | Australia | Cross-sectional | 330 | 24 | Child Food Neophobia Scale | Maternal | NR | Food neophobia |
| Quah et al. (2015)52 | Singapore | Longitudinal | 210 | 12–24 | Children’s Eating Behavior Questionnaire | Maternal | NR | Food fussiness/enjoyment of food |
| Reau et al. (1996)65 | United States | Cross-sectional | 151 | 13–27 | Single question | Parent | 36% | Picky eating |
| Sauve et al. (1991)66 | Canada | Longitudinal | 232 | 4–24c | Parent interviewd | Parent | 7.3%e | Fussy eating |
| Svensson et al. (2011)36 | Sweden | Longitudinal | 55 | 12–24 | Children’s Eating Behavior Questionnaire | Parent | NR | Food fussiness |
| Syrad et al. (2015)53 | United Kingdom | Longitudinal | 1897 | 16 | Children’s Eating Behavior Questionnaire | Parent | NR | Food fussiness |
| Wright et al. (2007)60 | United Kingdom | Cross-sectional | 455 | 30 | Single question | Parent | 8.2% | Faddy (picky) eating |
| Yuan et al. (2016)57 | France | Longitudinal | 1142 | 12–24 | Study-specific questions | Maternal | NR | Food neophobia |
Abbreviations: CCTI, Colorado Childhood Temperament Inventory; FN, food neophobia; NR, not reported; PE, picky eating; RCT, randomized controlled trial.
aStudy measured openness/willingness to new foods (low food neophobia).
bBased on data from the same cohort as Carruth et al. (2004)3 but using a smaller sample size. Thus, only Carruth et al. (2004)3 was included in the meta-analysis to avoid duplication.
cCorrected age (study included children who were born preterm).
dFeeding problem was considered as present only if it was a major concern to parents or if it led to therapy or investigation.
eNot based on frequency response or dichotomization, thus not included in meta-analysis.
Of the 32 studies included in the review, 21 examined picky eating (ie, food fussiness, choosy eating, faddy eating, and fussy eating)3,36,37,40,43–48,52,53,55,56,59–61,63–66; 8 examined food neophobia38,42,49–51,54,57,58; and 3 investigated both picky eating and food neophobia.39,41,62 A variety of methods were used to assess picky eating and food neophobia, yet all studies relied on caregiver report (primarily the mother). There were 9 studies that used a single question (eg, “Is your child a picky eater?”)3,40,41,54,59,60,63–65 and 2 studies that used study-specific questions.50,57 The majority of studies (n = 20) used existing questionnaires, including the Picky Eating Questionnaire47,62; Eating Behavior Questionnaire55; CEBQ36,37,43,44,46,48,52,53,56,61,62; Child Food Neophobia Scale (CFNS)38,42,51; Children’s Eating Difficulties Questionnaire39,49; Child Behavior Checklist45; and the Reaction to Food scale from the Colorado Childhood Temperament Inventory (CCTI).58 The most commonly used questionnaire was the CEBQ (n = 11), which contains a food fussiness subscale that assesses picky eating behavior in children. Of the studies that examined food neophobia, the most commonly used tool was the CFNS (n = 3), which assesses a child’s willingness to try new foods.
Although the majority of studies used continuous measures of picky eating, several studies shared similar response categories for the frequency of picky eating (ie, Likert scales that were typically anchored by “never,” “sometimes”, and “always”) and dichotomized picky eating by combining responses of “sometimes” and “always” to be picky eaters and “never” and “rarely” to be nonpicky eaters. Of the 24 studies that investigated picky eating, 6 reported prevalence estimates of picky eating with sample sizes based on frequency responses and dichotomization.3,40,45,60,64,65 As shown in Table 2, prevalence estimates ranged 7%–36% for children aged 4–30 months.
Correlates of picky eating behaviors
A total of 89 correlates classified into 4 levels (ie, cell, child, clan, and community/country) were assessed, with the majority (n = 21) of studies assessing 1–4 correlates,36,40,41,46,48–59,61–63,65,66 and the remaining 11 assessing ≥5 correlates.3,37–39,42–45,47,60,64Table 3 reports a summary of the associations between potential correlates of picky eating and food neophobia.
Correlates of picky eating and food neophobia in young children
| Correlate | Association with PE or FNa | ||
|---|---|---|---|
| Positive | Negative | None | |
| Cell: genetic and biological contributions | |||
| In utero factors | |||
| Born preterm | Johnson et al. (2016)55 | Migraine et al. (2013)39 (PFN) | |
| Gestational age | Migraine et al. (2013)39 (PFN) | ||
| Medical issues | |||
| Child has an allergy | Hendricks et al. (2006)64 | ||
| Child has a long-term medical problem | Hendricks et al. (2006)64 | ||
| Illness (diarrhea, constipation, vomiting) | Johnson and Harris (2004)58 (FN) | ||
| Oral-motor-skill function | Johnson and Harris (2004)58 (FN) | ||
| Child: characteristics of the child | |||
| Demographics | |||
| Age | Barends et al. (2014)41 (PFN); Carruth et al. (2004)3; Svensson et al. (2011)36 | Cassells et al. (2014)42 (FN); Maslin et al. (2015)47 | |
| Birth order | Carruth et al. (2004)3,b | ||
| Sex | Cao et al. (2012)37 (girls) | Cardona Cano et al. (2015)45; Carruth et al. (2004)3,b; Cassells et al. (2014)42 (FN); Johnson et al. (2016)55; Maslin et al. (2015)47; Migraine et al. (2013)39 (PFN); Monnery-Patris et al. (2015)49 (FN) | |
| Race/ethnicity | Carruth et al. (2004)3b | ||
| Anthropometrics | |||
| Birth weight | Cassells et al. (2014)42 (FN); Hendricks et al. (2006)64; Migraine et al. (2013)39 (PFN); Oliveira et al. (2015)50 (FN) | ||
| Current weight | Brown and Lee (2015)44; Carruth et al. (2004)3; McCarthy et al. (2015)48 | Cao et al. (2012)37; Cassells et al. (2014)42 (FN); Perry et al. (2015)51 (FN); Quah et al. (2015)52; Sauve et al. (1991)66; Wright et al. (2007)60 | |
| Height | Wright et al. (2007)60 | ||
| Weight gain | Quah et al. (2015)52; Wright et al. (2007)60 | ||
| Behavior and food preferences | |||
| Smell differential reactivity | Monnery-Patris et al. (2015)49 (FN) | ||
| Taste differential reactivity | Monnery-Patris et al. (2015)49 (FN) | ||
| Appetite | Wright et al. (2007)60 | ||
| Enjoyment of food | Fildes et al. (2015)46 | ||
| Food responsiveness | Cao et al. (2012)37; Fildes et al. (2015)46 | ||
| Emotional overeating | Cao et al. (2012)37 | ||
| Desire to drink | Cao et al. (2012)37 | ||
| Satiety responsiveness | Fildes et al. (2015)46 | ||
| Slowness in eating/feeding time | Cao et al. (2012)37; Fildes et al. (2015)46; Reau et al. (1996)65 | ||
| Emotional undereating | Cao et al. (2012)37 | ||
| Temperament (difficultness) | Cassells et al. (2014)42 (FN) | ||
| Sour taste acceptance | Blossfeld et al. (2007)61 | ||
| Number of foods liked | Wright et al. (2007)60 | ||
| Fruit liking | Fletcher et al. (2016)54 (FN); Howard et al. (2012)38 (FN) | ||
| Vegetable liking | Fletcher et al. (2016)54 (FN); Howard et al. (2012)38 (FN) | ||
| Discretionary foods liking | Howard et al. (2012)38 (FN) | ||
| Dietary intake | |||
| Dietary intake patterns | Northstone and Emmett (2013)40 | ||
| Number of foods tried | Cardona Cano et al. (2015)45; Wright et al. (2007)60 | ||
| Energy/caloric intake | Cardona Cano et al. (2015)45; Carruth et al. (2004)3 | Sauve et al. (1991)66 | |
| Micronutrient intake | Carruth et al. (2004)3 | ||
| Vitamin/mineral supplement use | Briefel et al. (2006)63 | ||
| Complex texture intake | Blossfeld et al. (2007)62 (PFN) | ||
| Refined grain intake | Cardona Cano et al. (2015)45 | ||
| Whole grain intake | Cardona Cano et al. (2015)45 | ||
| Rice/pasta intake | Cardona Cano et al. (2015)45 | ||
| Dairy intake | Cardona Cano et al. (2015)45 | ||
| Fruit intake | Fletcher et al. (2016)54 (FN); Perry et al. (2015)51 (FN) | Barends et al. (2014)41 (PFN); Cardona Cano et al. (2015)45; Howard et al. (2012)38 (FN) | |
| Vegetable intake | Barends et al. (2014)41 (PFN); Cardona Cano et al. (2015)45; Fletcher et al. (2016)54 (FN); Howard et al. (2012)38 (FN); Perry et al. (2015)51 (FN) | ||
| Meat intake | Cardona Cano et al. (2015)45 | ||
| Fish intake | Cardona Cano et al. (2015)45 | ||
| Composite dishes intake | Cardona Cano et al. (2015)45 | ||
| Discretionary foods intake | Perry et al. (2015)51 (FN) | Cardona Cano et al. (2015)45 (sweets) | Cardona Cano et al. (2015)45 (savory); Howard et al. (2012)38 (FN) |
| Clan: parent characteristics and family dynamics | |||
| Demographics | |||
| Maternal age | Cassells et al. (2014)42 (FN) | Hendricks et al. (2006)64; Migraine et al. (2013)39 (PFN) | |
| Maternal race/ethnicity | Hendricks et al. (2006)64 | ||
| Number of children in household aged <18 y | Hendricks et al. (2006)64 | ||
| Marital status | Carruth et al. (2004)3,b | ||
| Employment status/mother currently working | Carruth et al. (2004)3,b | ||
| Maternal education | Migraine et al. (2013)39 (PFN) | Carruth et al. (2004)3,b; Cassells et al. (2014)42 (FN) | |
| Household income | Carruth et al. (2004)3,b | ||
| Diet and health | |||
| % total fruits disliked by mother | Cassells et al. (2014)42 (FN) | ||
| % total vegetables disliked by mother | Cassells et al. (2014)42 (FN) | ||
| % total other foods disliked by mother | Cassells et al. (2014)42 (FN) | ||
| Having an overweight or obese parent | Cao et al. (2012)37 | ||
| Maternal weight | Cassells et al. (2014)42 (FN); Migraine et al. (2013)39 (PFN) | ||
| Maternal food allergy history | Maslin et al. (2015)47 | ||
| Early feeding characteristics | |||
| Ever breastfed | Carruth et al. (2004)3,b; Maslin et al. (2015)47; Migraine et al. (2013)39 (PFN) | ||
| Breastfeeding duration | Brown and Lee (2015)44 | Cassells et al. (2014)42 (FN) | |
| Mode of feeding (breast fed, formula fed, both) | Cassells et al. (2014)42 (FN) | ||
| Formula intake | Cardona Cano et al. (2015)45 | ||
| Extended formula feeding | Syrad et al. (2015)53 | ||
| Cow’s milk exclusion (for allergy) | Maslin et al. (2015)47 | ||
| Age first given solids | Northstone et al. (2001)59 (>10 mo) | Brown and Lee (2015)44; Northstone et al. (2001)59 (<6 mo) | Cassells et al. (2014)42 (FN) |
| Baby-led weaning | Brown and Lee (2015)44 | ||
| Long breastfeeding, later main meal food introduction, and use of homemade foods | Yuan et al. (2016)57 (FN) | ||
| Later introduction of dairy products and use of ready-prepared baby foods | Yuan et al. (2016)57 (FN) | ||
| Use of ready-prepared adult foods | Yuan et al. (2016)57 (FN) | ||
| Feeding beliefs and practices | |||
| Offers new food before deciding child dislikes it | Carruth et al. (2004)3 | ||
| Covert restriction | Jansen et al. (2014)43 | ||
| Mealtime negativity | Johnson and Harris (2004)58 (FN) | ||
| Concern about infant undereating/underweight | Brown and Lee (2015)44; Cassells et al. (2014)42 (FN) | ||
| Positive practices/responsive feeding | |||
| Awareness of infant hunger/satiety cues | Cassells et al. (2014)42 (FN) | ||
| Monitoring | Brown and Lee (2015)44 | ||
| Structured meal setting | Jansen et al. (2014)43 | ||
| Structured meal timing | Jansen et al. (2014)43 | ||
| Family meal setting | Jansen et al. (2014)43 | ||
| Negative practices/ nonresponsive feeding | |||
| Distrust in child’s appetite | Jansen et al. (2014)43 | ||
| Overt restriction | Brown and Lee (2015)44; Cassells et al. (2014)42 (FN); Jansen et al. (2014)43 | ||
| Pressure to eat/persuasive feeding | Cassells et al. (2014)42 (FN); Jansen et al. (2014)43 | Brown and Lee (2015)44 | |
| Reward for eating | Jansen et al. (2014)43 | ||
| Reward for behavior | Jansen et al. (2014)43 | ||
| Community/country: access to food/social influences | |||
| Guidance on protective feeding practices | Magarey et al. (2016)56 | ||
| Region of residence (Northeast, Midwest, South, West) | Hendricks et al. (2006)64 | ||
| Residence (urban, suburban, rural) | Carruth et al. (2004)3,b | ||
| Child is a WIC recipient | Hendricks et al. (2006)64 | ||
| Child is in childcare | Hendricks et al. (2006)64 | ||
Abbreviations: FN, food neophobia; PE, picky eating; PFN, both picky eating and food neophobia; WIC, Women, Infants and Children (Special Supplemental Nutrition Program).
aAssociations are for picky eating unless otherwise specified.
Cell: genetic and biological contributions
Four studies investigated genetic and biological correlates, such as in utero factors (being born preterm and gestational age) and medical issues.39,55,58,64 Evidence for picky eating and being born preterm was mixed in cross-sectional studies. One study found a positive association between being born preterm and picky eating,55 but another found no association.39 One cross-sectional study found no association between gestational age at birth and picky eating.39 Two cross-sectional studies examined the association between child medical issues and picky eating behaviors.58,64 Illness during late infancy (ie, vomiting, diarrhea, or constipation) was positively associated with food neophobia.58 There was no association between picky eating and the child’s reported allergies,64 long-term medical problems,64 or oral-motor-skill function.58
Child: personal characteristics
Demographics.
Eleven studies investigated demographic correlates related to the child.3,36,37,39,41,42,45,47,49,55,64 The findings on picky eating in relation to age were mixed for both longitudinal and cross-sectional studies. Age was found to be positively associated with picky eating in 3 studies,3,36,41 but 2 studies found no association.42,47 Nine studies investigated the association between sex and picky eating; 2 were longitudinal studies,42,45 and 2 studies included children aged <12 months.3,47 Null findings were reported in general for the association between sex and picky eating; however, 1 cross-sectional study found a positive association among girls.37 There was no relationship between picky eating and birth order3 or child race/ethnicity.3
Anthropometrics.
Twelve studies examined the association between anthropometric measurements and picky eating behaviors.3,37,39,42,44,48,50–52,60,66 There was no association between birth weight and picky eating in cross-sectional39,64 or longitudinal studies.42,50 However, the evidence for current weight was mixed for both longitudinal and cross-sectional studies. Three studies found a negative association between current weight and picky eating,3,44,48 and 6 studies found no association.37,42,51,52,60,66 There was no association between picky eating and the child’s height60 or weight gain.52,60
Behavior and food preferences.
Nine studies investigated 16 correlates related to child behavior and food preferences.37,38,42,46,49,54,60,61,65 Picky eating was associated with lower appetite,60 enjoyment of food,46 food responsiveness,37,46 and desire to drink.37 One study found a positive association between differential reactivity to smell stimuli and food neophobia but no association between differential reactivity to taste stimuli and food neophobia.49 Picky eating was associated with higher satiety responsiveness,46 longer feeding time,37,46,65 and liking fewer foods,60 such as fruits and vegetables.38,54 There was no association between picky eating and emotional overeating or undereating,37 temperament (difficultness),42 sour taste acceptance,61 or liking of discretionary foods.38
Dietary intake.
Eleven studies investigated a total of 16 correlates related to the child’s dietary intake.3,38,40,41,45,51,54,60,62,63,66 One cross-sectional study found that picky eating was associated with consuming a smaller variety of foods regardless of the child’s dietary intake pattern.40 Another cross-sectional study found that intake of complex food textures (specifically, chopped carrots) was associated with lower food neophobia, pickiness, and food fussiness.62 In general, studies found that picky eating was associated with trying fewer foods in general45,60 and having lower intake of foods such as whole grains,45 rice/pasta,45 meat,45 fish,45 and vegetables.38,41,45,51,54 Evidence for fruit and discretionary food intake (ie, salty snacks and sweets) was mixed. Two cross-sectional studies found a negative association between food neophobia and fruit intake,51,54 but 3 studies found no association.38,41,45 One study found a positive association between food neophobia and discretionary food intake,51 whereas another study found a negative association between sweet intake and picky eating but no association with savory snack intake.45 There was no association between picky eating and intake of refined grains, dairy, or composite dishes.45 Evidence for energy intake was mixed. Two studies found that picky eating was associated with lower caloric intake,3,45 and 1 longitudinal study found no association.66 One cross-sectional study found that picky eating was associated with lower micronutrient intake.3 Interestingly, 1 study found that picky eating was positively associated with the child’s intake of vitamin and mineral supplements.63
Clan: parent characteristics and family dynamics
Demographics.
Four studies investigated demographic correlates in the family.3,39,42,64 Maternal education was the most frequently used proxy for socioeconomic status. Null findings were reported in general for the association between socioeconomic status and picky eating; however, 1 study found that maternal education beyond high school was associated with lower risk of picky eating behavior.39 In terms of maternal age, 1 longitudinal study found an association between higher maternal age at delivery and child food neophobia,42 and 2 cross-sectional studies found no association.39,64 Only 1 study investigated parent race/ethnicity and found no association with picky eating.64 There was no association between picky eating and the number of children.3 However, there was a negative association between picky eating and the number of children in the household aged <18 years.64
Parent diet and health.
Four studies investigated characteristics of caregiver’s diet and health.37,39,42,47 Null findings were reported for the association between parental weight and picky eating.37,39,42 Only 1 study investigated maternal diet, and it found a positive association between child food neophobia and the percentage of fruits and vegetables disliked by the mother.42 There was no association between picky eating and percentage of other foods disliked by the mother42 or maternal food allergy history.47
Early feeding characteristics.
Nine studies examined 11 correlates related to feeding characteristics during infancy.3,39,42,44,45,47,53,57,59 There were null findings for cross-sectional associations between ever-breastfed status and picky eating.3,39,47 The evidence for picky eating and breastfeeding duration was mixed. One longitudinal study found a negative association with food fussiness,44 whereas another longitudinal study found no association with food neophobia.42 There was no association between food neophobia and long breastfeeding or later introduction of main meal food,57 nor between picky eating and formula intake45 or mode of feeding.42 One longitudinal study found that food fussiness in children at 16 months was positively associated with extended formula feeding at 21 months.53 Picky eating was positively associated with excluding cow’s milk for presumed cow’s milk allergy.47 One study found that baby-led weaning (emphasis on infant self-feeding whole foods rather than parent spoon-feeding pureed foods) was negatively associated with picky eating.44 Three longitudinal studies investigated child’s age when first given solids and picky eating with mixed results.42,44,59 One study found that introducing complementary foods at an earlier age was positively associated with fussy eating.44 However, another study found that introducing solids before age 6 months was associated with fewer picky eating behaviors at 15 months and introducing solids at age 10 months or later was associated with more picky eating behaviors.59 Another study found no association between the age a child was first given solids and food neophobia.42 One longitudinal study found that food neophobia at 1 year was positively associated with later introduction of dairy products and use of ready-prepared baby foods and the use of ready-prepared adult foods.57
Feeding beliefs and practices.
Five studies investigated 14 correlates related to parental feeding beliefs and practices.3,42–44,58 In general, both cross-sectional and longitudinal studies used continuous measures of picky eating or food neophobia (ie, CEBQ food fussiness subscale and CFNS). Picky eating was positively associated with mealtime negativity58 and maternal concern about infant undereating and becoming underweight.42,44 Positive feeding practices, often termed “responsive feeding,” are child-centered in nature and facilitate the development of the child’s recognition of their hunger and satiety cues.67 There was an inverse relationship between picky eating and positive feeding practices, specifically maternal awareness of infant hunger and satiety cues,42 monitoring (the extent to which parents oversee their child’s eating),44 and setting structured family meals.43 Negative feeding practices, termed “nonresponsive feeding,” are parent-centered in nature and hinder the development of the child’s recognition of their hunger and satiety cues.43,67 There was a positive relationship between picky eating and negative feeding practices, particularly distrust in the child’s appetite,43 overt restriction,42–44 and rewarding the child for eating or good behavior.43 Two studies found a positive association between pressure to eat/persuasive feeding,42,43 but 1 study found no association.44 There was no association between picky eating and covert restriction or structured meal timing3 or how many times caregivers offered a new food before deciding the child disliked it.3 Overt restriction refers to restriction that the child can see and is aware of, whereas covert restriction refers to restriction that the child cannot see and is not aware of.43
Community/country: access to food, social influences
Three studies investigated factors in the community and country level.3,56,64 The single RCT included in the review found no association between providing guidance on protective feeding practices and picky eating 6 months later.56 There was no association between picky eating and region of residence (Northwest, Midwest, South, West)64 or settlement (urban, suburban, rural).3 One cross-sectional study found a negative association between children receiving the Special Supplemental Nutrition Program for Women, Infants, and Children (WIC) and picky eating.64 There was no association between the child being in childcare and picky eating.64
Meta-analysis of picky eating correlates
Figures 2 and 3 show the forest plots from the meta-analysis. The estimated prevalence of picky eating in children aged 4–30 months from the meta-analysis is 22.0% (95%CI, 11.5%–32.5%; I2, 99.5%; random-effects model) based on 5 studies that reported a dichotomous definition for picky eating.3,40,45,60,65 The degree of picky eating estimated in meta-analysis is 2.51 (95%CI, 2.42–2.59; I2, 99.6%; random-effects model) on a scale ranging from 1 (never food fussy) to 5 (always food fussy) based on 6 studies that used the CEBQ food fussiness subscale.36,44,46,53,56,62 There was no indication of publication bias from either the Begg’s test with continuity correction (P = 0.47) or the Egger’s test (P = 0.74). Meta-regression found that among children aged 12–24 months, each additional month older was associated with an increase in the CEBQ food fussiness score by 0.06 units (95%CI, 0.01–0.11; random-effects model).
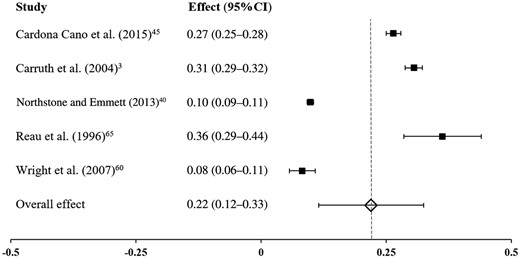
Forest plot of the prevalence of picky eating from meta-analysis (random-effects model). Based on a dichotomous definition for picky eating, the estimated prevalence of picky eating in children aged 4–30 months was 22.0%. Final row indicates overall effect size estimate. Abbreviation: CI, confidence interval.
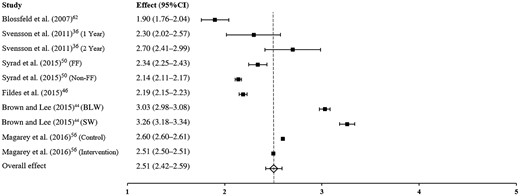
Forest plot of the degree of picky eating from meta-analysis (random effects model). Based on the Children’s Eating Behavior Questionnaire, the degree of food fussiness was 2.51 on a scale of 1–5 (1, never; 5, always). Final row indicates overall effect size estimate. Abbreviations: BLW, baby-led weaning group; CEBQ, Child Eating Behavior Questionnaire; CI, confidence interval; FF, formula feeding; SW, standard weaning group.
Study quality
Table 4 reports the overall results of the study quality assessment for the 32 studies included in the review. On average, studies scored 8.09 out of 12 (range, 5–11). The large majority of studies (84%) clearly specified and defined the study population.36–46,48–62,66 However, aims/hypotheses were more variable, and only 13 studies (41%) explicitly stated picky eating or food neophobia in the objective or hypothesis.3,38,42,45–47,49,51,54,56–58,61 Five studies (16%) were longitudinal with sample sizes of >1000 participants.45,50,53,57,59 More than half of the studies used reliable and valid measures for both picky eating and other investigated correlates.36–39,42,43,45,46,48–52,55,58,61,62
Study quality assessment
| Criterion of study qualitya | Mean (SD) |
|---|---|
| 1. A priori aim/hypothesis | 1.28 (0.68) |
| 2. Study population clearly specified and defined | 1.84 (0.37) |
| 3. Study design | 0.41 (0.56) |
| 4. Sample size | 1.22 (0.71) |
| 5. Measure of picky eating is reliable and valid | 1.66 (0.55) |
| 6. Measures of correlates are well-validated | 1.69 (0.47) |
| Total study quality score by summing items 1–6 | 8.09 (1.47) |
aScores for each criterion range 0–2, depending on whether the criterion was unmentioned or unmet (0), partially met (1), or completely met (2). The total score for all 6 criteria for each study was in the range of 0–12.
DISCUSSION
This study systematically reviewed existing evidence on the correlates of picky eating behavior among young children. In the 32 included studies, the most examined correlates were characteristics of the child, specifically the child’s sex, current weight, and dietary intake. Characteristics of the parents were also extensively examined, particularly early feeding characteristics and feeding beliefs and practices. These findings are similar to those of previous reviews on picky eating that included older children, in which associations were primarily related to the child’s weight status,68 dietary intake,26 and social influences.28 However, unlike previous reviews, this study identified associations related to biological contributions and access to food. From meta-analysis, the prevalence of picky eating was 22.0% and the degree was 2.51 (sometimes fussy) on the CEBQ food fussiness subscale. This suggests that almost a quarter of children aged ≤2 years are picky eaters, but overall, parents perceive picky eating as an occasional behavior. There was a statistically significant relationship between age and picky eating; each additional month in age was associated with an increase in the CEBQ food fussiness score by 0.06 U. This indicates that picky eating behavior could increase from rarely to occasionally (or occasionally to frequently) over the course of 1 year in young children. Similar to previous reviews on picky eating that included older children,26,68 there was a wide range in prevalence estimates due to differences in conceptualization and assessment tools. Until a uniform definition of picky eating is agreed upon, future studies should consider providing data from both categorical and continuous measures of picky eating to assess prevalence and severity. Studies that use a continuous measure of picky eating and food neophobia provide information on the degree of picky eating but cannot be used to assess prevalence or compare picky eaters with nonpicky eaters. To account for this, a single question (eg, “Is your child a picky eater?”) can be used in conjunction with continuous measures to assess both the degree and severity of picky eating. If continuous variables are categorized, then researchers should consider categorizing picky eating on an ordinal scale (eg, no/low picky eating, moderate/sometimes picky eating, high/frequent picky eating) instead of dichotomizing picky eating scores so that the degree of picky eating can be measured more precisely.
The majority of studies (7 of 8) found no association between the child’s sex and picky eating, which corresponds with previous research in preschool-aged children.20,69 However, 1 study of Chinese toddlers found that girls had more food fussiness than boys.37 This may be explained by differences in cultural background and feeding practices70 or by the fact that picky eating in this study was reported by the parent or grandparent. Holm-Denoma et al.71 found that fathers, compared with mothers, rated their child as pickier; in addition, parents reported eating behaviors differently depending on the child’s sex. Future research on picky eating should account for sex differences of both the child and the caregiver. Although there was no association between birth weight and picky eating, the evidence for current weight was mixed. These results are similar to findings from a recent systematic review that included older children and found no association between childhood weight status and picky eating, which is likely due to discrepancies in the definition and measurement of picky eating.68 Several studies investigated dietary intake and found a negative association with picky eating. Not surprisingly, the strongest evidence was an association with lower vegetable intake.38,41,45,51,54 One concern regarding picky eating is the intake of sweets and savory snacks; in this regard, the present review had mixed results, similar to findings in older children.72,73 Interestingly, picky eating was positively associated with the child’s vitamin and supplement intake.63 However, a recent study found that, other than an association with lower iron and zinc intake, picky eating does not compromise nutrient intake.74 This may provide reassurance to some parents, who could be adding vitamin and mineral supplements to their child’s diet to compensate for picky eating behavior.75
Numerous correlates related to caregiver feeding were investigated. In terms of early feeding characteristics, evidence was inconsistent for the association between breastfeeding duration and picky eating, and null findings were reported for ever-breastfed status. This differs from previous findings in older children, which have indicated an inverse association between being ever breastfed and picky eating.73,76 Farrow and Blissett77 found that breastfeeding, when mediated by lower reported maternal control over child feeding, predicted less negative mealtime interactions between mothers and infants at 1 year of age. However, there was no association between breastfeeding and observed infant acceptance/rejection of food. Further research is needed to explore the relationship between breastfeeding and picky eating behavior. Previous studies suggested that picky eating was associated with early introduction of complementary foods.76 In the present review, results were inconsistent for a relationship between the age at which a child was first given solids and picky eating.
Along the lines of complementary feeding, 1 study found that a baby-led approach was negatively associated with picky eating.44 The World Health Organization currently recommends that infants begin complementary foods at 6 months of age.78,79 However, research is sparse regarding how to introduce complementary foods and the use of baby-led weaning as an alternative to standard approaches.80 In a recent review of qualitative studies on parental perception of healthy behaviors in preventing overweight in children, picky eating was identified as a barrier to healthy eating.81 Parents of picky eaters are more likely be concerned about undereating,82 which could lead to the use of both positive and negative feeding practices in an attempt to influence their children’s food preferences and dietary intake.83 Responsive feeding involves a division of responsibility between the parent and child during mealtimes—parents are responsible for what, when, and where the child eats, whereas the child is responsible for how much and whether or not to eat.84 This review identified a negative relationship between picky eating and responsive feeding such as an increased awareness of infant hunger and satiety cues, monitoring, and providing structured family meals.42–44 In contrast, nonresponsive feeding practices (such as distrust in the child’s appetite, overt restriction, pressure to eat, and rewards for eating or good behavior) were positively associated with picky eating behavior.42–44 These findings suggest that responsive feeding may play a role in the development of healthy independent eating and highlights the importance of reciprocity in feeding interactions. Additionally, based on a systematic review on responsive feeding and overweight in infants and toddlers, further research is needed in this area for early childhood obesity prevention.85
Additional research is needed at the cell and the community/country levels. Twin studies in older children have demonstrated that picky eating and food neophobia are highly heritable traits, with estimates ranging 72%–78%.23,86,87 Previous research in preschool-aged children suggests that genetic sensitivity to bitter taste may influence the development of picky eating behavior88,89; however, similar studies in children aged ≤2 years were not identified. The present review showed that picky eating behavior was positively associated with preterm birth, which supports previous results indicating that preterm birth may play a role in infant feeding problems.90,91 However, other factors could lead to feeding problems in young children, such as food allergies, gastro-esophageal reflux disease, and frequent respiratory infections.92 Further research is needed to investigate additional genetic and biological factors related to picky eating in young children and to determine their influence on picky eating in comparison with other problematic feeding disorders.
At the community/country level, additional areas for research include WIC participation and childcare, specifically the influence of childcare providers. Similar to another cross-sectional study in older children,93 an inverse association between picky eating and WIC participation was found. WIC nutrition staff often receive training on strategies parents can use to manage picky eating behavior94,95; thus WIC participants may receive more guidance on picky eating. Another possibility is that high-income non-WIC participants may cater to their child’s mealtime requests differently.93 Millions of young American children spend time in childcare,96 and further study of the role of childcare could provide valuable information to address the development of picky eating behavior in children. Both the Academy of Nutrition and Dietetics and the Institute of Medicine recommend that childcare providers practice the division of responsibility and responsive feeding.97,98 A recent study on infant and toddler feeding practices in licensed childcare centers found that some providers use nonresponsive feeding practices during family-style meals, such as trying to get children to finish the food they had self-served.99 Another study found that childcare providers across different contexts (ie, Head Start, Child and Adult Care Food Program, and non–Child and Adult Care Food Program) did not meet the Academy of Nutrition and Dietetics’ recommendation to help children understand feelings of hunger and satiety.100 Additional research is needed to investigate the impact of nonparental care (eg, feeding styles and practices) on dietary intake and eating behavior among infants and toddlers and to compare the perception of picky eating behavior between childcare providers and parents.
Findings of this review could inform the Birth to 24 Months and Pregnant Women Dietary Guidance Development Project (B-24 Project), a joint effort led by the US Department of Agriculture and the US Department of Health and Human Services to evaluate the evidence base to support the inclusion of children from birth to 24 months of age in the Dietary Guidelines for Americans (DGA).101 The current DGA provides food-based recommendations for adults and children aged ≥2 years,102 and currently there are no guidelines similar to the DGA for children aged ≤2 years. One task of the B-24 Project is to identify the micro-environmental effects on the transition to an adult diet during the 12–24-month period, including factors related to picky eating. By identifying correlates of picky eating from birth to 2 years, this review helps inform the development of evidence-based guidance and recommendations that promote optimal nutrition and weight-gain trajectories in young children. Additionally, this review identifies areas related to parent and caregiver feeding practices where additional research is warranted.
Some limitations need to be considered when interpreting the findings of this review. There is no consensus on the operational definition of picky eating and no standardized instrument to assess corresponding behaviors in children. This review included studies that measured picky eating and food neophobia using a variety of tools; however, all picky eating assessments were based on caregiver perception. Although many studies examined ≥2 correlates of picky eating behavior, few studies used the same measurement tool, which limited the ability to conduct additional extensive meta-analyses and investigate the impact of different covariates on picky eating. This review is limited to peer-reviewed articles in English; thus, research published in other languages and unpublished studies were excluded. Studies that examined food refusal or struggles for control alone without linking to picky eating or food neophobia were also excluded. Additionally, the literature search, full-text review, and data extraction were conducted by a single author.
CONCLUSION
Picky eating among children is a common concern, yet little is known about how these behaviors develop in early childhood. Without an operational definition and standard measurement tool, the prevalence of picky eating behavior and its relationship with other correlates will continue to show high variability. Future studies should provide data from both categorical and continuous measures to quantify the degree and severity of picky eating. The present systematic review found that influences on children’s picky eating behavior are present at each examined level, from cell to society, but they are predominantly centered around the child and the parent(s). This highlights the importance of investigating the family unit when conducting picky eating research, particularly in regards to child–parent dyads and bidirectional feeding interactions. By using a socioecological model to characterize the evidence on picky eating, this review identifies modifiable factors that may promote healthy dietary habits and food preferences in the first 2 years of life and draws attention to the lack of research at the level of the cell and the community/country.
Acknowledgments
Funding/support. N.C. was supported by the National Institute of Food and Agriculture, US Department of Agriculture (award no. 2011-67001-30101).
Declaration of interest. The authors have no relevant interests to declare.
Supporting Information
The following Supporting Information is available in the online version of this article available at the publisher’s website.
Table S1PRISMA checklist
