


ABSTRACT
There is no consensus whether higher intensity dose renal replacement therapy (RRT) compared with standard intensity RRT has survival benefit and achieves better renal recovery in acute kidney injury (AKI).
In an individual patient data meta-analysis, we merged individual patient data from randomized controlled trials (RCTs) comparing high with standard intensity RRT in intensive care unit patients with severe AKI. The primary outcome was all-cause mortality. The secondary outcome was renal recovery assessed as the proportion of patients who were RRT dependent at key trial endpoints and by time to the end of RRT dependence.
Of the eight prospective RCTs assessing different RRT intensities, seven contributed individual patient data (n = 3682) to the analysis. Mortality was similar between the two groups at 28 days [769/1884 (40.8%) and 744/1798 (41.4%), respectively; P = 0.40] after randomization. However, more participants assigned to higher intensity therapy remained RRT dependent at the most common key study point of 28 days [e.g. 292/983 (29.7%) versus 235/943 (24.9%); relative risk 1.15 (95% confidence interval 1.00–1.33); P = 0.05]. Time to cessation of RRT through 28 days was longer in patients receiving higher intensity RRT (log-rank test P = 0.02) and when continuous renal replacement therapy was used as the initial modality of RRT (log-rank test P = 0.03).
In severe AKI patients, higher intensity RRT does not affect mortality but appears to delay renal recovery.
Australian New Zealand Clinical Trials Registry (ANZCTR) identifier ACTRN12615000394549 (https://www.anzctr.org.au/Trial/Registration/TrialReview.aspx?ACTRN=12615000394549).
INTRODUCTION
Severe acute kidney injury (AKI) often requires renal replacement therapy (RRT) and is associated with high health care costs [1] and a high mortality rate [2]. Moreover, its incidence is >10 times that of end-stage kidney disease (ESKD) [3] and is increasing [4, 5]. Finally, AKI survivors carry greater long-term mortality risks [6], require more institutional care [7, 8] and are more likely to develop chronic and end-stage kidney disease [9].
During almost two decades, after an early influential study suggesting a survival benefit from higher dose intensity [10], AKI research has focused on the effect of increasing RRT dose intensity. This led to several single-center trials [11–16] with variable findings and spawned two large multicenter trials that failed to confirm such survival benefit. In their aggregate, these randomized studies represent a large, comprehensive, prospectively collected dataset that can be analysed using the technique of individual patient data meta-analysis (IPDMA).
IPDMA uses raw individual-level data from each study for analysis and synthesis [17, 18]. By obtaining direct individual data, it allows standardization of analyses across studies while maintaining the benefits of random allocation to study interventions. Thus, in the presence of almost identical patient details and interventions, IPDMA delivers the equivalent of a very large trial [18]. In the AKI setting, it may deliver greater statistical power to elucidate previously undetected effects upon renal outcomes, such as time to independence from RRT.
Accordingly, the Investigation, Management, Prognosis, Recovery, Observation, Value and Evaluation of Acute Kidney Injury (IMPROVE-AKI) collaboration brought together investigators from previous studies of RRT dose intensity in AKI to perform an IPDMA of the effects of RRT dose intensity with a focus on mortality and RRT independence.
MATERIALS AND METHODS
Selection criteria
A systematic review and meta-analysis of individual patient data were performed according to the Preferred Reporting Items for Systematic Review and Meta-Analyses of Individual Patient Data guideline [19]. First, we identified all relevant studies using a previously reported search strategy [20] involving MEDLINE (1950–July 2017), Embase (1966–July 2017) and the Cochrane Library database for randomized controlled trials (RCTs) of RRT dose in AKI. In studies assessing the effects of dose of continuous renal replacement therapy (CRRT), standard intensity (usually a prescribed dose of 20–25 mL/kg/h) and higher intensity (a prescribed dose of 35–48 mL/kg/h) were defined as published in the original studies. In studies assessing the effects of dialysis dose using intermittent renal replacement therapy (IRRT), higher and standard intensity were similarly defined as published (Supplementary data, Table S1). Trials assessing dialysis dose among ESKD patients were excluded. We then asked the lead investigators from all eligible studies to participate in the IMPROVE-AKI collaboration. We followed an a priori statistical analysis plan, as agreed by all IPDMA participants.
All participating investigators signed an agreement on terms of reference for the collaboration. We obtained Human Research Ethics approval from the New South Wales Population and Health Services Research Ethics Committee (reference LNR2011/004), which obviated the need for individual patient consent beyond that provided for the original studies. We obtained additional approval from the National Institutes Diabetes and Digestive and Kidney Diseases Central Database Repository (reference 3428). We registered the study with the Australian New Zealand Clinical Trials Registry (ANZCTR; registration number ACTRN12615000394549).
Data collection
We obtained the IMPROVE-AKI data entirely from the existing datasets associated with the completed participating studies. The principal investigators (or their delegates) provided de-identified data for individual participants from each study, including demographic characteristics (age, sex, comorbidities, comorbidity scores assessed by the Acute Physiology and Chronic Health Evaluation III (APACHE III) score [21], Sequential Organ Failure Assessment (SOFA) score [22], as well as biochemical measures), RRT characteristics (modality, frequency, timing, allocated and received dose intensity), date of death, dates of RRT dependence and cessation and the details of other treatments received.
Outcome measures
The primary study outcome was all-cause mortality. As the duration of patient follow-up varied between studies, all-cause mortality at a fixed time point following randomization was selected (e.g. 28, 60 and 90 days). The secondary outcomes included the proportion of patients who were RRT dependent at 28, 60 and 90 days and time to the end of RRT dependence through 28 days of follow-up. Time to the end of RRT dependence was defined as the time to the last day of RRT. The study protocol planned sensitivity analyses at different time points for the primary outcome, with the intention of maximizing inclusion of study data and minimizing type II error.
Statistical analysis
We pooled individual patient data from each trial and analyzed all outcomes on the intention-to-treat principle. We summarized discrete variables using frequencies and percentages. We reported continuous variables as means with standard deviations (SDs) for normally distributed variables and as medians and interquartile ranges (IQRs) for non-normally distributed variables. Missing data were not imputed, as per the pre-specified protocol.
We assessed the primary mortality outcome as the proportion of participant deaths at a series of pre-specified fixed time points aligned with the duration of follow-up in the various trials (e.g. at 28, 60 or 90 days) using log-binomial regression and adjusting for treatment differences among studies by including a random study × treatment interaction. We also performed patient-level subgroup analyses for a priori–defined baseline characteristics (medical versus surgical patients, presence of sepsis, APACHE III score, weight).
We assessed the secondary outcome of the proportion of patients who were RRT dependent at different key trial endpoints using a log-binomial regression model. We analyzed time to the end of RRT dependence with Kaplan–Meier product limit estimates to produce dialysis independence plots if the proportionality assumption for the analysis was satisfied. As most patient data were available only until 28 days, time to the end of RRT dependence at 28 days instead of 90 days was performed.
We performed subgroup analyses for both primary and secondary outcomes based on the initial modality of RRT. We performed exploratory sensitivity analyses for both primary and secondary outcomes comparing random- versus fixed-effects models. Further sensitivity analysis using time to event analysis for all-cause mortality and time to the end of RRT dependence was performed. Renal function at the day of RRT discontinuation was also assessed by comparing serum creatinine and urea between the higher intensity and standard intensity RRT groups using paired t-test. Statistical analyses were performed with SAS version 9.3 (SAS Institute, Cary, NC, USA). P-values < 0.05 were considered statistically significant for all analyses.
RESULTS
Of eight prospective, RCTs of RRT intensity, seven contributed individual patient data (n = 3682; 95.8% all possible patients) to the IPDMA (Table 1 and Supplementary data, Table S1). Of these patients, 1884 (51.2%) were randomized to standard intensity RRT and 1798 (48.8%) to higher intensity RRT. Their baseline characteristics (Table 1, Figure 1) were evenly distributed, with similar disease severity and sepsis incidence at randomization. Approximately one-third were admitted to the intensive care unit (ICU) following surgical procedures. RRT was provided in both higher and lower dose intensity arms using only CRRT in five studies [10, 11, 13, 15, 16], prolonged intermittent renal replacement therapy (IRRT) in one study [14] and a protocol combining both IRRT, predominantly as short conventional intermittent hemodialysis, and CRRT in one study [12]. More trials reported RRT dependence at specific trial time points for each patient than actual time to the end of RRT dependence for individual patients (Figure 1).
Baseline characteristics of study participants randomized to either standard intensity or higher intensity RRT group
| Variables | Number of trials reported | Higher intensity RRT group | Standard intensity RRT group |
|---|---|---|---|
| (n = 1884)a | (n = 1798)a | ||
| Age, years | 7 | 61.5 ± 14.7 | 62.1 ± 14.9 |
| Male sex, % | 7 | 65.6 | 63.8 |
| Mechanical ventilation (no.), % | 3 | 75.1 | 75.2 |
| APACHE III scoreb | 7 | 92.0 (IQR 76.9–108.2) | 92.5 (IQR 75.5–111.0) |
| Sepsis at baseline, % | 7 | 46.4 | 46.3 |
| Use of vasopressors, % | 3 | 49.9 | 51.4 |
| Total SOFA score, points | 5 | 11.5 ± 4.2 | 11.4 ± 4.1 |
| SOFA cardiovascular (normal %)c | 2 | 20.9 | 21.0 |
| SOFA liver (normal %)c | 2 | 44.6 | 43.4 |
| SOFA coagulation (normal %)c | 2 | 43.7 | 41.1 |
| SOFA renal (normal %)c | 2 | 1.4 | 1.3 |
| SOFA respiratory (normal %)c | 2 | 5.1 | 6.4 |
| Serum creatinine at baseline, μmol/L | 5 | 279.6 ± 213.6 | 267.6 ± 206.3 |
| Mean preadmission eGFR, mL/min | 2 | 55.1 + 31.8 | 59.4 + 29.0 |
| BUN, mmol/L | 5 | 23.4 + 11.8 | 23.1 + 12.3 |
| pH | 4 | 7.3 + 0.1 | 7.3 + 0.1 |
| Bicarbonate, mmol/L | 3 | 18.7 + 5.8 | 19.1 + 5.9 |
| Base excess, mmol/L | 2 | −7.61 + 7.27 | −7.62 + 7.16 |
| Oliguria, % | 5 | 66.2 | 65.7 |
| Weight, kg | 7 | 79.9 ± 16.9 | 80.2 ± 16.3 |
| Type of admission, % | 2 | ||
| Medical | 67.5 | 64.6 | |
| Surgical | 32.5 | 35.4 | |
| Source of admission, % | 2 | ||
| Emergency department | 2 | 50.5 | 50.3 |
| Hospital ward | 2 | 18.3 | 15.3 |
| Transfer from another ICU | 2 | 4.6 | 5.1 |
| Transfer from another hospital | 2 | 12.5 | 13.7 |
| OR after emergency surgery | 2 | 7.5 | 9.0 |
| OR after elective surgery | 2 | 6.5 | 6.7 |
Denominators vary for some characteristics.
Values are represented as median and interquartile range, while other values are represented as mean ± SD or frequency.
SOFA classification for each organ system was defined as normal (scores = 0), dysfunction (scores between 1 and 2) and failure (scores between 3 and 4) based on SOFA scores.
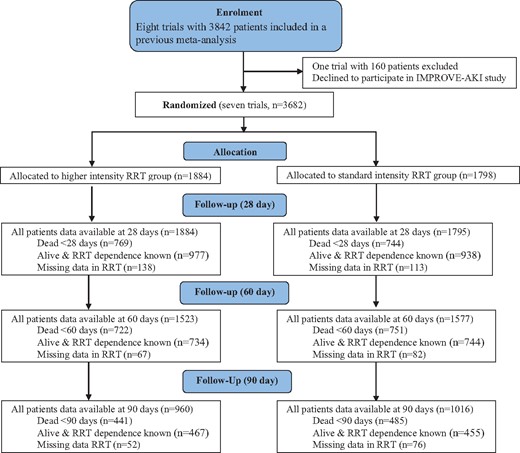
Flow chart of the number of patients enrolled in the IMPROVE-AKI study.
All-cause mortality
All-cause mortality at 28 days after randomization (Table 2, Supplementary data, Figure S1) was equivalent between groups {seven trials [10–16], relative risk [RR] 0.93 [95% confidence interval (CI) 0.80–1.09], P = 0.40}. Likewise, there were no differences in mortality at 60 days [five trials [11–13, 15, 16], RR 0.96 (95% CI 0.83–1.11), P = 0.58] and 90 days after randomization [four trials [11, 13, 15, 16], RR 0.91 (95% CI 0.74–1.13), P = 0.41; Supplementary data, Figure S1]. Frailty models with random effects after adjustment for age, sex, illness severity as assessed by APACHE III scores, weight and sepsis confirmed these findings (Supplementary data, Figures S2 and S3).
All-cause mortality between higher intensity and standard intensity RRT group—all patients
| Outcomes | Number of trials reported | Higher intensity RRT group, n/N (%) | Standard intensity RRT group, n/N (%) | Pooled estimate | |
|---|---|---|---|---|---|
| RR (95% CI) | P-value | ||||
| All trials | |||||
| Mortality at 28 days | 7 | 769/1884 (40.8) | 744/1795 (41.4) | 0.93 (0.80–1.09) | 0.40 |
| Mortality at 60 days | 5 | 722/1523 (47.4) | 751/1577 (47.6) | 0.96 (0.83–1.11) | 0.58 |
| Mortality at 90 days | 4 | 441/960 (45.9) | 485/1016 (47.7) | 0.91 (0.74–1.13) | 0.41 |
| Death in ICU | 6 | 614/1605 (38.3) | 630/1652 (38.1) | 1.00 (0.92–1.09) | 0.97 |
| IRRT trialsa | |||||
| Mortality at 28 days | 2 | 287/644 (44.6) | 272/636 (42.8) | 1.04 (0.92–1.18) | 0.52 |
| Mortality at 60 days | 1 | 302/563 (53.6) | 289/561 (51.5) | 1.04 (0.93–1.16) | 0.48 |
| Mortality at 90 days | 0 | ||||
| Death in ICU | 2 | 259/644 (40.2) | 247/636 (38.8) | 1.04 (0.91–1.19) | 0.59 |
| CRRT trialsb | |||||
| Mortality at 28 days | 5 | 482/1240 (38.9) | 472/1159 (40.7) | 0.88 (0.72–1.07) | 0.20 |
| Mortality at 60 days | 4 | 420/960 (43.8) | 462/1016 (45.5) | 0.92 (0.75–1.12) | 0.40 |
| Mortality at 90 days | 4 | 441/960 (45.9) | 485/1016 (47.7) | 0.91 (0.74–1.13) | 0.41 |
| Death in ICU | 4 | 355/961 (36.9) | 383/1016 (37.7) | 0.98 (0.87–1.09) | 0.67 |
Renal recovery
More high intensity RRT patients remained RRT dependent at 28 days [Table 3; RR 1.16 (95% CI 1.00–1.33), P = 0.05]. For most patients, recovery to RRT cessation data were only available to 28 days. Thus Kaplan–Meier plots of time to dialysis independence to Day 28 was performed, which also suggested a longer time to RRT independence when patients received high intensity RRT (P = 0.02; Figure 2A).
Proportion of RRT dependence among survivals between higher intensity and standard intensity RRT groups stratified by treatment group (fixed-effects model)
| Outcomes | Number of trials reported | Higher intensity RRTc, n/N (%) | Standard intensity RRTc, n/N (%) | Pooled estimate | |
|---|---|---|---|---|---|
| RR (95% CI) | P-value | ||||
| All trials | |||||
| RRT dependence at Day 28 | 6 | 292/983 (29.7) | 235/943 (24.9) | 1.15 (1.00–1.33) | 0.05 |
| RRT dependence at Day 60 | 4 | 109/736 (14.8) | 99/749 (13.2) | 1.08 (0.85–1.39) | 0.52 |
| RRT dependence at Day 90 | 2 | 43/468 (9.2) | 29/456 (6.4) | 1.24 (0.79–1.95) | 0.35 |
| IRRT trialsa | |||||
| RRT dependence at Day 28 | 2 | 151/350 (43.1) | 133/362 (36.7) | 1.17 (0.98–1.41) | 0.08 |
| RRT dependence at Day 60 | 1 | 56/245 (22.9) | 60/263 (22.8) | 1.00 (0.73–1.38) | 0.99 |
| CRRT trialsb | |||||
| RRT dependence at Day 28 | 4 | 141/633 (22.3) | 102/581 (17.6) | 1.12 (0.88–1.41) | 0.36 |
| RRT dependence at Day 60 | 3 | 53/491 (10.8) | 39/486 (8.0) | 1.22 (0.82–1.81) | 0.32 |
| RRT dependence at Day 90 | 2 | 43/468 (9.2) | 29/456 (6.4) | 1.24 (0.79–1.95) | 0.35 |
RRT dependence refers to the number of patients who were still RRT dependent at the different study point.
Two trials allowed IRRT as part of the protocol, including ATN [12] and Faulhaber-Walter et al. [14].
Five trials employed CRRT only, including Ronco et al. [10], Bouman et al. [11], Saudan et al. [16], Tolwani et al. [13] and RENAL [15].
Denominator included all patients who were alive at that fixed study point.
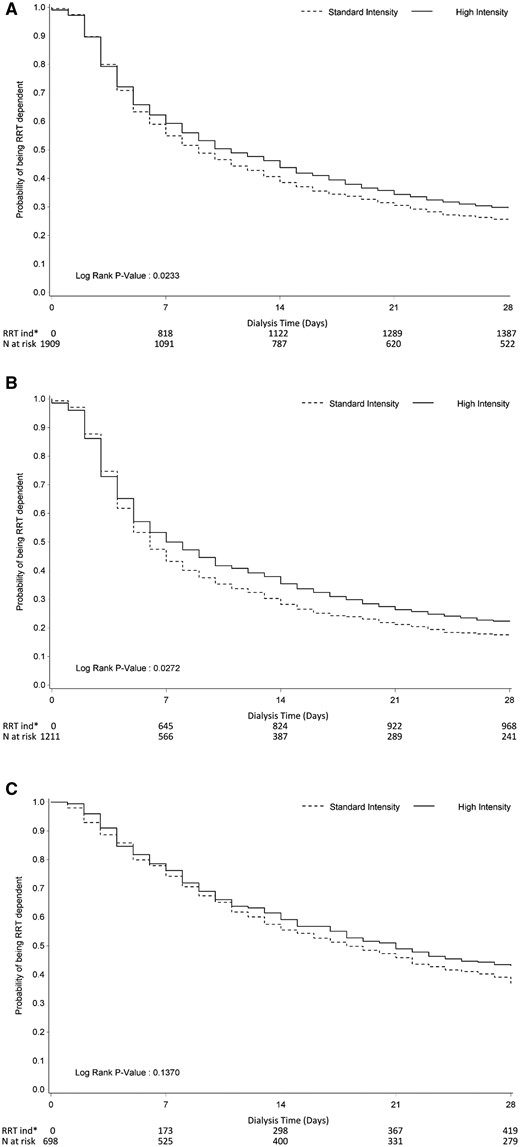
Kaplan–Meier plots of time to the end of RRT dependence at Day 90 by treatment group: (A) all studies, (B) studies employing CRRT only and (C) studies employing IRRT as part of the protocol. In KM plots, missing RRT at later visits is replaced with available RRT at earlier visits.
SUBGROUP ANALYSES AND SENSITIVITY ANALYSES
All-cause mortality
Analysis of all-cause mortality using a fixed-effects model confirmed the results of the primary analysis. Stratifying the analysis based on RRT modality did not demonstrate an interaction between modality and intensity of dose on mortality at any time point. Similarly, none of the other patient-level or study-level subgroups were found to affect mortality at any time point (Table 2 and Supplementary data, Figures S1, S2 and S3). While time to event analysis was performed as an additional sensitivity analysis, there was no statistically significant difference in all-cause mortality between higher and standard intensity RRT (Supplementary data, Table S4).
Renal recovery
Subgroup analysis found no differences in the proportion of RRT dependence at fixed study points between the higher and standard intensity of RRT groups, no matter which modality of RRT was employed (Table 3). However, Kaplan–Meier plots of time to dialysis independence to Day 28 showed higher intensity RRT was associated with prolonged time to the end of RRT dependence when CRRT was employed as an initial modality of RRT to achieve higher intensity (P = 0.03; Figure 2B). A similar trend was seen with studies involving the use of IRRT but did not reach statistical significance (P = 0.14) (Figure 2C). Furthermore, when time to the end of RRT dependence was assessed, patients receiving higher intensity RRT were less likely to be RRT independent by Day 28 (70.3% versus 75.3%; P = 0.03) compared with the standard intensity group. While CRRT was used as an initial modality of RRT to achieve higher dose intensity, fewer patients were able to be RRT independent by Day 28 (77.7% versus 82.4%; P = 0.04) compared with the standard intensity group (Supplementary data, Table S5). Renal function at the day of RRT discontinuation was also assessed by comparing serum creatinine and urea between the higher intensity and standard intensity RRT groups. Only the Acute Renal Failure Trial Network (ATN) [The Veterans Affairs/National Institutes of Health (VA/NIH) Acute Renal Failure Trial Network study (VA Cooperative Study number 530)] [12] and RENAL study [The Randomized Evaluation of Normal versus Augmented Level (RENAL) Replacement Therapy Study] [15] collected data on serum creatinine and urea level on the day of RRT discontinuation. The mean serum creatinine level on the day of RRT discontinuation was significantly lower in the higher intensity RRT group (188.1 ± 118.5 μmol/L) than in the standard intensity RRT group (225.8 ± 133.1 μmol/L) (P < 0.01). Likewise, the mean serum urea level on the day of RRT discontinuation was significantly lower in the higher intensity RRT group (13.2 ± 8.5 mmol/L) than in the standard intensity RRT group (16.4 ± 8.9 mmol/L) (P < 0.01). In addition, violin plots were used to depict the discontinuation time point of RRT in the higher and standard dose intensity RRT groups (Supplementary data, Figure S4).
Furthermore, within the IRRT subgroup, as the The Hannover Dialysis Outcome study [14] employed prolonged intermittent renal replacement therapy (PIRRT), which is different from the ATN study [12] in which the majority of patients received intermittent hemodialysis (IHD), we report the primary and secondary outcomes separately in the Supplementary data, Tables S6 and S7.
DISCUSSION
Key findings
We conducted an IPDMA using data from randomized trials on the effect of higher versus standard intensity RRT on mortality and recovery to cessation of RRT. We found no significant effect on all-cause mortality. However, in the first 28 days of treatment, patients remained RRT dependent for longer while receiving higher intensity RRT.
Relationship to previous studies
Aggregate data meta-analysis (ADMA) is a traditional way of reporting summarized evidence via extracting data from published trial reports. It derives a weighted mean of published summary statistics [19, 23]. The main issues with ADMA are the lack of information about correlation coefficients and the effect of missing data at the patient level, which could result in different pooled estimates of the treatment effects and their standard errors [24]. In contrast, IPDMA can adequately take the correlation between individual observations into consideration by obtaining individual data from all included studies and offers the potential to explore more thorough analyses than ADMA.
IPDMA has been central to understanding of the effects of blood pressure and cholesterol-lowering treatments on important patient outcomes [25, 26]. Its key strength in the AKI setting is the ability to use a consistent means of measuring renal recovery outcomes across all included studies. Furthermore, IPDMA allows assessment of individual baseline characteristics [18, 27], which can only be done at a study level in traditional meta-analysis. Finally, IPDMA allows investigation of additional hypotheses, particularly those related to individual patient characteristics where sufficient data would be lacking in individual studies [28], thus creating a single, virtual randomized controlled trial [25, 26].
However, IPDMA and ADMA usually provide similar results and conclusions in most cases. IPDMA also requires greater resources than ADMA; therefore ADMA should still be considered as an initial meta-analysis and should especially be used when IPD are not available. IPDMA should be considered when additional findings may be obtained from IPDMA [29].
Our mortality findings are similar to those of a previous systematic review and meta-analysis [20, 30] but the findings for renal recovery, including the proportion of RRT dependence among survivors and time to the end of RRT dependence at Day 28, are novel. CRRT has been hypothesized to be associated with better renal recovery due to provision of better hemodynamic stability and fewer episodes of intradialytic hypotension than IRRT [31]. However, recent systematic reviews [32–34] have compared the effect of the initial modality of RRT, i.e. CRRT versus IRRT, on patients’ survival and renal recovery, showing no difference in these two outcomes. The Hemodiafe study [35], the largest RCT assessing various modalities of RRT, also did not find a significant difference in recovery of kidney function between CRRT and IRRT. Our results, however, suggest that more intensive RRT appeared to be associated with delayed recovery of kidney function. It is also possible that the delayed effect seen with more intensive RRT is affected by a delayed ability to recognize renal recovery due to the more intensive control of renal function rather than a true delayed effect. This pattern was similar in trials applying only CRRT and in those using IRRT, but with different statistical significance and power in the two groups (twice as many patients in the CRRT only studies). The similar relative risk with both CRRT and IRRT identified in our results also suggested that the primary reason for the lack of statistical significance in the IRRT analysis was the smaller number of patients.
Study implications
Our study implies that higher intensity RRT may delay recovery to RRT independence in the first 4 weeks. Therefore our findings are relevant to the ∼100,000 ICU patients in developed countries receiving acute RRT every year and further strengthen the case for less intensive RRT doses to be used preferentially. They also suggest the need for further studies to better understand what other factors may impact on early renal recovery.
Strengths and limitations
A key strength of this report is the use of individual data, allowing greater power and precision in defining the effect of increasing RRT intensity upon patient outcomes. By analyzing outcomes in close to 3700 patients in different health care settings across seven countries and three continents, we achieved greater external validity and power than individual studies.
There are also a number of limitations to our study. First, our inability to obtain data from one randomized clinical trial led to 4.2% of patients not being included in our analysis. However, given the number of patients involved, it seems unlikely that inclusion of such data would materially change our findings. Second, the timing of follow-up varied among studies, leading to a loss of statistical power and precision with later follow-up time points and creating serious methodological challenges in data assessment and interpretation. We sought to address this problem by using the time point with the most available data at Day 28. Finally, there was heterogeneity of RRT modalities and doses and crossover from CRRT and IRRT and substantial loss of statistical power when focusing on trials using IRRT. However, the pattern of delayed recovery appeared present irrespective of modality.
In an individual patient data meta-analysis, we found no difference in survival according to RRT intensity. However, higher RRT intensity appeared to be associated with more RRT dependence at 28 days and longer time to RRT cessation within the first 28 days. In light of these observations, further studies of additional interventions, which may impact early renal recovery in ICU patients with AKI appear desirable.
SUPPLEMENTARY DATA
Supplementary data are available at ndt online.
AUTHORS’ CONTRIBUTIONS
Y.W. contributed to data interpretation and writing and critical revision. M.G. contributed to study design, data interpretation and critical revision. Q.L. and S.L. contributed to statistical analysis and critical revision. A.C., S.F., J.M., C.B., R.F., J.A.K., P.M.P., C.R., P.S., A.T. contributed to critical revision. C.B., R.F., J.A.K., P.M.P., C.R., P.S., A.T. and R.B. contributed to data collection. R.B. contributed to study design, data interpretation and critical revision of the manuscript.
ACKNOWLEDGEMENTS
We thank all investigators who contributed to various trials and research coordinators for data collection.
FUNDING
This project was supported by the Australian National Health and Medical Research Council (grant 632811).
CONFLICT OF INTEREST STATEMENT
None declared.


Comments