


Abstract
The retina is composed of ∼50 cell-types with specific functions for the process of vision. Identification of the cis-regulatory elements active in retinal cell-types is key to elucidate the networks controlling this diversity. Here, we combined transcriptome and epigenome profiling to map the regulatory landscape of four cell-types isolated from mouse retinas including rod and cone photoreceptors as well as rare inter-neuron populations such as horizontal and starburst amacrine cells. Integration of this information reveals sequence determinants and candidate transcription factors for controlling cellular specialization. Additionally, we refined parallel reporter assays to enable studying the transcriptional activity of large collection of sequences in individual cell-types isolated from a tissue. We provide proof of concept for this approach and its scalability by characterizing the transcriptional capacity of several hundred putative regulatory sequences within individual retinal cell-types. This generates a catalogue of cis-regulatory regions active in retinal cell types and we further demonstrate their utility as potential resource for cellular tagging and manipulation.
INTRODUCTION
The retina is a complex neural tissue within the eye. It is comprised of a large number of cell types with specialized functions that together enable visual perception (1,2). Retinal cell types include two types of image forming photoreceptors, rods and cones, horizontal cells as well as many types of bipolar, amacrine, ganglion and glial cells. Cone photoreceptors are active at higher light levels and mediate high-resolution color vision, while rod photoreceptors are active at low light condition. Signals sensed by photoreceptors are subsequently integrated and processed by interneurons such as, horizontal cells (HCs), bipolar cells and amacrine cells (i.e. starburst amacrine cells (SACs))(1) and finally converge to ganglion cells, the output neurons of the retina. Some retinal cell types can be uniquely identified by morphology and localization within the different retinal layers, while others require identification by genetic markers (3). Retinal function is affected in a multitude of genetic disorders, a number of which are cell type specific (4). These diseases lead to vision impairment or blindness (5–7).
In mammals, cellular identity is conferred by the activation and repression of specific gene expression programs. This process is principally controlled through the binding of transcription factors (TF) to distal cis-regulatory regions (CRE) named enhancers. Enhancer activity is highly variable across cell types in line with the concept that these elements are central in regulating cell-type specific gene expression (8–11). Systematic mapping of active enhancers based on their characteristic chromatin states has provided a large catalog of putative regulatory regions in a plethora of tissues and cell lines (12–14). In turn, cataloging CREs at the resolution of individual cell types is a prerequisite for understanding the transcriptional regulatory principles that controls cell-type specification within a tissue. Activation of regulatory regions entails binding of transcription factors and coinciding changes in chromatin. This includes increased accessibility (15), specific histone modifications (11,16) and locally reduced DNA methylation (17–20). Histone modification such as acetylation is a direct reflection of transcriptional co-activator activities. It appeared to be one of the best predictor for CRE activity (21) and has been successfully used to identify active CREs in various tissues (22,23). Chromatin accessibility indirectly reflects TF binding activity and thus represents another feature that has been successfully used to identify active CREs in the genome (13,21,24,25). Additionally, in most tested tissues and cell types DNA methylation and accessibility appeared to be tightly anti-correlated (17–20), making low methylation regions (LMRs) a useful proxy to detect active CREs. A notable exception to this rule was found in rod photoreceptors, where a fraction of low methylated regions appeared to be located within a closed chromatin environment (26). This unusual feature adds to the notion of a unique chromatin organization in rods, that has been associated with its cellular function (27).
While useful to identify putative CREs, chromatin based predictions do not inform on functional relevance nor on the ability of putative sequences to efficiently drive transcription in an ectopic context. Indeed a large fraction of putative enhancers fail to drive detectable expression levels when tested in an ectopic context irrespective of the feature used for their identification (21,25,28–31). Enhancers vary largely in size, yet even within very large regions such as the beta globin LCR most activation is conferred by smaller sub-fragments (32), which have proven powerful tools for ectopic gene expression. Thus testing the activity of isolated DNA pieces using transcriptional reporter systems not only informs on the features of cis-regulatory regions able to drive transcriptional activity in different cell types but also identifies potent elements for transgenic gene expression. Using high-throughput sequencing, such assays have recently been parallelized (23,33–38), which enables to quantify the ectopic activity of thousands of DNA sequence variants in a single experiment (39). Yet in vivo such approach was only applied at the resolution of entire tissues (23,38,40), which ignores cellular heterogeneity and thus lacks the resolution required to understand transcriptional regulation at the level of single cell-types.
To characterize the cis-regulatory landscape of the retina, we generated expression profiles and genome-wide DNA methylation maps for four cell types isolated from mouse retinas: cones, rods, HCs and SACs. These datasets identify large collections of putative CREs in each cell type, revealing sequence determinants and transcription factors (TF) potentially involved in the control of identity of these cells. To enable efficient characterization of the activity of the identified CREs, we adapted the principles of parallel reporter assays to in vivo measures at the resolution of single cell-types. As a proof of concept, we measured the activity of hundreds of CREs and defined their activity profile in the four individual retinal cell types. Additionally, we generated libraries of sequence mutants to probe the functional contribution at sequence level of enriched TF motifs. This revealed the co-existence in cis of active and repressive signals at highly active photoreceptor CREs and demonstrates how rational CRE editing can be used to modulate transgene expression levels in a desired cell type.
MATERIALS AND METHODS
Animal handling
All animal experiments and procedures were approved by the Swiss Veterinary Office. Cell type-specific Cre recombinase driver lines: D4-cre (41) for cones, B2-cre (42) for rods, Gja10-cre (4) for HCs and ChAT-cre (Jackson, stock: #006410) for SACs; were in-house crossed to the floxed tdTomato reporter line Ai9 (JAX mice B6.Cg-Gt(ROSA)26Sortm9(CAGtdTomato) Hze/J, Jackson stock: #007909) to generate retinas with one cell type fluorescently labelled. The age of mice was between 50 days and 150 days, sexes were all female for RNA-seq and WGBS and chosen randomly for PRA. Adult wild-type mice (C57BL/6) purchased from Charles River were used for single enhancer testing experiments.
RNA-seq library preparation and sequencing
After retina dissection and dissociation, cells were FACS-sorted directly in lysis buffer of the RNA-easy mini kit (Quiagen) that was used for RNA extraction. RNA-seq libraries were prepared using the Norgen single cell RNA-seq preparation kit (51 800). Each of the three biological replicates were prepared using independent sorts on individual retinas. The samples were run on an Illumina HiSeq2500 generating 50 bp single-end reads.
WGBS library preparation and sequencing
DNA was extracted from cells sorted from single retinas. 50–100 ng of DNA was used as an input for bisulfite conversion (Zymo Gold Kit). The converted DNA was used to prepare whole genome bisulfite libraries using Illumina Truseq DNA methylation preparation kit (EGMK81312) following manufacturer recommendation. PCR product was purified using AMPureXP beads (Beckman Coulter—A63880) and controlled on Bioanalyser High sensitivity (Agilent 5067-4626). The samples were run on an Illumina HiSeq2500 generating 100 bp paired-end reads (rapid-run).
Library generation
Fragments were PCR amplified in 384-well format using Phusion Hot Start II polymerase (Thermo Scientific, #F-549S), pooled, gel purified and cloned blunt ended using an EcoRV site into a vector containing the expression cassette. The expression cassette consists of a multiple cloning site, and a random 15 bp barcode sequence (NNNNWNNNNWNNNNN) and a polyA signaling sequence (pA). In order to average out the contribution of barcode specific biases to the signal we aimed for at least ten different barcodes per unique fragment. To link CREs to barcodes the CRE-barcode sequences were amplified using Primer #2 (see Supplementary for sequences) and one of the Indexing primers (Primers #3–11) containing the Illumina flow cell annealing sequences. PCR products were purified using AmPure XP beads (Beckman Coulter, #A63880). PCR products were directly sequenced using MiSeq 500 or 600 cycle Kits. Next the vector was cut with SphI and PacI and a sequence containing a 31bp minimal promoter, CpG free eGFP and the annealing sequence for Primer #1 was cloned in (Supplementary Figure S3A). This construct was cut out of the cloning vector using NotI and inserted into the AAV vector.
AAV production
AAV production was performed as previously described (43). Briefly, HEK293T cells were transfected with a plasmid containing the transgene between the internal terminal repeats of AAV2, the AAV-helper plasmid encoding Rep2 and Cap for serotype 8, and the pHGTI-Adeno1 plasmid harboring helper adenoviral genes (both kindly provided by C. Cepko, Harvard Medical School, Boston, MA, USA) using polyethylenimine (Polysciences, no. 23966). Vectors were purified by iodixanol gradient (Sigma, Optiprep). Genome titer (genome copies/ml) of AAV vectors were determined by real-time PCR using TaqMan primer/probe set corresponding to the WPRE (Woodchuck Hepatitis Virus Posttranscriptional Regulatory Element) region of the vector and linearized plasmid standards. Titers were between 1 × 10¹⁴ and 5 × 10¹⁴ GC/ml for viral enhancer libraries and between 7 × 10¹¹ and 6 × 10¹² GC/ml for individual enhancer validation experiments.
Subretinal AAV delivery
Viral particles were injected as previously described (44). Briefly, animals were anesthetized using 3% isoflurane. A small incision was made with a sharp 30-gauge needle in the sclera near the lens. 2 μl of AAV suspension was injected through this incision into the subretinal space using a blunt 5μl Hamilton syringe held in a micromanipulator.
Dissociation of retina and fluorescence-activated cell sorting (FACS)
Biological triplicates of one genotype were always done in the morning at the same time and with maximum two hours delay between the first and the last sample. Retinas were isolated and dissociated to single cells by papain digestion as previously described (45). For rare cell types (HCs, SACs) retinas from both eyes were pooled to have enough material. Cells positive for tdTomato were sorted by FACS (BD FACS Aria III (Becton Dickinson) using a 100-μm nozzle with the bandpass filter for RFP HQ616/26. Cells were gated based on their forward- and sideward-scatter. Pulse-width was used to exclude doublets. Fluorescence positive cells were sorted at RT into a low binding tube (Eppendorf) containing 350 μl RLT extraction buffer (RNAeasy, Qiagen) for PRA, 250 μl lysis buffer (50 mM Tris, 10mM EDTA, 4% SDS, adding 10 μl Proteinase K) for WGBS and 300 μl RL buffer (Norgen) for RNA seq. Collected cells were immediately processed or stored at –80°C.
Sample preparation for PRA
After injection, RNA was isolated from sorted cells of the three biological replicates using independent sorts on individual retinas with Quiagen RNeasy® Mini Kit with on-column DNase digestion. After reverse transcription using Takara PrimeScript RT Reagent Kit (#RR047A) barcodes were amplified with KAPA HIFI Hotstart using Primer #1 and indexing primers (Primers #3–11). Since isolation of the AAV DNA from the cellular material turned out to be difficult we isolated DNA from the input AAV for normalization of barcode abundance. DNA from AAV was isolated and barcodes amplified as in the cDNA samples. PCR products were purified using AmPure XP beads (Beckman Coulter, #A63880) and sequenced using 50 cycle Kit on HiSeq 2500.
Adeno-associated virus (AAV) construct for individual enhancer validation
For individual enhancer testing, the sequence of interest was PCR amplified from genomic mouse DNA (129S5) and inserted in front of a minimal promoter (pDis1.2). Clone orientation was determined by sanger sequencing. The CRE-minimal promoter cassette was PCR amplified with MluI and BclI flanking restriction sites and inserted into pAAV2-EF1a-ChR2-EGFP via the same restriction enzymes.
Immunohistochemistry
For individual enhancer testing, mice were euthanized by CO2 and rapid cervical dislocation 3 weeks post AAV injections. Retinas were dissected from the eyecup and fixed for 20–30 min in 4% paraformaldehyde (PFA) (wt/vol) in PBS and washed overnight in PBS. To aid penetration of the antibodies, retinas were frozen and thawed three times after cryoprotection with 30% (wt/vol) sucrose. The retina was incubated in blocking solution: 10% donkey serum (vol/vol), Millipore, 1% bovine serum albumin (wt/vol) and 0.5% Triton X-100 (vol/vol, in PBS, pH 7.4) for 1 h. Primary and secondary antibody applications were done in 3% normal donkey serum, 1% bovine serum albumin, 0.02% sodium acid (wt/vol) and 0.5% Triton X-100 in PBS. Primary antibodies were applied for 3–7 days. After washing the retina three times for at least 10 minutes in PBS, the retina was incubated in fluorescence-conjugated secondary antibodies and 10 μg/μl Hoechst 33342, trihydrochloride, trihydrate at a dilution of 1:200 for 2 h, followed by three washes in PBS, and mounting on slides with ProLong Gold antifade reagent (Molecular Probes). Retinas for vibratome section were embedded in 3% agarose (wt/vol) (SeaKem Le Agarose, Lonza) in PBS, and 150μm vertical sections were cut with a Leica VT1000S vibratome. Antibody staining procedure was the same as in whole mounts. The following primary antibodies were used: rat anti-GFP (1:500; Nacalai/Brunschwig), rabbit anti-mouse cone arrestin, mCAR (1:200; Millipore). For the secondary antibodies, we used in donkey serum raised antibodies from Invitrogen (Alexa Fluor 488, Alexa Fluor 555, Alexa Fluor 633).
Microscopy
Zeiss LSM700 laser scanning confocal microscope was used to acquire images of antibody-stained retinas with an EC Plan-Neofluar 40×/1.30 oil M27 and a Plan-Acro Achromat 10×/0.45 objectives at three excitation laser lines (405 nm for Hoechst, 488 nm for GFP, 555 nm for mCAR). Morphologies of cell types were assessed from 512 × 512 pixel images in a z-stack with 0.85 μm z-steps. Images were processed using Imaris (Bitplane).
Bioinformatics procedures
All analyses were performed using R-Bioconductor. Ad hoc R scripts are available upon request.
WGBS alignment and data extraction
Methylation data processing
Raw sequence files were pre-processed using Trimmomatic (46) to remove Illumina adaptor sequences, discard low quality reads and trim low quality bases. The trimmed reads were then aligned using QuasR (using Bowtie as an aligner) (47,48) against a bisulfite index of the Mus Musculus genome (BSgenome.Mmusculus.UCSC.mm9). CpG methylation call was performed using QuasR. Conversion rates were determined (and controlled to be >95%) by calling methylation of mitochondrial DNA and non-CG context Cs. Methylation was called genome wide for CpGs covered at least 8 times. Since most datasets arise from female mice, sex chromosomes were excluded from the methylation analysis. Genomic tracks were obtained by smoothing data using a sliding window over 10 CGs.
Identification of putative CREs using genome segmentation
Methylation data from each cell type was used to segment the genome using MethylSeeker (49) to identify regions containing at least four consecutive CGs below 50% methylation (False Discovery Rate < 5% in all samples). The total set of CREs (n = 104 322) was defined by merging low methylated regions (LMRs) smaller than 2000 bp from the four retinal cell types. CREs were classified in the (24) 16 possible combinations based on the average CRE methylation in each cell type (considering methylation < 60% as positive).
Generation of CRE libraries
Putative enhancer regions were defined based on LMR definition. Putative specific sequences were nominated by comparing methylation in regions that are LMRs in one but not the other tested cell types. Since any application would require that functional elements are compact we limited fragment sizes of all libraries to maximum ∼700 bp (Supplementary Figure S3C). Tested regions were mostly distal (Supplementary Figure S3B). Primers were batch designed using a custom R function based on Primer3.
We generated four libraries. Library 1 was designed to test the system and contained regions hypomethylated in rods independent of methylation in other cell types. Library 2 was designed to find rod or cone specific elements, therefore we chose sequences displaying differential methylation in rods and cones. To extend our approach to more cell types we generated a library with sequences hypomethylated in HCs and/or SACs in library 3. All three libraries contained a set of verified sequences with different activities discovered in Library 1. To test contributions of TF motifs to enhancer activity we generated Library 4 in which different motifs of two enhancers were mutated. For the pilot library in rods (Library 1), we randomly selected a subset of the putative rod CREs (LMRs). We also included as negative controls a set of fully methylated regions in rods (>75%) without DHS signal in whole retina (24). The Cone/Rod library (Library 2) was designed based on differential methylation between cones and rods. We required cone specific regions to be at least 75% methylated in rods and less than 75% methylated in cones and vice versa. Additionally we included regions that are similarly methylated (>75%) or unmethylated (<75%) to serve as controls to compare measurements as well as the CREs from the validation experiments. The SAC/HC library (Library 3) was designed using LMRs that are hypomethylated in only one cell type and at least 80% methylated in the other three cell types. Additionally the library contained the same set of negative controls negative controls and regions unmethylated in HC and SAC for normalization (<50% in both cell types) as well as the CREs from the validation experiments.
For the mutant library
Motifs present within fragments were identified by scanning known TF position weight matrices (50,51; score > 9). Motifs matches were then randomized. If multiple motifs for one TF were present within a fragment, all motifs instances were mutated together. The CRE mutants were synthesized (gblocks-IDT technologies, for sequences see Supplementary Information) and cloned into the PRA vector.
RNA-seq alignment and data extraction
Raw sequence files were aligned using QuasR (using Bowtie as an aligner; 47,48) against the Mus Musculus genome (BSgenome.Mmusculus.UCSC.mm9). Reads in genes were collected using QuasR based on UCSC transcript annotation for mm9 and RPKM were calculated.
Motif enrichment analysis
For motif analysis on methylome based classification: Putative CREs classified based on their average DNA methylation (see above) were used as an input for motif enrichment analysis using HOMER (52). A set of known matrices was created by combining JASPAR (50) with more recent SELEX datasets (51). Motif enrichment was calculated separately for each factor in each set using a randomized set of sequences with similar base composition as a background. Motifs were filtered for factors expressed in the studied cell types (log2(RPKM) > –2 in at least one cell type). Enrichments for the most significantly motifs (enrichment over background >3-fold; P-value < 0.01) in the cell type specific categories were displayed.
For motif analysis PRA based classification: Motif enrichment analysis was adapted to account for the small size of the sequences set. The same set of motifs was screened over each subset of sequences and a set of control sequences. Differences in motif occurrence frequency between the foreground and background set was calculated. Enrichment in the motif frequency was plotted for the most significantly enriched motifs.
PRA analysis
Assignment of the barcode with the CRE
Sequences from Read1 starting with ‘TCCACTGGGAGAAGAGGAAGTCAAA’ were aligned from position 55 on to the Mus Musculus genome (BSgenome.Mmusculus.UCSC.mm9) using Bowtie.
Sequences from Read2 between ‘CGTTTAAACTGTCGACCGAGCT’ and ‘TTCGGCGCATG’ were extracted as barcodes and the reverse complement was generated. Barcodes and aligned reads were matched using their read IDs. Barcodes were associated with a CRE if >90% of the reads linked to the barcode corresponded to this CRE.
Calculation of CRE transcriptional activity
Analysis was performed on biological triplicates. Barcode sequences were extracted from 50 bp reads by taking only reads starting with the expected backbone sequence: ‘TCCTGCTGGAGTTCGTGACCTGCATGCGCCGAA’. From these reads the sequence at position 34–48 was extracted. The frequency of each barcode sequence was calculated to get counts for each sample. Counts of barcodes were normalized to library size. Enrichment of barcodes in the RNA sample was calculated over their representation in the AAV input. Barcodes not sufficiently covered in the AAV sequencing were discarded (2–16 reads, depending on the sequencing depth). The median activity of all barcodes per CRE was calculated. Only CREs that were covered in at least two out of three biological replicates with at least three barcodes were used for downstream analysis.
RESULTS
Transcriptome and epigenome of four cell types of the retina
The cis-regulatory landscape associated with the cellular diversity of the retina has only been partially characterized through chromatin measures at the level of the entire tissue (24) and for two types of photoreceptors (26,53). Performing similar experiments is considerably more challenging for most cell-types of the retina since these can be significantly less abundant (2). For instance, while rods make up 65% of the mouse retina, horizontal cells only represent 0.5% of the retina (2) which corresponds to <10 000 cells per retina.
Unlike chromatin associated marks, robust DNA methylation measures can readily be achieved from a low number of cells (<5000 cells) and furthermore do not require the preservation of cellular or nuclear integrity during the isolation of cells from complex tissues. Therefore, we took advantage of the fact that in most cell types low levels of DNA methylation indicate accessibility of putative CRE regions (17–20,49) to expand our understanding of the complexity of the cis-regulatory landscape of the retina. We measured gene expression and DNA methylation genome-wide for four cell-types; cones and rods representing two types of photoreceptors; starburst amacrine cells and horizontal cells representing two types of interneurons.
We made use of our previously generated library of transgenic mice that express florescent proteins in specific cell types (3,4) (Supplementary Table S1). Labeled cells were FACS-sorted followed by whole genome bisulfite sequencing (WGBS) and matching sequencing of RNA (RNA-seq) (Figure 1A). The purity of cell isolates was confirmed by their expression of established marker genes (Figure 1B) and the robustness of the procedure is reflected in the high reproducibility of genome-wide expression patterns (R>0.96 - Supplementary Figure S1A). Due to the profusion of rods in the photoreceptor layer of the mouse retina (2,54), we observed a systematic contamination of our cone sorted isolates with ∼10% rods (as observed previously (4,26)). This leads to a systematic underestimation of the rod-specific signal, which is particularly marked at the level of gene expression (Figure 1B). It is however much less pronounced in the methylation profiles since unlike RNA molecules, DNA molecules are directly proportional to the number of contaminating cells (Supplementary Figure S2B).
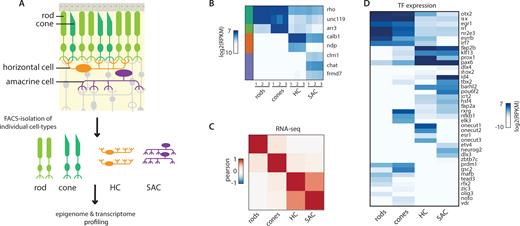
Transcriptome profiling of four cell types isolated from mouse retinas. (A) Scheme used to generate transcriptome and methylation datasets at the resolution of single cell types. Cell populations of rods, cones, horizontal cells and starburst amacrine cells are isolated by cell sorting from mouse transgenic lines carrying fluorescent markers that label these particular cell types of the retina. From cell isolates, whole genome methylation maps and expression datasets are generated. (B) Known cell specific expression markers reproducibly discriminate between cell isolates illustrating the reproducibility of the FACS procedure. Expression levels for markers of the studied retinal cell types. RPKM values for genic RNA-seq signal for samples issued from independent cell sorts. Side bar depicts the cell type associated with the marker (Siegert et al, 2009) (rods: dark green; cones: light green; HCs: orange; SACs: purple). Levels Rhodopsin in non-rod samples shows a particularly high degree of systematic contamination of cone samples with rods, as previously observed (Siegert et al, 2012; Mo et al, 2016). (C) The tested cell types show divergence in their expression profiles. Correlation heatmap comparing transcriptomes of the four studied cell types. Pearson correlation for genic RNA-seq signal merged across three biological replicates for each cell type. (D) Transcription factors showing differential expression between the tested cell types. Heatmap depicting the expression level of the most differentially expressed transcription factors between the tested cell types (top 10% variance). Shown are the RPKM values for genic RNA-seq merged across three biological replicates for each cell type. The heatmap was organized by hierarchical clustering.
Despite this technical limitation, we could unambiguously identify a unique transcriptional signature defining each of the tested cell types (Figure 1B). When clustering cells by proximity of their transcriptomes, we observed a grouping by cellular subtypes, with the highest similarity observed between HCs and SACs (Figure 1C, Supplementary Figure S1A and B). In an attempt to list potential regulators of this diversity, we extracted the transcription factors showing the most transcriptional divergence between cell types (Figure 1D). We observed many TFs having differential expression between photoreceptors and interneurons, including many of the previously described regulators of these linages (Figure 1D; 4,55,56). For instance expression of Otx2, Nrl or Rax as well as several members of the nuclear receptor family appear as a clear signature of photoreceptors. Similarly, interneurons are characterized by high expression of neuronal fate markers such as Pax6. Additionally, each cell type shows unique TF expression signatures. For example rods show elevated levels of Essrb, Nr2e3, Olig3 while cones show preferential expression of RxR gamma, NfKB, Elk3. Similarly, HCs uniquely express several members of the Onecut TF family while SACs display high levels of Pou6f2, Tbx2 or Ap-2 (tfap2b) (Figure 1D). In summary, we define here a catalog of differentially expressed TFs in the four studied cell types that may play a role in regulating their unique transcriptional signature.
Defining the cis-regulatory landscapes of four cell types of the retina
We then used our genome-wide maps of DNA methylation to define a catalog of CREs putatively active in the four studied cell types. For each cell type including rare population of interneurons, we could determine the methylation level for ∼70% of the 20.3 million autosomal CpGs (≥64% in all samples – coverage ≥ 8×). We note that our data from rods and cones agree very well with recently published methylation datasets that were generated using a different isolation strategy (26) (Figure 2- Supplementary Figure S2A). To identify regulatory regions across the tested retinal cell types, we applied our established segmentation approach (18,49). We identified between 80–100 thousand LMRs in each cell type as putative CREs of the retinal system.
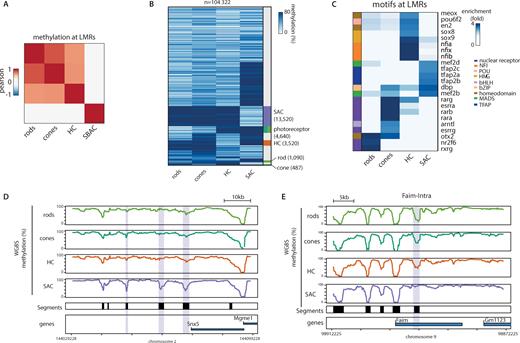
DNA methylation-based identification of putative CRE of the retinal system. (A) Correlation heatmap comparing methylation within low methylated regions detected in the retinal cell types. Pearson correlation for methylation of single CpGs located within the merged list of LMRs across cell types. Heatmap was subjected to hierarchical clustering. (B) Heatmap displaying average methylation of all putative CREs identified across the four studied retinal cell types. LMRs were grouped based on their binarized average methylation pattern (methylation < 60%). Sidebar indicates cell type specific clusters. Clusters were colored according to the specificity of the putative CRE (rods: dark green; cones: light green; HCs: orange; SACs: purple). (C) TF motifs enriched within subsets of putative CREs defined by their low methylated in individual cell types. Enrichment for known motifs was calculated for each set of cell-type specific LMRs and compared to a set of control sequences. Enrichments are displayed only for motifs significantly enriched in at least one cell-type specific subset, and for predicted transcription factors expressed in at least one of the cell types. Side-bar depicts the TF family associated with the enriched motif. (D, E) DNA methylation pattern of the four analyzed cell types of the retina at exemplified genomic regions. (D) Shown is the average WGBS signal around the Snx5 gene containing several SAC-specific low methylated regions (purple box) and the Faim gene containing a photoreceptor specific low methylated region (purple box). Black boxes denote regions displaying low methylation in at least one of the analyzed cell types, indicative of putative retinal CREs.
Since methylation differences at CREs is an indirect indication of regulatory activity, we compared the methylation status of these regions between cell types (Figure 2A, B, Supplementary Figure S2C-H). We observe only subtle differences in the DNA methylation levels at these regions between cones and rods (Figure 2A, Supplementary Figure S2C). However, HCs and to an even higher extend SACs show substantial differences in their methylation levels at LMRs (Figure 2A, B, Supplementary Figure S2D–G) in agreement with the functional divergence between photoreceptors and interneurons. Interestingly, contrasting our data with previously published methylation datasets from purified neurons (20) reveals a closer proximity of SACs but not HCs with these neuronal types (Figure 2; Supplementary Figure S2A).
Reduced DNA methylation levels at regulatory regions is generally correlated with nucleosome depletion and increased chromatin accessibility. We therefore wondered if existing accessibility data derived from entire retinas (24,26) could support and strengthen our identification of cell type specific CREs. We first asked how the DNA methylation levels derived at the single cell-type level, would compare to existing ATAC-seq data derived from entire retinas or isolated photoreceptors (26). While we observed the expected anti-correlation between DNA methylation and accessibility for photoreceptors (Supplementary Figure S2I), we found no clear correlation for HCs or SACs. In line with the cellular composition of mouse retinas, this result suggests that accessibility data derived from entire retinas do not quantitatively reflect the chromatin status of rare cell-types such as interneurons. We nevertheless asked if interneuron specific LMRs would have low but detectable ATAC-seq signal in the whole retina datasets (Supplementary Figure S2J). This revealed that in contrast to photoreceptors, a large majority of interneuron LMRs (>95%) are not scored accessible in the dataset from whole retina (Supplementary Figure S2J). This suggests that whole retina is only poorly informative when studying CREs from rare cell types. Additionally, as previously reported (26), we noted that in rods, a significant fraction of LMRs are not accessible in a rod specific dataset (Supplementary Figure S2I, J). In order to simplify the identification of active regulatory regions, we excluded these regions for the downstream analyses.
Methylation information for individual cell types enabled us to classify these candidate regions based on their differential methylation (Figure 2B). For interneuron sub-types, this identifies several thousand cell type-specific regions (HC: 3520; SAC: 13520) (Figure 2B, exemplified in Figure 2D). Similarly, we identify several thousand regions specific for photoreceptors (n = 4640; Figure 2B, exemplified in Figure 2E). In addition, we observe significantly fewer elements specific for either rods (n = 1090) or cones (n = 487). This suggests that a large majority of regulatory regions are shared between these two developmentally closely related photoreceptors.
Identification of sequence determinants of cell-type specificity
Having defined sets of putative CREs in four cell types of the retina using cell type specific features of the methylome, we next asked if their sequences can educate on transcription factors involved in their regulation (18,19,49). Toward this goal, we performed motif enrichment analysis (Figure 2C) but restricted to sequence motifs linked to TFs expressed in at least one of the four retinal cell types that we studied in order to enhance the quality of our predictions.
This analysis revealed that each set of specific CREs is characterized by the enrichment of distinct sequence motifs (Figure 2C). Photoreceptor CREs share enrichment for the motif of Otx2, which could also be bound by CRX. Both factors are critical for the development of the photoreceptor lineage (57–59). Interestingly, we find that distinct motifs for nuclear receptors (NRs) discriminate CREs in cones versus rods. These include canonical tandem repeat motifs implying NR dimerization, but also several monomeric motifs hinting at a role for orphan NR in this cellular specialization (Figure 2C). Our data further suggest a putative role for Sox- and Nfia-family factors in HCs identity, expanding on their previously described functions in multiple cellular differentiation processes within the central nervous system (60,61). Interestingly, TFAP-motifs discriminate SACs from other cell types. These motifs are recognized by AP-2 which has been recently linked to the amacrine cell fate (62).
Importantly, several of the motifs identified within these cell type specific CREs are potentially bound by TFs that are differentially expressed in our expression dataset (Figure 1D). In photoreceptors, these include Otx2 and several nuclear receptors (Figures 1D and 2C). In the case of SACs enrichment of motifs recognized AP-2 family of factors (Tfap2a–d), is in agreement with the high expression of Tfap2-a in these cell types. Altogether this dataset provides a comprehensive catalog of CREs putatively active in four cell types of the retina and identify sequence determinants potentially involved in their specificity.
Parallel reporter assay (PRA) in isolated cell types
Having identified a large set of putative CREs active in several cell types of the retinal system, we aimed to systematically test their ability to drive transcription autonomously in a reporter assay. We adapted the PRA-based strategy (23,34) to enable measurement of enhancer activity for thousands of constructs in distinct cell populations of the mouse retina in vivo using barcoded transcripts (Figure 3A). Studying individual cell types within a complex tissue poses several technical hurdles. Its success relies on the ability to measure complex libraries of fragments in the target cell type. This creates the necessity to reproducibly deliver diverse DNA libraries and to recover them from cell types under study. This is particularly challenging for cells that are rare within a tissue, which is the case for most cell types of the retina and true for most regions of the brain (2,54,63).
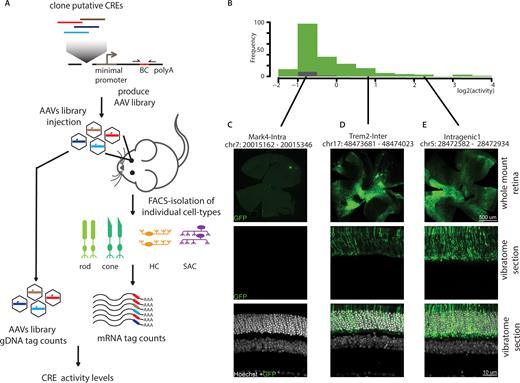
Parallelized reporter assay in specific retinal cell types. (A) Schematic representation of the procedure used to perform parallel reporter assays at the resolution of single cell types. Putative CREs are selected based on the detection of cell type-specific low methylation. Subsets of CREs are batch-cloned in front of a minimal promoter driving transcription of a GFP cassette followed by a unique barcode. These libraries are packaged into adeno-associated viruses and injected as pools in retinas of transgenic mice labeled for the cell types of interest. Three weeks following injection, cell populations are FACS sorted and RNA is extracted. CRE activity is determined as function of the barcode counts in the RNA normalized to the barcode counts in the AAV gDNA. (B) Histogram representing the distribution of activities observed for putative rod CREs (lowly methylated - green) and control regions (highly methylated - grey). Fragment activity was determined as ratio of barcode abundance in RNA sample versus abundance in the AAV pool used for infection. Displayed are average activity values derived from at least 3 biological replicates. CREs that were tested with an individual GFP reporter system are marked in the plot at their respective activity group. (C–E) Comparison of activity levels measured by PRA with trans-membrane GFP reporter signal for individual CREs. Immunohistochemical staining of whole mount and vibratome sections from wild type mouse retinas injected with individual constructs showing no (C), intermediate (D) or high (E) activity in the PRA assay. Green: GFP, white: Hoechst staining of DNA.
To test the general feasibility of our approach (Figure 3A), we first benchmarked our assay using a library that targets rod photoreceptors as the most abundant retinal cell type (2,54) using photoreceptor-specific methylation as a guide. We designed a pilot library of 384 fragments consisting of regions showing low methylation in rods (Figure 2B) plus 13 negative controls chosen to be highly methylated in rods and devoid of DHS signal in the whole retina (24). Most of the selected sequences arise from CREs that locate distal from promoters (Supplementary Figure S3B) and tend to be short (<600 bp, Supplementary Figure S3C). These sequences were cloned in front of a minimal promoter and a GFP coding sequence plus a 15 basepair randomized barcode at the 3′-end (Supplementary Figure S3A). We aimed for at least 10 barcodes per sequence to exclude barcode specific biases, and enhance technical reproducibility (29,30; Supplementary Figure S3D). We sequenced these plasmids to assign each CRE with its corresponding BCs and excluded barcodes that would associate with more than one CRE. These constructs were then packaged in high titer AAV (serotype 8) and subsequently used for sub-retinal injection into eyes of rod-labeled transgenic mice (Supplementary Table S1). AAV allows for efficient infection of all target cell types used here due to its broad tropism (64). Moreover it is able to transduce non-dividing cells, displays low toxicity and supports strong and persistent transgene expression (65,66). Three weeks following injection, rods were isolated by FACS and RNA was extracted from ∼100 000 sorted rods or unsorted total retinas as a control. Barcode containing mRNAs were amplified and sequenced. The efficacy of infection was determined by measuring barcode complexity in each sample and by comparing it to the input viral AAV pool. This revealed an average recovery of 66%, illustrating that a large proportion of the library is present in the isolated cell population (Supplementary Figure S3E). For each of the 258 recovered sequences, we determined their relative activity as a measure of barcode abundance in the RNA relative to its DNA copy number in the viral pool (Figure 3A). This activity measure showed high reproducibility between samples from independently injected mice (Supplementary Figure S3F and G). A majority of the tested putative rod CREs show only basal activity that is comparable to our negative controls (Figure 3B) while ∼25% of the inserted sequences show transcriptional activity above background. The finding that only a minority of putative CREs are autonomous in driving detectable transcription in this ectopic context is expected and in line with previous reports (21,25,28–31). Importantly however, active sequences display expression over a wide dynamic range suggesting that our assay provides a sensitive and quantitative readout (Figure 3B). Moreover, we observed high correlation between activity levels observed in rods with that of total retinas (R = 0.96 - Supplementary Figure S3H), in agreement with the fact that rods make up ∼65% of this tissue (2,54).
Out of this library, we independently tested seven constructs in vivo, which cover a range of activities measured by PRA (Figure 3C–E). The fragments were cloned individually into a reporter system driving expression of GFP fused to the trans-membrane protein Channelrhodopsin (ChR2). Individual AAV preparations were injected into eyes of wild type mice. ChR2-GFP expression pattern in the retina was analyzed after antibody staining by confocal microscopy three weeks following injection. While unlikely to reflect quantitative expression differences, this validation system should enable to discriminate highly active from inactive constructs, and to identify the involved cell-types though spatial distribution of the fluorescence. We indeed observed a good agreement between PRA-measured activity and the ChR2-GFP signal observed in the retinal sections (Figure 3C–E). Only the fragments with high PRA signal displayed detectable GFP levels which are restricted to the photoreceptor layer. We conclude that PRA accurately reflects the autonomous transcriptional activity of DNA fragments in vivo when performed at the level of single cell types.
Autonomous CRE activities in four retinal cell types
Next we aimed to characterize the autonomous activity of putative CREs identified in the four cell types of interest: rods, cones, HCs or SACs (Figure 3A). We designed two additional libraries that cover a spectrum of putative CREs based on their local hypo-methylation (Figure 2B). These libraries contained shared elements but their composition was biased either toward CRE active in photoreceptors (library #2) (Supplementary Figure S4A) or interneurons (library #3) (Supplementary Figure S4B) as measured by differential DNA methylation. After generating viral pools, we infected retinas of adult transgenic mice (P50–150) that carry specific markers for a particular cell type (3,4; Supplementary Table S1). For each experiment, we sorted cells from three independently injected mice. We systematically performed activity measures in the labeled target cell type and contrasted it with its activity in the remaining unlabeled cell types of the retina.
We first aimed to characterize the in vivo activity of putative photoreceptor CREs (Figure 2B) in cones and rods separately. We infected retinas with AAVs carrying library #2 that contains elements showing preferential putative activity in photoreceptors based on their differential methylation. As observed for our pilot experiment in rods (Figure 3B), we observed that only a fraction of the tested CREs drive detectable activity in rods (Figure 4A) or cones (Figure 4B). Additionally, we found that the tested set of CREs display very similar activity in rods and cones (Figure 4C), with only subtle differences between the two cell types. Thus, we were unable to separate cones from rods with the tested set of CREs. This is unlikely to be the sole consequence of contamination by rods as this should not affect the detection of cone specific elements. More likely, it could reflect the high similarity in the regulatory networks active in these two cell types (Figure 2A, B). Alternatively, we cannot exclude that the episomal reporter system used here does not accurately recapitulate differences at the chromosomal level between these cell types (67).
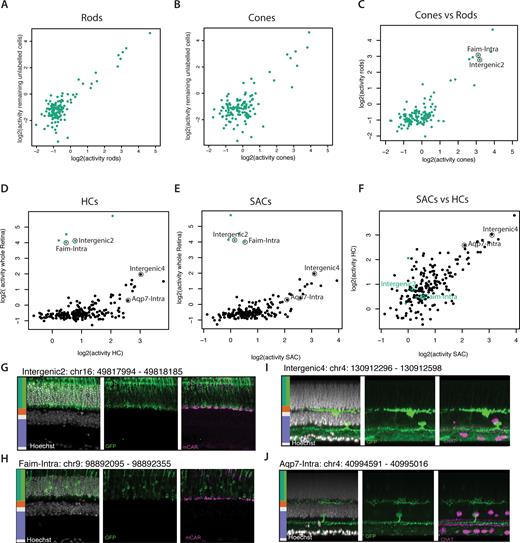
Characterization of the autonomous activity of CREs in distinct cell types of the retina. (A, B) Most tested sequences show similar activity in rods and cones. Scatter plot contrasting activity of CREs as measured by PRA in (A) rods or (B) cones against the remaining pool of unlabeled cells from the retina. For each experiment fluorescently labeled cells and remaining unlabeled cells were sorted from retinas infected by the AAV PRA library. Displayed is the normalized activity for each fragment averaged over biological replicates. (C) Scatter plot contrasting activity of CREs as measured by PRA in rods versus cones. (D, E) Most of the tested sequences show similar activity in HCs and SACs that largely differs from activity observed in whole retina. Similar scatterplot as in (A-B), contrasting PRA activity in (D) HCs or (E) SACs against the remaining pool of unlabeled cells from the retina. (F) Scatter plot contrasting activity of CREs as measured by PRA in HCs versus SACs. (G-H) Microscopical validation of the specificity of individual photoreceptor specific CREs in the tissue context. Shown is Chr2-GFP fluorescence for individual reporter constructs with indicated CRE. Immunohistochemical staining of vibratome sections from transgenic mouse (cone-labeled, mCAR) retinas injected with two CREs detected by PRA to be active in photoreceptor but not in interneurons. White, Hoechst; green, GFP; purple, cone marker mCAR. Scale bar, 10 μm. Side bar depicts the expected localization of the different studied cell types based on the considered retina layers. (I and J) Similar validation as in (G-H) for interneuron specific CREs. Shown is Chr2-GFP fluorescence for individual reporter constructs with indicated CRE. Immunohistochemical staining of retina mounts from transgenic mouse (SAC-labeled, ChAT) retinas injected with two CREs detected by PRA to be active in interneurons but not in photoreceptors. White, Hoechst; green, GFP; purple, cone marker ChAT. Scale bar, 10 μm. Side bar depicts the expected localization of the different studied cell types based on the considered retina layers.
The remaining unlabeled cells behaved similarly to rods and cones. This is mostly due to the fact that these cells contain cones or rods depending on the sorted cell type (Figure 4A, B). Additionally, we cannot exclude that some of the labeled cells are sorted into the unlabeled fraction if their signal was low since we aimed for higher stringency in the labeled cells rather than the unlabeled fraction.
Interneurons such as SACs and HCs on the other hand differ largely from photo-receptors in their repertoire of CREs (Figure 2A, B), which would suggest high differential CRE activity. We then constructed a third library combining 5 fragments identified to have a high autonomous activity in photoreceptors (Figure 4A–C) with a set of 365 CREs showing low methylation in interneurons (HCs and/or SACs). We measured the activity of these fragments in SACs or HCs as well as in the respective remaining unlabeled cells of the retina. Contrasting CRE activity in interneurons with the remaining unlabeled total retina (composed of ∼65% rod photoreceptors) revealed differences over three orders of magnitude (Figure 4D, E). In contrast the two types of interneurons show very similar activity profiles for the tested set of fragments (Figure 4F). These observations are in line with the divergence between the tested cell types (Figures 1C and 2A) and identify a set of CRE with differential autonomous activity between photoreceptor and interneurons.
Since only a fraction of our tested sequences were active in our assay, we wondered if any genetic or chromatin features enrich at sequences that show autonomous activity. Indeed active sequences show a slightly higher enrichment for TF motifs compared to the inactive ones (Supplementary Figure S4C). Enriched motifs include CRX/Otx2 or NR type motifs for photoreceptors and AP2 motifs for interneurons, suggesting that these factors may be important for the activity in the respective cell types. It is important to note however that these are also enriched (though to a lesser degree) in inactive fragments compared to background sequences (Supplementary Figure S4C), indicating that presence of these motifs alone is not sufficient to explain activity. We then asked if methylation or accessibility of their originating sequences would also help to predict their activity (Supplementary Figure S4D, E). None of these chromatin features could clearly discriminate active from inactive fragments. However, we noted that fragments active in photoreceptors tend to show lower methylation levels in cones when compared to inactive ones (Supplementary Figure S4D). Additionally, fragments active in photoreceptors tend to originate from regions showing higher accessibility in whole-retina (Supplementary Figure S4E). Together, this suggests that selecting fragments containing a high number of TF motif occurrences and high levels of chromatin alterations (lower methylation levels and high accessibility) could potentially improve identification of sequences with autonomous activity.
Having determined the relative activity of individual elements at the level of mRNA, we next wanted to ask if their activity is sufficient to autonomously drive the expression levels of the large reporter gene mentioned above (Chr2-GFP) in a specific fashion and at levels that can be detected by in situ microscopy. For this we selected 20 CRE sequences and cloned them into a ChR2-GFP reporter for individual testing in the entire retina. Compared to conventional GFP, the utilized fusion protein locates to the cellular membrane, which facilitates the identification of retinal cell types in vivo. We observed that only the fragments showing the highest relative activity in PRA led to robustly detectable GFP signal in retinal sections for photoreceptors (Supplementary Figure S4F) and interneurons (Supplementary Figure S4G). From this small subset, we identified fragments driving specific activity in photoreceptors (Figure 4G, H) or in inter-neurons (Figure 4I, J), mirroring the strong differences observed between these cell-types in PRA (Figure 4D, E). In contrast to this clear separation of retinal sub-types (photoreceptors versus inter-neurons), the expression pattern of the tested fragments was rarely limited to a single cell-type. Additionally while several CREs display clear activity in HC and amacrine cells (i.e. Figure 4I, J, Supplementary Table S2), we did not detect Chr2-GFP in starbust amacrine cells, the ChAT positive amacrine cell subtype that we used in the sort. These results likely illustrate the inherent limits of the current screen in which we focused on only four out of the >50 cell types composing the retina. In summary, we show proof of principle that PRA can be used to systematically characterize the autonomous activity pattern of CREs in multiple cell-types and therefore identify short DNA fragments able to confer robust transcriptional activity in different cellular subsets of the retina. A summary of all PRA results is provided as Supplementary files.
Functional dissection of the architecture of two photoreceptor CREs
Analysis of the occurrence of sequence motifs within CREs active in retinal cell types revealed putative TF motifs involved in their regulation (Figure 2C). We aimed to test if and how some of these motifs contribute to CRE activity ectopically. Such information would be relevant to better understand the regulatory landscape that controls cell identity, but could also provide opportunities to effectively modulate the activity of identified elements.
To do so, we selected two elements that we identified as being active in photoreceptors (Figure 4C and Supplementary Table 2) and that contained TF motifs specific for these cell types (Figure 5A, B). For these, we generated a library of sequence mutants to systematically test the effect of deleting each motif instance on CRE activity (Figure 5C, D). Each motif occurrence detected within the sequence was iteratively replaced with a random sequence (Figure 5C, D), generating a collection of individual mutants for each fragment.
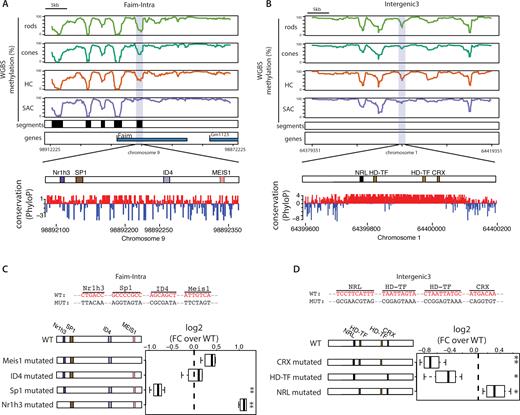
Dissection of the architecture of two photoreceptor CREs. (A, B) DNA methylation pattern of the four analyzed cell types of the retina around the two CREs selected for functional dissections (purple box); (A) Faim-Intra and (B) Intragenic 3 enhancers. Black boxes denote regions displaying low methylation in at least one of the analyzed cell types, representing putative retinal CREs. The TF architecture of the CREs is detailed, showing the TF binding sites identified (colored according to the TF family as in Figure 2C) and the PhyloP conservation track for the region. (C, D) Effects on activity of systematic deletion of TF motifs for two CREs. Each motif identified in the CRE sequence was iteratively replaced by a randomized sequence (shown in upper panel). Activity of the generated library of mutants was compared to the wild type sequence. Boxplots represents the distribution of individual measurements from different biological replicates. Statistical significance of changes in activity were tested using a bidirectional t-test (*P < 0.05; **P < 0.01).
Performing PRA with this mutant library identifies diverse effects depending on the mutation. This included reduced activity upon motif randomization as might be expected from removing a binding site for an activating factor. However, we also detect in several cases increased levels of CRE activity upon ablation of TF motifs suggesting removal of a binding site for a repressive factor. Together this suggests that negative and positive regulatory inputs co-exist to modulate precise activity level of these particular CREs.
More specifically we detect reduced CRE activity upon deletion of CRX/Otx2, Sp1 or motifs typically bound by factors containing a homeodomain (Figure 5C, D). This is in agreement with the notion that these motifs act as activators. In contrast, mutating the conserved monomeric NR motif enhanced CRE activity (Figure 5C), arguing that NR mediated repression negatively modulates the activity of this element (Faim-Intra). This evidence for repression seems particularly interesting given that this element already displayed the highest activity in our screen (Figure 4C). Similarly, deletion of the NRL motif enhances CRE activity suggesting that NRL can act as a repressor in this context. This potentially reveals a novel mechanism of action for NRL that was hitherto only known for its activation function at the rhodopsin promoter (56,68). In summary, we show how PRA assays can be used to identify and functionally annotate determinant TF motifs within CREs. Moreover, we demonstrate how discrete sequence changes can be used to rationally enhance or reduce transgene expression levels in vivo.
DISCUSSION
Using transcriptome and epigenome profiling, this study identifies a large collection of putative cis-regulatory elements active in four distinct cell types of the retina. Additionally, we provide proof of concept for the usage of parallel reporter assays to measure the autonomous transcriptional activity within the retinal tissue at the level of individual cell types. We successfully apply this framework to define the activity pattern of hundreds of short DNA sequences in several cell types of the retina. This effort let to the identification of a small set of short sequences showing preferential activity in different cellular subsets of the retina. We also demonstrate how this technology can be used to dissect the architecture of regulatory regions in vivo.
PRA has been previously applied in vivo but without discriminating between specific cell types that make up a tissue (23,38,40). Here we use FACS-sorting on a library of mouse lines, where various cell types are fluorescently labeled. This enables reproducible isolation of pure cell populations (3,4), but is inherently constrained by the number of cells available, which is particularly limiting for rare cell types. In order to circumvent these bottlenecks and to derive accurate PRA measures for low cell numbers, we combined high efficiency AAV-based delivery of our libraries with multiplexed measures for each fragment. When contrasting whole tissue with cell-type specific data we observed that whole tissue data only reflects sequence activity in photoreceptors, which is the dominant cell type in mouse retina. Consequently whole tissue analysis failed to capture activities in rare cell types thus demonstrating that cell type isolation and activity assignment is critical.
It has recently been established that DNA hypo-methylation at distal regulatory regions coincides with their accessibility and putative activity in many cell types and tissues (18,49). Here we used this epigenetic feature as a guide to nominate CREs active in a cell-type specific manner. In agreement with previous reports (21,25,28–31), most of the hypo-methylated CREs tested failed to autonomously drive transcription in our reporter assay. Using chromatin accessibility data available for some cell types (26), we found that most of these inactive sequences are indeed accessible, ruling out that alterations of DNA methylation dynamics (as observed in rods (26)) could explain this high rate of negatives. Alternatively, we think that this result can likely be explained by the inherent inability of some CREs to function autonomously (21,25,28–31), their incompatibility with the TATA containing minimal promoter used in this assay (69) and/or the truncation of the regulatory element in our systematic library design (21,25,28–31). In any case, this confirms the requirement of a high throughput screening strategy to identify CREs that function autonomously.
Mining of the resulting datasets identified TF binding motifs that associate with cell type specific activity within the retina. Mutational analysis indeed reveals functional relevance for these motifs within a given CRE. One striking observation was the enrichment for NR motifs within sequences active in photoreceptors. This included differential enrichment of monomeric NR motifs between rods and cones, suggesting a role for orphan NRs in distinguishing between these closely related cell types. Importantly deletion of this motif leads to increased activity in an example CRE, which is in agreement with the repressive function assigned to some orphan NR (70). While the motif does not reveal the responsible TF, we note that only a few candidate orphan NRs are differentially expressed between rods and cones, which we hypothesize to be likely candidates (Supplementary Figure S4C). One of these is Nr1h3 (LXRα) a well-known regulator of lipid metabolism in liver. This factor is highly expressed in cones and was recently linked to the development of the zebrafish visual system (71). Another relevant finding relates to the recognition motif for NRL, which is a known decisive factor during photo-receptor differentiation (56,72). Mutations of this motif resulted in enhanced CRE activity, indicating an unexpected repressive role for NRL at least within the tested element. This contrasts with its function at the rhodopsin promoter (56,68,72), suggesting that NRL function could be context specific, in line with recent reports of regulation of its activity through complex interactions (73).
For several inherited retinal diseases, gene-replacement or targeted expression of optogenetic sensors is considered a credible strategy to reverse phenotypes and at least partially restore vision (5–7). Such approach critically relies on short sequences that can drive expression of a transgene from an AAV in a defined cell type in vivo. Our parallel measurements defined the expression pattern within four defined cell types for a catalogue of short sequences in the mouse retina. Testing the ability of a subset of these CREs to drive levels of transgene relevant for cellular manipulation highlights the importance of selecting CREs displaying specific but also strong activity patterns. In the current screen, we identified a small set of sequences with preferential expression in different cellular subtypes of the retina, but not identifying unique cell types. Yet only sequences displaying the highest activity level in our parallel assay led to expression levels of a fusion reporter protein considered to be sufficient for cellular manipulation. Thus targeting of disease relevant cell-types of the retina, will ultimately require a better understanding of the sequence features that define cell type specific expression and thus further screening efforts and sequence engineering to more cell types. The current study demonstrates that PRA applied at the cell type specific level provides throughput and sensitivity to contribute to this goal.
DATA AVAILABILITY
The raw and processed data have been submitted to GEO under the accession GSE84589. The processed data can be visualized on the UCSC genome browser at: http://genome-euro.ucsc.edu/cgi-bin/hgTracks?hgS_doOtherUser=submit&hgS_otherUserName=krebsarnaud&hgS_otherUserSessionName=Hartl_et_al_retina_2017.
SUPPLEMENTARY DATA
Supplementary Data are available at NAR Online.
ACKNOWLEDGEMENTS
The authors are grateful to Michael Stadler for his support in developing the PRA analysis strategy, Hubertus Kohler for cell sorting and Birgitte Lucas for low-cell RNA-seq library preparation. The authors would like to thank members of the Schübeler laboratory for helpful discussions and comments on the manuscript.
Author contributions: A.R.K. initiated and designed the study with support from D.S and B.R.. D.H., designed the PRA strategy with support from A.R.K. and D.S.. A.R.K. and D.H. designed and performed genomics and PRA experiments. J.J. generated and injected AAV libraries, sorted cells, performed and analyzed in vivo testing of single fragments. D.H. implemented the PRA analysis pipeline with support of A.R.K., D.H and A.R.K analyzed data. D.H., A.R.K. and D.S. wrote the manuscript with help from B.R. and J.J.. D.S. and B.R. supervised the project.
FUNDING
Novartis Research Foundation (to DS and BR); European Research Council (to BR and ReaDMe - REP-667951 to DS); Swiss National Sciences Foundation (to D.S. and B.R.); Swiss National Sciences Foundation Ambizione (PZOOP3_161493 to A.R.K.); Boehringer Ingelheim Fonds (to D.H.). Funding for open access charge: Swiss National Sciences Foundation Ambizione.
Conflict of interest statement. None declared.
REFERENCES
Author notes
These authors contributed equally to this work as first authors.

Comments