


Abstract
Light-inducible systems allow spatiotemporal control of a variety of biological activities. Here, we report newly optimized optogenetic tools to induce transcription with light in mammalian cells, using the Arabidopsis photoreceptor Flavin Kelch-repeat F-box 1 (FKF1) and its binding partner GIGANTEA (GI) as well as CRY2/CIB1. By combining the mutagenesis of FKF1 with the optimization of a split FKF1/GI dimerized Gal4-VP16 transcriptional system, we identified constructs enabling significantly improved light-triggered transcriptional induction. In addition, we have improved the CRY2/CIB1-based light-inducible transcription with split construct optimization. The improvements regarding the FKF1/GI- and CRY2/CIB1-based systems will be widely applicable for the light-dependent control of transcription in mammalian cells.
INTRODUCTION
Tools enabling the spatiotemporal control of protein expression, localization and activity are powerful reagents for investigating the cellular and molecular mechanisms underlying various biological activities and the pathological basis of disease in live cells and animal models. To date, several optogenetic tools have been developed in order to control and/or monitor mammalian transcription (1–6), enzyme function (7,8), protein translocation (5,8–13), receptor tyrosine kinase activity (14,15) and neuronal activity (16,17). In order to develop an optogenetic tool that maintains a minimal background interaction in the dark, we previously developed a system using the light-induced binding of FKF1 (Flavin-binding, Kelch-repeat, F-box 1) to GIGANTEA (GI) (18). Flavin mononucleotide, a chromophore of the FKF1 family, is known to form a covalent bond with a cysteine residue on a light, oxygen or voltage (LOV) domain in FKF1, leading to interaction with GI upon blue-light exposure. Using a G128D variant of FKF1 family molecule ZEITLUPE (19), we demonstrated light-dependent regulation of a split Gal4-VP16 transcriptional system in mammalian cells (20). The FKF1/GI-based system was used in further applications (21,22). However, the induction of transcription using the existing FKF1/GI systems with light was modest (3- to 5-fold), such that it was not practical for application in vivo. Here we describe an optimized FKF1/GI transcriptional system using a newly identified mutant (H105L) and a single vector construct, which shows ∼300-fold induction with blue light. In addition, we have also optimized the CRY2/CIB1-based light-inducible transcription (∼100-fold induction with blue light). When compared with other existing optogenetic approaches such as CRY2/CIB1 to regulate transcription, this system using FKF1/GI is unique in showing a long-lived transcriptional response to a single pulse of light and extremely low background activity in the dark.
MATERIALS AND METHODS
Cell culture
Human embryonic kidney (HEK) 293T cells (ATCC, #CRL-3216) and NIH 3T3 cells (ATCC, #CRL-1658) were cultured in Dulbecco's Modified Eagle Media (DMEM, Invitrogen #10313021) supplemented with 1% GlutaMax I and 100 unit/ml penicillin and 100 μg/ml streptomycin (P.S., all reagents from Life Technologies) and 10% fetal bovine serum (FBS, not heat-inactivated, HyClone, #SH30071.03, Thermo Scientific) under normoxia (20% O2, 5% CO2, at 37°C) using HERAcell (Thermo Scientific). Human patient skin fibroblasts (Congenital heart disease patient, #CDH01–0634) were cultured in DMEM supplemented with 1% GlutaMax I, P.S. and 20% FBS under normoxia (20% O2, 5% CO2, at 37°C) using HERAcell. The patient fibroblasts were obtained by taking a small piece of skin at the incision at the time of surgery following a protocol approved by the Columbia Institutional Review Board (IRB, for W.K. Chung) (23). Mouse embryonic fibroblasts (MEF) were isolated from E12.5 mouse embryos. MEF were cultured in DMEM supplemented with 1% GlutaMax I, P.S and 10% FBS under normoxia (20% O2, 5% CO2, at 37°C) using HERAcell. Human fibroblasts, MEF and NIH3T3 cells were passaged using 0.25% trypsin + 0.03% ethylenediaminetetraacetic acid (EDTA) while HEK 293T cells were passaged using 0.05% trypsin + 0.03% EDTA solution (both from Gibco/Life Technologies).
Plasmid construction
Plasmid DNA constructs were generated using standard methods with restriction enzymes (New England BioLabs) and ligase (TaKaRa, DNA ligation kit, mighty mix) and polymerase chain reaction (PCR) using Phusion polymerase (Thermo Scientific, 2× master mix). The transient expression vector pcDNA3 (Invitrogen/Life Technologies) was used for all experiments to test the improved FKF1/GI and CRY2/CIB1 constructs. Random mutagenesis was conducted using GeneMorph II kit (Stratagene/Agilent) following the manufacturer’s instructions. Briefly, 0.5 μg of pcDNA3-HA-tagged-NLOV (WT)-VP16 was used as a template for PCR with Mutazyme II polymerase (50 μl reaction) using two primers:
‘BamHI-Kozak-HA-F’, 5′-cggatccgccaccATGGCTTACCCATACGATGTTCCAGATTAC-3′
‘FKF1-LOV-KpnI-R’, 5′-gcggtaccCGTTTCAGAGAAGACCTGTATCCCAATTAC-3′
PCR products were digested with BamHI and KpnI restriction enzymes and then subcloned into pcDNA3 (BamHI and NotI sites) along with a VP16 fragment (triple repeat of 13 amino acid residues) that was digested with KpnI and NotI. Site-directed mutagenesis was done using QuickChange II XL Site-Directed Mutagenesis Kit (Stratagene/Agilent) following the manufacturer’s instructions. Published LITE2.0 CRY2 and CIB1 constructs (4) (Addgene #47455 and 47458) were used as templates for PCR subcloning into pcDNA3. The Gal4 DNA binding domain (DBD, residues 1–148) was fused with the amino-terminus of CIB1 (NLS*, Δ318–334 aa) instead of the NEUROG2 TALE domain used in the LITE 2.0 system (4). All plasmids containing PCR products were confirmed by DNA sequencing (Eton Bioscience). The original CRY2 and CIB1 plasmids (Gal4BD-CRY2 and Gal4AD-CIB1) were kindly provided by Dr. C. Tucker (5). Using KpnI, NotI and XbaI sites, we subcloned CRY2 (or CRY2PHR fragment), CIB1, Gal4DBD and VP16 into the pcDNA3 vector for experiments in Figures 3 and 4 and Supplementary Figures S6, 8–10. Plasmids pVP-EL222 and its reporter pGL4.32 C120-Luc plasmids were kindly provided by Drs. L.B. Motta-Mena and K.H. Gardner (3).
Gal4 UAS was amplified from pFR-Luc plasmid (Promega) using Pfu Ultra (Stratagene/Agilent) with below primers:
‘BglII-UAS-F’, 5′-gccagatctATCTTATCATGTCTGGATCCAAGCTTGC-3′
‘UAS-NotI-R’, 5′-CAGTGCGGCCGCtttaccaacagtaccggaatgccaagc-3′
The PCR product of Gal4 UAS was digested with BglII and NotI enzymes and then subcloned into pcDNA3 vector fragment that was digested with BglII and NotI enzymes, thus replacing the CMV promoter in pcDNA3 with Gal4 UAS. The Gal4 UAS vectors containing mouse Sox9 cDNA, which was prepared from mouse brain RNA samples (TaKaRA/Clontech), mKate2, a monomeric red fluorescent protein, or destabilized green fluorescent protein (dsGFP) were prepared using NotI/XbaI or NotI/ApaI sites of the vector (Sox9 with NotI/XbaI, mKate2/dsGFP with NotI/ApaI). Mouse Myod1 full-length DNA fragment containing NotI, Kozak in the 5′ end and XbaI in the 3′ end was synthesized using the codon optimization program (Integrated DNA Technologies) and subcloned into the Gal4 UAS vector using the NotI and XbaI sites.
To prepare the 2A self-cleavage construct, we synthesized and subcloned KpnI-PacI-2A-AcsI-XbaI DNA fragment (Integrated DNA technologies) into pcDNA3 using KpnI and XbaI:
‘KpnI-PacI-2A-AcsI-XbaI’,
5′-gcGGTACCatcgatagTTAATTaaaattgtcgctcctgtcaaacaaactcttaactttgatttactcaaactggctgggg
atgtagaaagcaatccaggtccaGGCGCGCCGtagcta TCTAGA g-3′
Gal4DBD-NLOV (H105L)-HA and FLAG-GI-VP16 were subcloned using PCR, Phusion polymerase and KpnI/PacI or AscI/XbaI into pcDNA3-KpnI-PacI-2A-AcsI-XbaI vector. pcDNA3-Gal4DBD-NLOV (H105L)-HA-2A-FLAG-GI-VP16 and pcDNA3-FLAG-GI-VP16–2A-Gal4DBD-NLOV (H105L)-HA were generated. To generate internal ribosome entry site (IRES) version of constructs, we amplified IRES fragment using PCR, STOP-eGFP-Rosa26TV (Addgene #11739, as an IRES template), Phusion polymerase and below primers:
‘PacI-STOP-IRES-F’, 5′-gttaattaactagCCCCCCCCCCTAACGTTACTGG-3′
‘IRES-Kozak-ATg-AscI-R’,
5′-cggcgcgccCATggtggcTGTGGCCATATTATCATCGTGTTTTTCAAAGGAAAAC-3′
The 2A fragments in the above 2A constructs were replaced with the amplified IRES fragment using PacI and AscI to generate pcDNA3-Gal4DBD-NLOV (H105L)-HA-IRES-FLAG-GI-VP16 and pcDNA3-FLAG-GI-VP16-IRES-Gal4DBD-NLOV (H105L)-HA.
Luciferase assays
HEK 293T cells were plated at 0.5 × 10⁵ cell/well in 24-well plates (Corning) coated with poly-ornithine (Sigma-Aldrich, #P0421) and transfected the following day with 0.9 μg of DNA in 2 μl of Lipofectamine 2000 (Invitrogen/Life Technologies) into 100 μl of OptiMEM (Gibco/Life Technologies) in 400 μl of DMEM 10% FBS (PS-free). The standard ratio of FKF1: GI: pFR-Luc (Firefly): HSV-TK-Renilla Luc was as follows: 1: 1: 1: 0.01. However, the ratios for FKF1/GI and CRY2/CIB1 were examined to identify optimized conditions (Supplementary Figure S8D and E). The cells were then exposed to blue light (total 24 h, 2 min light/18 min dark cycle) 9.6 h after transfection at 37°C in a CO2 incubator (Thermo Fisher), also known as ‘protocol A’. The blue LED illuminator (447.5 nm, 0.5 mW, 6.25 μW mm−2) with heat control and a fan was designed and developed by J. Jung (Supplementary Note). Luciferase (Luc) activity levels were assayed 14.4 h after illumination was terminated using Dual Luciferase assay kit and a Veritas 96-well luminometer (Promega) following the manufacturer's instructions. Other illumination protocols were also examined to compare the FKF1/GI-based system to CRY2/CIB1-based system (Supplementary Figure S8F–I). The luminescence of each sample was measured by integrating for 2 s after injection of the Luc substrate. As a negative control, a light-insensitive FKF1 NLOV mutant (MT, C91A/R92D/Q163L) was used.
MEF were plated at 0.5 × 10⁵ cell/well in 24-well plates (Corning) coated with Geltrex® (Thermo-Fisher/Life Technologies) and transfected the following day using 0.5 μg DNA, 1 μl P3000 and 1.5 μl Lipofectamine 3000 (Invitrogen/Life Technologies) into 50 μl of OptiMEM in 400 μl of DMEM 10% FBS (PS-free). The DNA was maintained at a ratio of GI-VP16-IRES-Gal4DBD-NLOV(H105L): pcDNA3 empty vector: pFR-Luc (Firefly): HSV-TK-Renilla Luc as follows: 1: 1: 1: 0.01. The cells were illuminated and tested using the same illuminator and Luc assay protocol as the HEK 293T cells while being exposed to blue light (total 12 h, 20 s light/60 s dark cycle) 12 h after transfection at 37°C in a CO2 incubator (Thermo Fisher), also known as ‘protocol B’.
Expression profiling
HEK 293T cells were plated at 0.5 × 10⁵ cell/well in 24-well plates coated with poly-ornithine and transfected the next day with 0.9 μg of DNA in 2 μl of Lipofectamine 2000 in 100 μl of OptiMEM. In case of live cell imaging to detect mKate2, glass coverslips (15 mm diameter, Warner Instruments) were used in the 24-well plates. The ratio of FKF1: GI: Gal4-UAS-dsGFP/mKate2 was as follows: 1: 1: 1. The ratio of CRY2: CIB1: Gal4-UAS-dsGFP/mKate2 was as follows: 5: 1: 3. The same illumination conditions used for Luc assays were used for fluorescent protein reporters, following the results of illumination protocol comparisons. To harvest cell lysates for western blotting, a lysis buffer containing 1% Triton X-100, 150 mM NaCl, 50 mM Tris–HCl (pH 7.4) and 1% protease inhibitor cocktails (all, Sigma-Aldrich) was used. Cells were incubated for 10 min at room temperature with gentle rocking. After incubation, the samples were placed on ice for 20 min to complete permeabilization. To remove cell debris, lysates were centrifuged at 12 000 rpm for 10 min at 4°C, then moved to new tubes. An equal volume of 2× sodium dodecyl sulphate (SDS) sample buffer (8M Urea, 2% SDS, 10% 2-mercaptoethanol, 40 mM Tris-HCl, pH 7.4) was added to the lysate samples and boiled for 5 min. SDS-polyacrylamide gel electrophoresis was performed using Tris-Glycine-based gels (Bio-Rad) containing either 5 or 10% Acrylamide-Bis (Fisher Scientific), and the protein samples were then transferred to Polyvinylidene difluoride (PVDF) membranes using XCell SureLock® Mini-Cell and XCell II™ Blot Module system (Life Technologies). Primary antibodies to GFP (MBL, #598, 1/4000 dilution), β-tubulin (Sigma-Aldrich, #t5201, 1/4000 dilution) and Sox9 (Cell signalling technology, #82360, 1/1000 dilution) were used. The mouse secondary antibody (Invitrogen, #31430, 1/8000 dilution) and rabbit secondary antibody (Thermo Scientific, #31460, 1/8000 dilution) was used. SuperBlock Blocking Buffer (PBS, phosphate-buffered saline-based, Thermo Scientific, #37515) was used for blocking and antibody incubations of the PVDF membranes in trays (Sigma-Aldrich, # BAF451000001). Pierce ECL Western blotting substrate (Thermo Scientific, #32209) was used for chemiluminescent reaction. Western blot bands were quantified through Fiji/Image-J by deducting the background from the signal bands. This was then normalized to the β-tubulin as an internal control to quantify the light and dark protein induction for each optogenetic system.
Quantitative RT-PCR was conducted using RNA from illuminated HEK 293T cells following the illumination ‘Protocol B’. The RNA was prepared using the RNeasy Mini kit and RNase-Free DNase set (Qiagen). cDNA was synthesized using the SuperScript III First-Strand Synthesis System for RT–PCR (Life Technologies). The cDNA (21 μl) was diluted with DNase-free water (Invitrogen) at a ratio of 1:5 for a final volume of 105μl. One μl of each sample was used for qPCR analysis. SYBR Advantage qPCR Premix (Clontech/TaKaRa Bio) and StepOnePlus real time PCR systems (Life Technologies) were used for qPCR.
The primer sets for detecting the SOX9/Sox9 (both human and mouse), human Aggrecan, human LXH2, human GAS1, human TLE4, mouse MyoD1 (codon-optimized) and human GAPDH were as follows:
SOX9/Sox9 Forward 5′- AGGAAGCTGGCAGACCAGTA-3′, Reverse 5′- CTCCTCCACGAAGGGTCTCT-3′; Aggrecan Forward 5′-TCTGGGTTTTCGTGACTCTGA-3′, Reverse 5′-TCCACTTGATTCTTGGGGCC-3′; LXH2 Forward 5′-TTTGCCATTAACCACAACCC-3′, Reverse 5′-TGTTTTCCTGCCGTAAGAGG-3′; GAS1 Forward 5′-GAAACTCCCAACTCGTCTGC-3′, Reverse 5′-CCCAACCCTTCAAATTGCTA-3′; TLE4 Forward 5′-GCTCTAGGAGGTCAGTCCCA-3′, Reverse 5′-CTTCTCAGCACCTCGGAAAC-3′; codon-optimized MyoD1 Forward 5′-GGCAGAACGGGTATGATACAG-3′, Reverse 5′-GGAAATCCTCTCCACGATTGAG-3′; GAPDH, Forward 5′-GATGACATCAAGAAGGTGGTGA-3′, Reverse 5′-GTCTACATGGCAACTGTGAGGA-3′. The CT value of each sample at 50% of the amplification curve was used and GAPDH was used to normalize the expression of the genes.
The fluorescence activated cell sorting (FACS) procedure was conducted as follows. Illuminated cells, cultured as mentioned above in a 24-well plate, were detached with trypsin (0.25% trypsin + 0.03% EDTA for NIH 3T3 cells and human fibroblasts while HEK 293T cells were detached using 0.05% trypsin + 0.006% EDTA solution). DMEM (500 μL, 10% FBS, for NIH 3T3 and HEK 293T cells) and 20% FBS DMEM (for human fibroblasts) were added to the trypsinized cells. Following this, the cells were harvested manually and filtered through a single cell filter tube (Corning, #352235) and centrifuged at 0.2 rcf for 2 min at room temperature. The media was then aspirated and the cells were resuspended in 1×PBS. The cells were then sorted on a BD FACS Canto II using the FITC and PE-A lasers. The resulting data was analyzed using the FlowJo software v10.
Spatiotemporal control of live cell illumination was conducted using a custom Nikon microscope Ti-E (Andor Zyla sCMOS camera; Nikon CFI Plan Apo Lambda, 20×/0.75/1.0 mm) with automated motorized stage and environmental controls set at 5% CO2, 20% O2 and 37°C (TOKAI HIT). About 1 × 10⁵ cells were plated on a 35-mm glass bottom (MatTek Corporation, P35G-1.5–20-C) dish coated with poly-ornithine. Twenty four hours after plating, the cellular media was replaced with 10% FBS-supplemented phenol red-free DMEM (GIBCO/Life Technologies, #3105–028) and were transfected with 3.6 μg DNA and 8 μl Lipofectamine 2000 per dish. These cells were transferred directly to the microscope stage and illuminated using a digital micromirror device (DMD) set at 475 nm and 36 μW/mm2 following ‘Protocol B’. These cells were imaged after the illumination protocol was completed using TXRED (560 nm) and GFP (470 nm).
MEF illumination and immunocytochemistry
MEF were plated on a 24-well plate with a glass coverslip coated with Geltrex®. These samples were transfected the following day using 0.5 μg DNA, 1 μl P3000 and 1.5 μl Lipofectamine 3000 in each well. The cells were then illuminated 12 h after transfection with ‘Protocol B’. Subsequently, the samples were cultured in DMEM supplemented with 1% GlutaMax I, P.S. and 2% horse serum (Gibco) under normoxia (20% O2, 5% CO2, at 37°C) using HERAcell (24). The media was changed every 2 days in a dark room for 5 days after which they were prepared for immunocytochemistry experiments. Illuminated MEF were fixed in freshly prepared fixing solution (PBS with 4% paraformaldehyde and 2% sucrose) for 15 min. This was then blocked with blocking solution (PBS with 3% BSA and 0.1% Triton X-100) followed by overnight incubation with mouse anti-MyoD1 monoclonal antibody (Abcam, ab16148). The samples were then stained with anti-mouse Alexa 488 secondary antibody (Thermo-Fisher #: A-11001) followed by a Hoechst 33258 stain (Invitrogen Cat#: H3569) and mounted using Aquapoly (Polysciences #18606). The samples were imaged with GFP (470 nm) and DAPI (358 nm) filters and Nikon NIS element using the custom Nikon microscope Ti-E.
Mouse study
Experiments using mice were performed in accordance with the Guidelines for Care and Use of Laboratory Animals as stated by Columbia University IACUC. In all the experiments, we used 4–6 week-old C57BL/6 mice (both male and female from Charles River). The abdominal surface fur of mice was removed using a hand trimmer. The fur-removed mice were rested for 24 h at least in a cage, and intraperitoneally injected with cDNAs encoding pcDNA3-Gal4DBD-NLOV (H105L)-HA, pcDNA3-FLAG-GI-VP16 and Gal4-UAS-dsGFP in PBS according to the hydrodynamic procedure (25). The total amount of injected DNA and the volume of delivery solution are 0.5 μg and 0.1 ml per mouse weight (g), respectively. After the hydrodynamic injection of plasmid DNA, the mice were kept in the dark for 12 h, and then illuminated with an LED light source (470 ± 20 nm, 1.2 mW) for 3 min in a cage. After illumination, the mice were kept in the dark to recover. Twenty hours after the plasmid DNA injection, the mice were sacrificed using the standard procedure approved in our animal protocol and their livers were immediately harvested for fluorescent imaging with fluorescent stereoscope (Zeiss).
Homology modeling
The FKF1 LOV domain was determined to be between amino acids 1 and 168 (20). This amino acid sequence was used to match with known templates in SWISS-MODEL (Biozentrum) that produced a high identity with the putative blue right receptor (1.n9o.1.A). This was used to generate a homology model that was visualized using CueMol2.
Statistical analysis
The statistical significance (P-value) used to compare the samples with/without light exposure was determined using an F-test and Student’s t-test (Excel, Microsoft). The statistical significance of the comparison of multiple samples for the Luc assay was computed using the Bartlett test and one-factor ANOVA with a Bonferroni/Dunn test (Statcel, OMS and Excel, Microsoft).
RESULTS
Screening of FKF1 mutants to improve light-induced transcription
To identify novel mutants that could demonstrate low basal activity in dark conditions but higher induction of transcription under blue light, we carried out random mutagenesis of the amino-terminus and LOV domain (NLOV) in the FKF1 gene (Figure 1A, Supplementary Table S1 and Figure S1) and screened the functionality of the constructs in the split Gal4-VP16 system (26), using a Gal4 UAS-Luc reporter. To conduct illumination in live mammalian cells, we have developed an illumination device that allowed us to monitor and control temperature, CO2 and illumination (Figure 1B and Supplementary Figure S2).
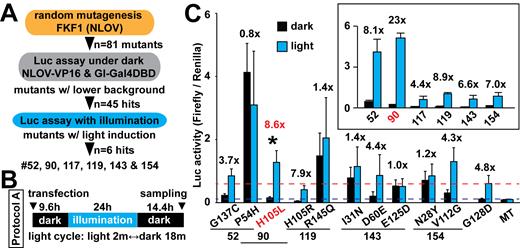
Test of FKF1 mutants. (A) Strategic plans and outcomes of FKF1 mutant screens. The amino-terminus and LOV domain of FKF1 (NLOV) was used as a template for the mutagenesis. Luc assay was conducted along with GI fused with Gal4 DBD and Gal4-UAS Firefly Luc reporter in HEK 293T cells. The herpes simplex virus thymidine kinase (HSV-TK) promoter-Renilla Luc plasmid was used as a control to normalize Firefly Luc activity. (B) Illumination protocol (Protocol A) used for the Luc assay is indicated (blue LED, 447.5 nm, 0.5 mW, 6.25 μW/mm2). (C) Luc assays using six positive candidates that showed low basal background and significant induction of Luc with light (inlet, n = 3 in two independent experiments, mean ± s.d.). Each mutation identified was tested (*P < 0.05 n = 10 in seven independent experiments, mean ± s.d.). The H105L mutant that was identified as mutant #90 significantly increased Luc induction with light compared to the G128D mutation. Blue dashed line shows the background of the G128D construct. Red dashed line shows the Luc activity with light in the G128D mutant. MT, a light-insensitive mutant.
We then conducted a Luc activity assay screen to compare the newly discovered 81 candidates with the previously used mutant, G128D (20) and wild-type (WT) in dark conditions to identify novel mutants that have a lower background level of Luc transcription than WT. Of the 81 initial mutants, 45 showed background levels comparable with G128D mutant in the dark (Supplementary Figure S1C). Six of these 45 mutants showed similar or higher levels of induction of Luc expression than the G128D mutant, following our previously established protocol herein called ‘Protocol A’ (Figure 1C, inset and Supplementary Figure S3). As most of these variants contained multiple point mutations, we generated and tested each of the point mutations individually in HEK 293T cells along with GI-Gal4DBD and the Luc reporters. FKF1 H105L exhibited significantly higher induction of Luc with light while maintaining a low dark background signal, compared with the original FKF1/GI system (Figure 1C). The H105L and G128D constructs were expressed equivalently in the cells, as examined with western blotting (Supplementary Figure S4A).
Optimization of FKF1/GI fusion combinations
One limitation of the original FKF1/GI system is the large size of the GI protein with 1,173 amino acid (aa) residues. To address this concern, we attempted to identify a shorter truncation of GI that retained a light-dependent interaction with FKF1. We first prepared and validated the expression of five different truncations of GI fused with the Gal4DBD through western blot (Supplementary Figure S4B and C) and then tested these constructs with NLOV (G128D)-VP16 and Luc reporters in HEK 293T cells (Figure 2A and B). While the 1–960 aa fragment retained some light-dependence, all other shorter truncations eliminated light dependence to bind NLOV. The full-length GI construct still showed better function than the shorter fragments with similar dark background but higher light induction. Therefore, we used the full-length GI construct in all further experiments.
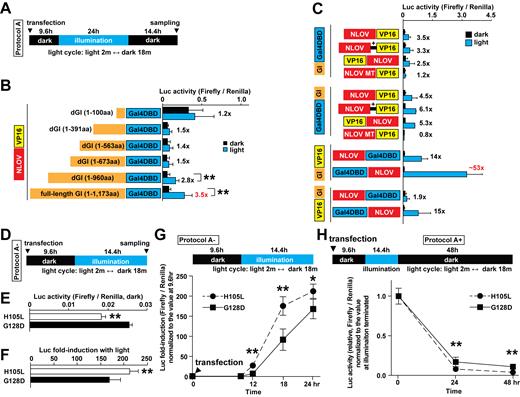
Test of truncated GI variants and optimization of FKF1/GI fusion combinations. (A) Illumination protocol used for the Luc assays is indicated (blue LED, 447.5 nm, 0.5 mW, 6.25 μW/mm2). (B) A summary of Luc assay results to test the various truncated GI constructs fused with Gal4 DBD (**P < 0.01, n = 3–4 in two independent experiments, mean ± s.d.). The full-length (1173 amino acids, aa) and deleted GI (1–960 aa) demonstrated significant increase in Luc activity with light compared to the dark condition. The smallest fragment of GI (1–100 aa) showed high basal binding to NLOV (G128D)-VP16 under dark. (C) Optimization of fusion combinations of FKF1 (NLOV, G128D), GI (full-length), Gal4DBD and VP16 (n = 6–15 in five independent experiments, mean ± s.d.). +, a Gly/Ser linker. (D) Illumination protocol used for Figure 2E–G (blue LED, 447.5 nm, 0.5 mW, 6.25 μW/mm2). (E) The H105L mutation in Gal4DBD-NLOV significantly reduced background in the dark compared to the G128D mutation 24 h after transfection (**P < 0.01, n = 8 in three independent experiments). GI-VP16 was used. (F) The H105L mutation in Gal4DBD-NLOV significantly increased induction of Luc expression in the illumination compared to the G128D mutation 24 h post-transfection (**P < 0.01, n = 8 in three independent experiments). The light-induced transcription system using the H105L mutant significantly increased On- (G) and Off-kinetics (H) compared with the G128D mutation (*P < 0.05, **P < 0.01, n = 6–8 at each time point in three independent experiments).
We next examined the configuration of the DBD and activation domain (AD) fusions with the FKF1/GI proteins for optimal light-dependent transcriptional regulation. We explored different N- and C-terminal fusions of NLOV (G128D) and full-length GI with the Gal4DBD and VP16 AD components (Figure 2C). After testing 12 possible configurations, we found that Gal4DBD-NLOV (G128D) and GI-VP16 constructs enabled significantly higher induction of Luc with light than the original tested configuration, NLOV (G128D)-VP16 and GI-Gal4DBD (20). Combined with our results from the mutagenesis screen, these experiments led to the optimized FKF1/GI-based system using Gal4DBD-NLOV (H105L) and GI-VP16 combination, which could lead to slightly better induction, lower background leak compared to the G128D mutant (Figure 2D–H). In addition to these screens, we tested several modifications to the constructs in this system; for example, epitope tags such as FLAG and hemagglutinin (HA) can be added (Supplementary Figures S4D, S5A and B).
Comparison of the FKF1/GI-based system to LITE2.0 system
To evaluate our optimized Gal4DBD-NLOV (H105L)/GI-VP16 system, we compared it to other currently available light mediated transcriptional systems. We tested the LITE2.0 system using CRY2PHR and CIB1 (NLS*, Δ318–334 aa), which were previously applied to regulate transcription at endogenous sites in mammalian cells (4). To compare these systems in the same experimental conditions, we prepared CRY2PHR and CIB1 (NLS*, Δ318–334 aa) constructs with Gal4DBD in the same mammalian expression vector pcDNA3 that were used for the NLOV/GI-based system. We then transfected the NLOV/GI or CRY2/CIB1 constructs along with the Gal4 UAS-Luc reporters into HEK 293T cells. The Luc assay results showed that the CRY2/CIB1 constructs led to significantly higher basal background activity in the dark when compared with the NLOV/GI system (Supplementary Figure S6A–C). To examine a different reporter, we examined expression of a Gal4 UAS-regulated red fluorescent protein, mKate2. While the RFP-positive cells were detected in the CRY2/CIB1-based system under the dark condition (Supplementary Figure S6D), there were no major differences in RFP expression between the NLOV/GI- and CRY2/CIB1-based systems with illumination, demonstrating that the NLOV/GI-based system leads to a similar level of RFP expression with ‘Protocol A’ illumination as the CRY2/CIB1-based system but significantly lower basal background in the dark.
To compare protein expression between the two systems more precisely, we prepared another Gal4-UAS reporter to express destabilized green fluorescent proteins (dsGFP) for further protein quantification using Western blot experiments. The results demonstrated that there was significantly higher leak of dsGFP proteins in the dark in the CRY2/CIB1-based system compared to the NLOV/GI-based system (Supplementary Figure S6E and F). Taken together, these results demonstrated that the NLOV/GI-based light-inducible transcription had a much lower basal background leak in the dark but a similar induction of the target gene expression with light in mammalian cells, compared to the CRY2/CIB1-based system.
Optimization of the CRY2/CIB1-based system
In the process of comparing the two systems, we modified the CRY2/CIB1-based system that was derived from a previous report for a more precise comparison (4). The CRY2/CIB1-based system called LITE2.0, which was previously used with the transcription activator-like effector (TALE) system, may not be fully optimized for the Gal4 UAS system. We thought its format could be improved to fit the Gal4 UAS system better by finding the best fusion protein combination. Therefore, we tested a variety of combinations of CRY2/CIB1 fusion constructs and found that CRY2-VP16 and CIB1-Gal4DBD had the highest induction of Luc expression with light compared to the other constructs (Figure 3).
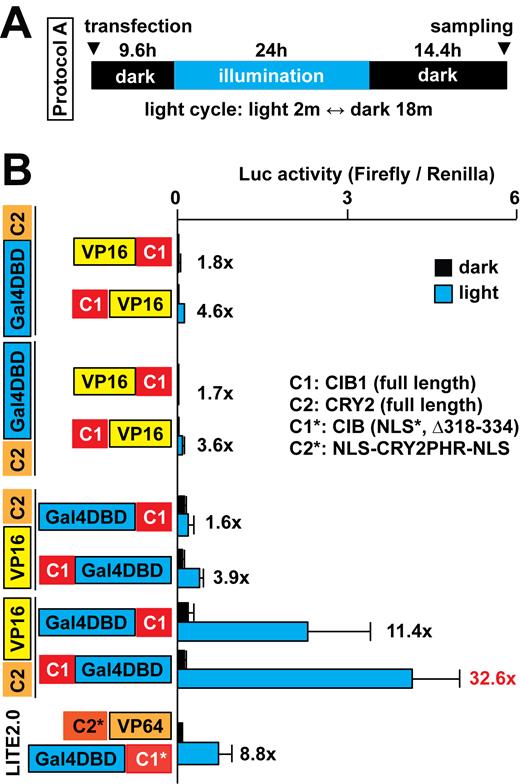
Optimization of the CRY2/CIB1-based system to control transcription with light. (A) The illumination protocol used is shown. (B) Optimization of fusion combinations of CRY2 (C2), CIB1 (C1), LITE2.0 constructs, Gal4DBD and VP16 (n = 7–8 in three independent experiments, mean ± s.d.).
Comparisons of the optimized FKF1/GI-based system to the other light-inducible systems
In parallel, other light-inducible systems such as EL222 and VVD/LightOn (3,25) were compared to the FKF1/GI-based system (Supplementary Figure S7 and Table S2). To test the FKF1/GI, EL222 and VVD systems, we have used another illumination protocol called ‘Protocol B’, following the authors’ advice (3). The VVD and EL222 showed significantly higher Luc activity in the dark and lower induction. Unexpectedly, we found that Protocol B (3) led to a significant increase induction of the FKF1/GI-based systems (up to 91-fold, Supplementary Figure S7). Therefore, for further characterization of the light-inducible systems, we focused on comparisons of the FKF1/GI- and CRY2/CIB1-based systems using illumination Protocol B.
Comparisons of the optimized FKF1/GI-based system to the optimized CRY2/CIB1-based system
First, we compared the background leak in dark conditions of the optimized NLOV/GI with CRY2/CIB1 (Figure 4A–C). In the dark, we found that the background level of the FKF1/GI-based systems 48 h post-transfection was still low, while the CRY2/CIB1-based systems showed significantly higher reporter activity at that same time point in the dark. Next, to quantify fluorescent protein expression of each system in live cells, we tested the FKF1/GI-based systems with the Gal4 UAS-RFP (mKate2) reporter. We found that there was no obvious leak of the RFP expression in the live cells kept in the dark with the FKF1/GI-based system. However, some RFP positive cells are observable when using the CRY2/CIB1-based system evidencing an increased background activity of the latter system (Figure 4D). Thus, the CRY2/CIB1 system may not be useful for long-term expression such as in vivo applications using mouse models. In addition, we found that the FKF1/GI-based system had significant Luc induction (4- to 5-fold) even 48 h after illumination was terminated (Supplementary Figure S8A and B). These results support the previous study (20), confirming that the system does not require continuous exposure of live cells to light, which helps to reduce potential phototoxic effects of blue light compared to the other systems.
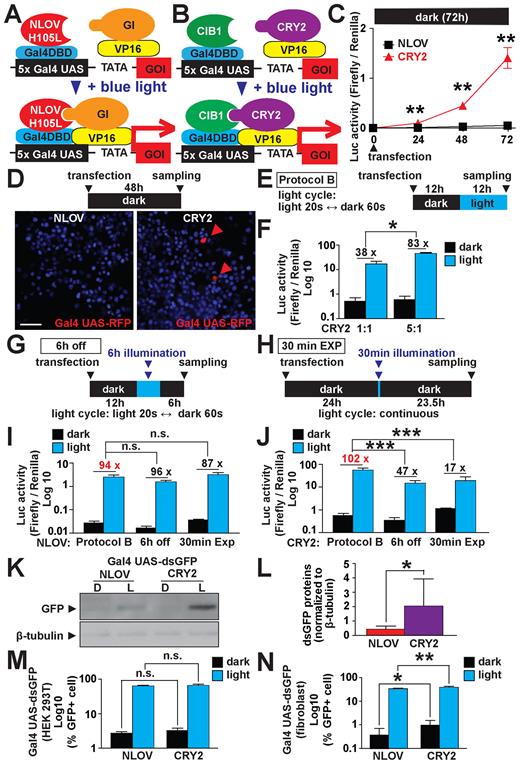
Comparison of optimized FKF1/GI-based system to optimized CRY2/CIB1-based system. (A) Schematic representation of optimized NLOV/GI-based light-induced transcription. (B) Schematic representation of optimized CRY2/CIB1-based light-induced transcription. (C) Comparison between the leakiness of NLOV/GI and CRY2/CIB1 when kept in the dark. (**P < 0.01, n = 4–14, mean ± s.d.). The NLOV/-GI-based system showed significantly lower signal under dark conditions compared to the CRY2/CIB1-based system. (D) Fluorescent images using the NLOV- and CRY2-based systems in HEK 293T cells to express red fluorescent proteins (RFP, mKate2) in live cells 24 h post-transfection. Hoechst 33 285 was used for nuclear staining. Scale bar, 20 μm. Red arrowheads, mKate2-positive cells. (E) Illumination protocol used in (F), I–N (blue LED, 447.5 nm, 0.5 mW, 6.25 μW/mm2). (F) DNA ratio optimization of the CRY2/CIB1-based system showing an increase in normalized Luc signal when using 5:1 Cry2-VP16:CIB1 (*P < 0.05, n = 3, in three independent experiments, mean ± s.d.). (G) Illumination protocol used in I and J (6 h off) using a blue LED, 447.5 nm, 0.5mW, 6.25 μW/mm2. (H) Illumination protocol used in I and J (30 min EXP) using a blue light source (470 ± 20 nm, 1.2 mW). (I and J) Luc signal of NLOV/GI and CRY2/CIB1 respectively after variable illumination times followed by darkness. (n.s., non significant ***P < 0.001 n = 12 in two independent experiments for 6 h off and 30 min EXP, n = 27 and n = 58 for CRY2 and FKF1 Protocol B, respectively as compiled legacy data was used, mean ± s.d.). CRY2/CIB1 has a significant decrease in induction when kept in dark after illumination. (K) Western blotting using the NLOV/GI-based and CRY2/CIB1 systems expressing destabilized green fluorescent protein (dsGFP) in HEK 293T cells with Protocol B. A housekeeping molecule, β-tubulin, was examined as an internal control in the cells. D, dark. L, light. (L) Quantification of dsGFP proteins to compare the NLOV/GI-based and CRY2/CIB1 systems. The expression of dsGFP was normalized to β-tubulin expression (*P < 0.05, n = 8, mean ± s.d.). The CRY2/CIB1 system demonstrated a significantly increased induction of dsGFP when compared with the FKF1/GI-based system. (M and N) FACS results for NLOV/GI and CRY2/CIB1 systems transfected into HEK 293T cells and human patient primary skin fibroblasts, respectively (n.s., non significant *P < 0.05, **P < 0.01, n = 6, mean ± s.d.). CRY2/CIB1 has a higher percentage of GFP+ cells in dark and light condition (Protocol B) in the human patient fibroblasts. Representative raw FACS analyses are shown in Supplementary Figure S9.
We next optimized the DNA transfection ratio of FKF1 to GI and CRY2 to CIB1. Interestingly, we found that the FKF1/GI system did not significantly benefit from any other DNA ratios tested. However, the CRY2/CIB1 system showed a significantly increased induction when using the 5:1 CRY2:CIB1 DNA ratio (Figure 4E and F; Supplementary Figure S8C–E). Therefore, we carried out the subsequent experiments with this new DNA ratio to summarize the results using optimized FKF1/GI- and CRY2/CIB1-based system.
To test the reversibility of both systems, we exposed the cells to either 6 h of illumination cycles followed by 6 h of darkness or a 30-min illumination followed by 23.5 h in the dark (Figure 4G and H). From these experiments, we found that the FKF1 system did not show any significant decrease in induction while the CRY2/CIB1 system had a significantly less induction when kept in the dark after stimulation (Figure 4I and J). Next, we tested the dependence of each system to the amount of light to which the cells were exposed. This was accomplished by decreasing the illumination length of each cycle in Protocol B to 8 and 2 s illumination with 72 and 78 s of darkness, respectively (Supplementary Figure S8F and G). FKF1/GI was not affected by the decrease from 20 to 8 s illumination but was detrimentally affected by the decrease to 2 s (Supplementary Figure S8H). CRY2/CIB1, on the other hand, showed a significant decrease in induction when decreasing the illumination times to 8 and 2 s (Supplementary Figure S8I).
To assess these optogenetic systems outside of the Luc assay, we used a Gal4 UAS-dsGFP reporter and gauged their activity through western blot (Figure 4K and L). Here, the data demonstrates that the CRY2/CIB1 system has a significantly higher increase in dsGFP expression as compared with FKF1/GI. In addition, we used FACS to quantify the expression of Gal4 UAS-dsGFP in various mammalian cells: HEK 293T cells, human patient skin primary fibroblasts and NIH 3T3 cells as controlled by each system (Figure 4M and N and Supplementary Figure S9). From this test, we found that the there was no difference in HEK 293T cells for either system while the expression of CRY2/CIBI had a higher population of cells expressing dsGFP in human fibroblasts and NIH 3T3 cells.
Further biological applications of the FKF1/GI-based system in vitro
We were interested in testing the utility of the FKF1/GI system in controlling the expression of transcription factors. A recent publication noted that Sox9 is an important regulator in the differentiation of human pluripotent stem cells to cholangiocytes (27). Therefore we tested whether the FKF1/GI system can increase the expression of Sox9 in HEK 293T cells. To do this, we expressed Gal4 UAS- Sox9 and illuminated the cells following protocol B. These experiments showed that the FKF1/GI system is capable of a significant induction of Sox9 expression in this system (Figure 5A–C). To validate light-induced Sox9 expression with light further, we conducted quantitative RT-PCR and observed significantly increased expressions of Sox9 target genes such as Aggrecan, LXH2, GAS1 and TLE4 in the illuminated cells (Figure 5D). These results reveal that the improved FKF1/GI-based system is capable of light-dependent induction of target gene expressions in mammalian cells.
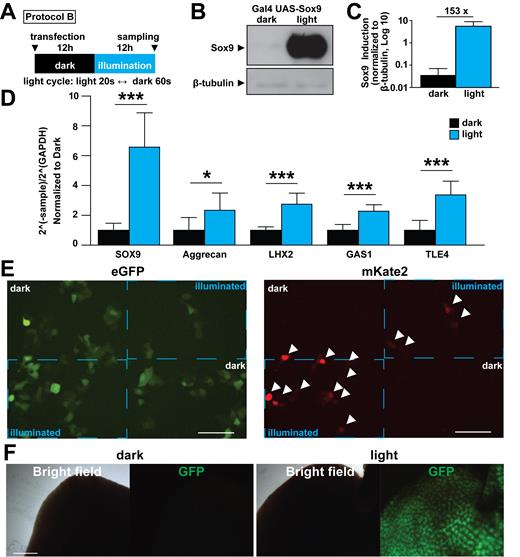
in vitro and in vivo utilization of NLOV-GI optogenetic system. (A) Illumination protocol used in B–D is indicated (blue LED, 447.5 nm, 0.5 mW, 6.25 μW/mm2). (B) Representative western blotting image of NLOV/GI inducing Sox9 gene expression in HEK 293T cells. (C) Quantification of Sox9 protein bands in dark and light conditions. The expression of Sox9 was normalized to β-tubulin expression (n = 8, mean ± s.d.). (D) Quantification of SOX9, Aggrecan, LHX2, GAS1 and TLE4 transcripts in HEK 293T cells with NLOV/GI-based Gal4 UAS Sox9 in dark and light conditions using quantitative RT-PCR (*P < 0.05, ***P < 0.001 n = 8, mean ± s.d.). (E) Fluorescent images of live cells transfected with NLOV/GI, Gal4 UAS mKate2 with eGFP as a transfection control. Dotted blue boxes delineate the illuminated sections of the cell area showing spatial control of NLOV/GI. White arrowheads indicate mKate2 positive cells (blue Digital Micromirror Device 475 nm, 36 μW/mm2). Scale bar, 100 μm. (F) Representative images of mouse livers from mice after illumination (dark (left), light (right)) using Gal4-UAS-dsGFP with Gal4DBD-NLOV (H105L) and FLAG-GI-VP64 with HTV plasmid injection method (n = 6). Scale bar, 1 mm.
Then, we examined whether we could spatially control the expression of FKF1/GI using the Gal4 UAS-regulated expression of mKate2 red fluorescent proteins together with GFP plasmid as a transfection control. The FKF1/GI system showed expression of mKate2 only in the stimulated regions that are delineated by the dashed blue boxes, with no leak outside of these areas (Figure 5E). This result reveals that spatiotemporal control of transcription is feasible using the optimized FKF1/GI-based system.
Further application of the FKF1/GI-based system to in vivo mouse tissues
Finally, we tested whether the FKF1/GI-based system can be applied in in vivo applications such as a mouse animal model. Using a hydrodynamic tail vein (HTV) injection method (25), we transiently transduced Gal4DBD-NLOV (H105L) and GI-VP64 in live mouse livers. Twelve hours after the HTV injection, the abdomen of the transfected mice were exposed to blue light. Because the binding of NLOV (H105) to GI is irreversible, we used a LED array for one-shot illumination (3 min) and then returned the mice to their darkened cages. We found that the livers of illuminated mice expressed GFP 12 h after illumination while no expression of GFP proteins was detected in mice kept in the dark. On the other hand, CRY2/CIB1-based system did not successfully induce GFP in liver tissues (Figure 5F and Supplementary Figure S10A). These results demonstrate that the FKF1/GI-based transcription system is functional in in vivo mouse models.
DISCUSSION
Here, we describe an improved system for the spatiotemporal control of transcription in mammalian cells with light, based on the interaction between FKF1/GI. To do this, we conducted random mutagenesis of FKF1 (NLOV fragment), optimized the fusion constructs and compared this improved system with other existing tools that ultimately allowed us to improve transcription control with light in mammalians without a significant increase in unwanted background leak. Based on the results of mutagenesis and optimization of NLOV and GI constructs fused with Gal4DBD and VP16, we concluded that the H105L mutation in Gal4DBD-NLOV with GI-VP16 is a significantly improved version of the FKF1/GI-based system for light-induced transcription in mammalians.
Of note, using a homology model of the LOV domain (Supplementary Figure S10B), it is apparent that H105 is located in a highly flexible loop (99–107aa), which was determined to be essential for NLOV binding to GI (data not shown). Interestingly, this loop is unique to the FKF1 family (FKF1, ZEITLUPE and LKP2) compared to other LOV domain-containing molecules. In the previous study, we found that the loop alone did not bind GI (20). On the other hand, the previous mutation G128D is located in the beta-sheet binding cleft of the protein. Due to its location, the H105L mutation may affect the location of the flexible loop. One potential possibility is that it is bound to the binding cleft before the cysteinyl bond is established. Once this bond is formed, the loop may be released from the domain's binding cleft and allowed to bind GI. This sequestration of this integral loop may explain the extremely low background of the mutant. Unexpectedly, another mutant hit #119 contains the H105R mutation, which also demonstrates slightly improved Luc induction (7.9×) compared to the G128D mutant (4.8×) in the tested NLOV-VP16 construct with GI-Gal4DBD (Figure 1C and Supplementary Table S1). These results suggest that the H105 residue in the loop could be crucial for FKF1 binding to GI. However, the mechanism by which the H105L mutation improved the light-inducible systems remained unclear. To begin to address this concern, we compared the fold-induction of Luc using the H105L and G128D mutations in Gal4DBD-NLOV with GI-VP16. We found that the H105L mutation reduced the basal background leak in the dark and increased on/off kinetics more than the G128D mutation (Figure 2D–H). Interestingly, we found that the double mutant (G128D and H105L) showed no induction with light as compared to the H105L mutant (Supplementary Figure S10C and D). Further computational simulations and structural biophysical experiments should be required to unveil the mechanism underlying light-dependent binding of FKF1 to GI.
In this study, the NLOV/GI split construct and illumination optimizations were also essential for improving the FKF1/GI-based light-inducible transcription in mammalian cells. Therefore, when we used the optimized constructs and illumination (Protocol B), we found that there was no difference in Luc induction between VP16 and VP64 constructs (Supplementary Figure S10E). In addition to the FKF1/GI-based system, we then optimized the CRY2/CIB1 system, using similar strategies for split construct, transfection and illumination optimizations. The optimized CRY2/CIB1 system showed a comparable induction of firefly Luc with the FKF1/GI (H105L). When the Luc signal with light is normalized to dark, we found an increase of ∼100-fold. Of note, the CRY2/CIB1 system had a consistently higher light-dependent induction with a notable amount of leakiness as shown by the higher Luc signal in dark compared to the FKF1/GI-based system. This may make the CRY2/CIB1 a more attractive option in systems where a higher amount of transcription induction is required with spatiotemporal control.
For further improvement of the FKF1/GI-based system, we examined whether single vector constructs containing both FKF1 and GI constructs improves gene transduction compared to co-transfection of the FKF1 and GI plasmids. Interestingly, we found that the new IRES constructs demonstrated >200-fold induction of Luc with light while the 2A peptide-containing constructs did not work (Supplementary 11A). The best IRES-based single construct (FLAG-GI-VP16-IRES-Gal4DBD-NLOV H105L-HA) showed significantly improved induction with light (∼292-fold) compared to the former results using co-transfection of two plasmids (∼94-fold, Gal4DBD-NLOV H105L-HA and FLAG-GI-VP16). Using the new IRES construct, we performed light-induced Myod1 expression in MEF because Myod1 overexpression could induce trans-differentiation of MEF into myoblasts (24). We confirm that illumination could increase the expressions of Luc reporter and Myod1 transcripts in MEF using the new IRES-based plasmid (Supplementary Figure S11B and C). Also, we observed Myod1 protein expression and morphological changes of MEF following Protocol B illumination after 5 days (Supplementary Figure S11D). These results demonstrate further evidence that our improved FKF1/GI-based system is capable of light-induced transcription that is used for biological applications.
One of the key features of the FKF1/GI-based system is the non-reversible interaction of FKF1 with GI upon stimulation with light (18,20) while other systems such as CRY2/CIB1 are reversible (28). Unlike the CRY2/CIB1 system, the FKF1/GI system does not require continuous exposure of live cells to light, which could reduce the potential phototoxic effects of blue light unlike the CRY2/CIB1 (Figure 4G–J and Supplementary Figure S8A and B). Tucker and colleagues described that the performance of a given optogenetic tool is dependent on the system in which the study is conducted (29). Thus, side-by-side comparisons—even if well intended as certainly the case in this study—could be challenging. Therefore, further optimizations of construct and transduction for the EL222 and VVD systems may improve the background leak in dark conditions (Supplementary Figure S7). The low background signal consistently seen in the FKF1/GI-based system will enable the wider application of this system, including its use in target cells to address developmental questions with fine spatiotemporal resolution. In the case of the CRY2/CIB1-based system, the background leak in the dark became worse later after the transfection (Figure 4C and D). This result suggests that it might be difficult to develop biological models such as transgenic mouse stably expressing the CRY2/CIB1 constructs. Therefore, the new version of the light-inducible transcription system using FKF1 (NLOV, H105L) and GI will be of great interest to many researchers for use in further applications of this FKF1/GI-based system with their biological models and to address their questions regarding basic and biomedical research.
SUPPLEMENTARY DATA
Supplementary Data are available at NAR Online.
ACKNOWLEDGEMENTS
We would like to thank C. Tucker for sharing the plasmids and valuable comments on this manuscript; T. Imaizumi, L.B. Motta-Mena and K.H. Gardner for sharing the plasmids and information; J. Feng, Y. Kawano, S. Ueno and M.J. Schnitzer for helpful discussion and support; W.K. Chung, J. Wynn, P. Lanzano for sharing human patient fibroblasts.
FUNDING
Columbia Stem Cell Initiative and Department of Rehabilitation and Regenerative Medicine; ImPACT (Impulsing Paradigm Change through Disruptive Technologies Program, Japan Science and Technology Agency) (to M.Y.); JSPS Postdoctoral Fellowship for abroad research (to F.K.); China Scholarship Council Fellowship (to F.S.); CCTI Flow Cytometry Core at Columbia University by the Office of the Director, National Institutes of Health [S10OD020056, in part]. Funding for open access charge: Lab personnel salary, experimental supplies and core services.
Conflict of interest statement. None declared.
Present addresses:
Seon-Hye E. Park, University of Texas Southwestern Medical Center, TX 75390, USA.
Daniel W. Awari, Rowan University School of Osteopathic Medicine, Stratford, NJ 08084, USA.
Juergen C. Jung, Edison Pharmaceuticals, Mountain View, CA 94043, USA.
REFERENCES
Author notes
These authors contributed equally to the paper as first authors.

Comments