


Abstract
Metastasis is the main event leading to death in cancer patients. Over the past decade, high-throughput technologies have provided genome-wide view of transcriptomic changes associated with cancer metastases. Many microarray and RNA sequencing studies have addressed metastases-related expression patterns in various types of cancer, and the number of relevant works continues to increase rapidly. These works have characterized genes that orchestrate the metastatic phenotype of cancer cells. However, these expression data have been deposited in various repositories, and efficiently analyzing these data is still difficult because of the lack of an integrated data mining platform. To facilitate the in-depth analyses of transcriptome data on metastasis, it is quite important to make a comprehensive integration of these metastases-related expression data. Here, we presented a database, HCMDB (the human cancer metastasis database, http://hcmdb.i-sanger.com/index), which is freely accessible to the research community query cross-platform transcriptome data on metastases. HCMDB is developed and maintained as a useful resource for building the systems-biology understanding of metastasis.
INTRODUCTION
Metastasis is the spread of a cancer from one organ to another without being directly connected with it, and it is the principal cause of cancer-related death (1–4). It is of great importance to evaluate the presence of metastasis in cancer patients, when choosing appropriate treatment strategies. A wide variety of approaches have been employed to identify and characterize genes involved in cancer metastasis at the transcriptional level (5–9). It is necessary to characterize the complicated molecular mechanism by integrating different data sources.
Recently, transcriptome data generated by microarray and RNA sequencing technologies have been widely used to explore the molecular nature of metastasis (9–14). Researches on the expression profile of metastases of multiple tumor types have produced a large amount of data at the transcription level. Members of new classes of non-coding RNAs, such as long non-coding RNAs (lncRNAs) and microRNAs (miRNAs) have important roles in tumorigenesis and metastases (5,15–18). High-throughput technologies enable the exploration of transcriptomic changes associated with tumor progression and metastasis at the whole-genome level, which greatly assists our efforts to uncover the underlying molecular mechanism of cancer metastasis (6,19). Furthermore, metastasis contributes to most of the cancer-related death, which emphasizes the importance of metastasis risk prediction. Some works identified gene expression signatures that distinguished primary site from metastatic tumors based on cancer metastasis expression profiles (9,10,20), which would be developed as useful biomarkers for early detection, diagnosis and treatment of cancers.
Most of these high-throughput data have been deposited into NCBI Gene Expression Omnibus (GEO) (21) and the Sequence Read Archive (SRA) (22). The Cancer Genome Atlas (TCGA) dataset also stored expression data of metastasis of various tumor types and matched/unmatched primary tumors. These databases mainly serve as raw data archives, and cannot provide the full utility of transcriptome data for users. It still requires highly developed bioinformatics skills to manipulate metastasis-related data pipelines. These valuable resources provided an opportunity to explore metastasis-associated genes from large amount of samples. Recently, many cancer-related databases have been developed to store cancer-related gene expression and functional information. For example, cBioPortal (23) provided multidimensional cancer genomics data sets, however, only few metastasis-related data were involved. Cancer RNA-seq Nexus (24) only integrated recently published cancer RNA-seq data, and the metastasis-related classes of differential expression analyses were not well defined. dbMEMC (25) is a database of differentially expressed miRNAs in human cancers, and contains few metastasis-related miRNAs. CMGene (26) is a literature-based database for cancer metastasis genes, and is not specially for differentially expressed genes of cancer metastasis. These databases provided some information on cancer metastasis, however, our knowledge of metastasis-related gene at the transcriptome level remains limited.
To this end, we presented the human cancer metastasis database (HCMDB), the first public database providing published cancer metastasis expression profiles. It also permits the analysis and visualization of mRNA/lncRNA co-expression networks and miRNA regulatory networks. HCMDB is freely accessible to cancer metastasis research community to query and analyze metastasis-related expression data. We expected this database could facilitate the identification of cancer metastasis associated genes and benefit the examination of their roles in physiological and pathological processes of cancer metastasis. All the data in HCMDB is freely available to the public domain through http://hcmdb.i-sanger.com/download.
DATA COLLECTION AND DATABASE CONTENT
Figure 1 depicts the architecture of the HCMDB database. Systematic data searching was conducted for metastasis-related expression profiles using the following keywords: ‘cancer’, ‘tumor’, ‘metastasis’ and ‘epithelial-mesenchymal transition’, in combination with ‘long non-coding RNA’, ‘lncRNA’ and ‘microRNA’ from GEO (https://www.ncbi.nlm.nih.gov/geo/) and SRA database (https://www.ncbi.nlm.nih.gov/sra/). The eligible data are limited to human studies published before June 2017. A total of 620 data sets were initially collected. Then, we manually curated these datasets to ensure that the data contains both primary tumors and metastases. Only the datasets have enough samples (at least three) for both primary tumors and metastases were left. Moreover, the TCGA clinical information was retrieved, and corresponding metastasis-related expression data were also enrolled (82 datasets). At last, the gene expression profiles of 29 primary tumor types from 455 experiments remained, including a total of 11 425 samples (Table 1).
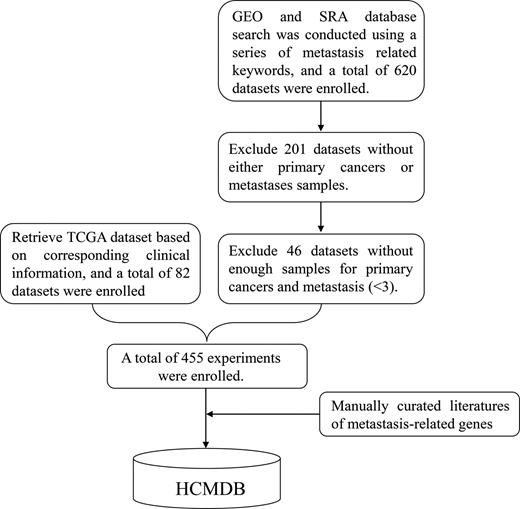
The framework for constructing HCMDB. The transcriptome data were derived from GEO, SRA, TCGA database. A series of filters were used to ensure the data quality of HCMDB. Metastasis-related literatures were manually to annotate the expression dysregulated genes.
Experiment and sample size in the current version of HCMDB
| Primary cancers | No. of experiments | No. of samples | Data sources |
|---|---|---|---|
| Bladder cancer | 17 | 423 | TCGA |
| Brain cancer | 1 | 22 | GEO |
| Breast cancer | 93 | 3054 | GEO, TCGA |
| Cervical cancer | 11 | 968 | GEO, TCGA |
| Colorectal cancer | 75 | 2440 | GEO, TCGA, SRA |
| Esophagus cancer | 12 | 171 | TCGA |
| Ewing's sarcoma | 1 | 37 | GEO |
| Eye cancer | 3 | 121 | GEO, TCGA |
| Gastric cancer | 3 | 404 | TCGA |
| Head and neck cancer | 2 | 30 | GEO |
| Kindey cancer | 25 | 353 | GEO, TCGA |
| Laryngeal cancer | 2 | 15 | GEO |
| Liver cancer | 30 | 273 | GEO, SRA |
| Lung cancer | 4 | 46 | GEO |
| Midgut carcinoid tumor | 4 | 39 | GEO |
| Nasopharynx cancer | 2 | 22 | GEO |
| Oral cancer | 2 | 27 | GEO |
| Osteosarcoma | 3 | 30 | GEO |
| Ovarian cancer | 1 | 18 | GEO |
| Pancreatic cancer | 27 | 293 | GEO, TCGA |
| Pancreatic neuroendocrine tumor | 18 | 94 | GEO |
| Penis cancer | 3 | 33 | GEO |
| Prostate cancer | 49 | 863 | GEO, TCGA, SRA |
| Skin cancer | 38 | 598 | GEO |
| Small intestine cancer | 11 | 87 | GEO |
| Synovial sarcoma | 1 | 34 | GEO |
| Testicular cancer | 2 | 142 | GEO, TCGA |
| Thymoma | 2 | 121 | TCGA |
| Thyroid cancer | 15 | 667 | GEO, TCGA |
| Total | 455 | 11 425 |
The final dataset contains 351 mRNA expression profiles and 160 miRNA expression profiles. The TCGA data were downloaded from https://portal.gdc.cancer.gov/. For SRA data, an in-house bioinformatics pipeline was employed. Briefly, we evaluated RNA-seq quality using FastQC (version 10.10.1), and sequencing reads were aligned to the human genome (hg19) using Bowtie (27) software (version 1.1.1) with default parameters. Then, we re-assembled a transcriptome using Cufflinks (28) (version 2.2.1). The FPKM (fragments per kilobase of transcript per million mapped reads) values were calculated.
To date, lncRNA expression profiles of cancer metastases remain largely unknown. The lncRNA expression of metastases could be detected by mining gene expression microarray data because many lncRNA probes can be identified on the commonly used microarray platforms. So, we used the data mining method to detect lncRNA profiling on the microarray platform. A total of 335 lncRNA expression profiles were involved. For each experiment, the users can compare the expression profiles between different groups. The limma package (29) nested in R (http://www.r-project.org/) was employed to detect differentially expressed genes between different types of samples. Those genes with F.D.R.<0.05 were selected as candidates having significantly different expressions. To explore the biological implications of lncRNA, mRNA-lncRNA co-expressions were calculated using Pearson correlation coefficient. To identify miRNA target genes, PITA (30), miRanda (31) and RNAhybrid (32) software were employed. Those genes that identified by at least two software were regarded as miRNA target genes. The average number of target genes per miRNA is 244.
To further annotate metastasis-related genes, we searched Pubmed database (https://www.ncbi.nlm.nih.gov/pubmed/) using the keywords of ‘metastasis’ and corresponding gene symbols. All selected literatures were manually curated by at least two researchers. More than 7000 published papers were systematically reviewed, and 2183 metastasis-related genes were manually curated.
DATABASE CONSTRUCTION
We developed a user-friendly web interface to present HCMDB. A MySQL relational database was set up to store the data. The web interface for browsing and searching was implemented by PHP and JavaScript. The data processing was implemented by our in-house R scripts. The web service is based on an Apache Tomcat web server.
DATABASE FEATURES AND UTILITY
Experimental description
For each experiment presented, we carefully reviewed the experiment design of original paper and all the samples profiled. We retrieved the involved samples and classified them as one of the following categories: primary cancer versus metastasis (33,34), primary cancer with metastasis vs. primary cancer without metastasis (35,36), primary cancer versus respective normal tissues (37,38), metastasis vs. respective normal tissues (39,40), different metastatic tumors of same origin (41), metastatic tumors of diverse origins (42). Most of the groups were defined according to the original experiment design. Primary cancer versus metastasis accounts for the most of the total experiments (Figure 2, 34%). After the samples were assigned to different groups, differential gene expression was assessed with limma package. For each experiment, the detailed information was provided to delineate the experimental design, cancer type and the total number of genes identified.
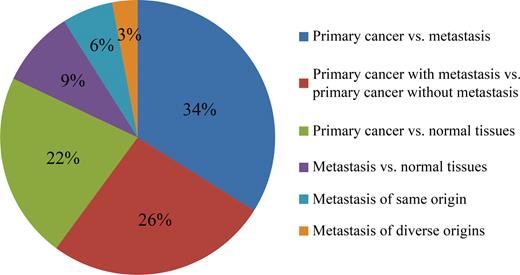
The percentage of categories of differential expression analyses.
Database query and search platform
A user-friendly web interface was developed to present the HCMDB (Figure 3). We herein provided several ways to allow database query. First, a search engine was provided in HCMDB using gene names from the ‘Search’ page. Users can input their interested gene names in the textbox (including mRNAs, lncRNAs and miRNAs), and all the items that contain the query genes in the database can be derived. The searching result page lists the related experiment ID, primary cancer type, metastasis, experiment design, number of samples. A box plot was provided for the comparison of gene expression between different groups. Moreover, manually curated literatures related to the focal genes were also shown in the result page. Second, users can select particular primary cancer type and browse related experiments from the ‘Browse’ page. We also provided other optional filters to help users focus on the most interested results, such as sample size (<10, 10–50, 50–100, >100) and gene type (mRNA, lncRNA, miRNA).
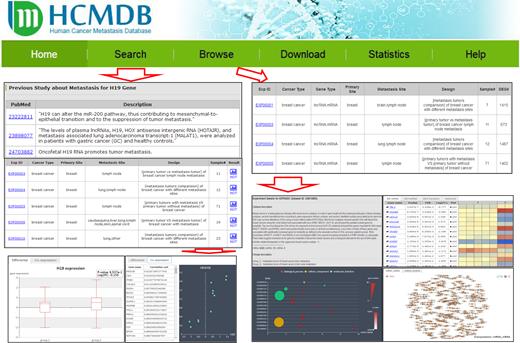
The schematic workflow of HCMDB.
Detailed experiment page
By clicking the hyperlink of a particular experiment ID, the detailed result of a specific experiment can be provided. This page mainly consists of four different sections: experiment description, expression profile, functional categories and regulatory network. In the ‘experiment description’ section, a detailed experiment description was listed. In addition, the number of mRNA/lncRNA/miRNA was also provided. In the ‘expression profile’ section, a list of gene name, differential expression result derived from limma software, such as P-value, F.D.R., log Fold Change were displayed. HCMDB creates a heatmap to facilitate users to examine differential expression profiles between different groups. In the ‘functional categories’ section, HCMDB provides the over-represented GO categories and KEGG pathways of differentially expressed genes. Fisher's exact test was used to identity over-represented GO and KEGG categories. In the ‘regulatory network’ section, HCMDB presents and visualizes the mRNA-mRNA and mRNA-lncRNA co-expression network, and force-directed and circus layout were employed. If the experiment contains both mRNA and miRNA expression profiles, the miRNA-targets regulatory network was also provided.
DISCUSSION AND CONCLUSION
Integrated analysis of multi-dimensional transcriptomic data is important to our understanding of cancer metastasis (43–49). The decreasing cost of large-scale technologies has led to tremendous amount of transcriptome data from metastasis studies. These data provided us great opportunities to perform gene expression quantification analysis in metastasis. Moreover, these data would help us identify gene expression signature associated with metastasis. Here, we provided the HCMDB to integrate these resources and facilitate the study of gene expression dysregulation in metastasis. HCMDB is freely accessible to the research community to query and analyze transcriptome data on metastasis.
Although some other related works provided some information on human cancer metastasis, such as cBioPortal (23), Cancer RNA-seq Nexus (24), dbMEMC (25) and CMGene (26), there are several advanced features that distinguish HCMDB from other data sources. First, it is a database specific to metastasis-related transcriptome data, and contains a greater number of gene-metastasis associations. Second, the lncRNA expression profiles of metastasis and primary tumors were comprehensively involved. Third, several classes of differential expression analyses were defined when examining the dysregulation pattern. These included primary cancer versus respective normal tissues, metastasis versus respective normal tissues, primary cancer versus metastasis, primary cancer with metastasis versus primary cancer without metastasis, different metastatic tumors of same origin, metastatic tumor of diverse origins. It provided a better way to comprehensively understand the gene expression pattern in metastasis, and the data have implications for our understanding how metastasis arise, and suggest ways in which expression signatures can be improved.
The cancer metastasis might be accomplished by the requirement of multiple genetic or genomics alterations. Recent papers have documented that somatic mutations and copy number alterations may play important roles in driving the development of cancer metastasis (50,51). For example, it has been documented that several recurrent copy number alterations might be the driver alterations in metastasis among superficial esophageal squamous cell carcinoma (52). A broader understanding of the genomic changes arising during metastasis will allow us to identify new metastasis-related mechanism and to discover new biomarkers for the diagnostic signatures of metastasis. HCMDB will be continuously updated and provide a unique resource in the following directions: (i) integrate more upcoming metastasis-related transcriptome data. (ii) Collect more comprehensive metastasis genetic and genomic data, including somatic mutation data, copy number alteration data. (iii) Add high-quality drug pharmacological data. Through our efforts, we expect that HCMDB will contribute to research into further understanding of the metastasis transcriptomic regulation mechanisms, and even toward the diagnosis and treatment of cancer metastasis.
FUNDING
National Natural Science Foundation of China to Dong Dong [31200956]. Funding for open access charge: National Natural Science Foundation of China to Dong Dong [31200956].
Conflict of interest statement. None declared.

Comments