


Abstract
Drug modes of action are complex and still poorly understood. The set of known drug targets is widely acknowledged to be biased and incomplete, and so gives only limited insight into the system-wide effects of drugs. But a high-throughput assay unique to yeast—barcode-based chemogenomic screens—can measure the individual drug response of every yeast deletion mutant in parallel. NetwoRx (http://ophid.utoronto.ca/networx) is the first resource to store data from these extremely valuable yeast chemogenomics experiments. In total, NetwoRx stores data on 5924 genes and 466 drugs. In addition, we applied data-mining approaches to identify yeast pathways, functions and phenotypes that are targeted by particular drugs, compute measures of drug–drug similarity and construct drug–phenotype networks. These data are all available to search or download through NetwoRx; users can search by drug name, gene name or gene set identifier. We also set up automated analysis routines in NetwoRx; users can query new gene sets against the entire collection of drug profiles and retrieve the drugs that target them. We demonstrate with use case examples how NetwoRx can be applied to target specific phenotypes, repurpose drugs using mode of action analysis, investigate bipartite networks and predict new drugs that affect yeast aging.
INTRODUCTION
Chemogenomic barcode screens are particularly valuable high-throughput (HTP) drug assays that are unique to yeast—comparable data is not yet available for any mammalian model organism. These screens report the change in colony growth in response to drug treatment for every one of the ∼6000 deletion strains in the yeast deletion collection (1,2). Deletion strains in the collection are each tagged with unique bar codes, permitting the growth response of every strain to be measured in parallel (DNA bar codes are amplified and hybridized to microarrays). Previous studies have demonstrated the relevance of these yeast data to human disease. For example, Ericson et al. tested 81 psychoactive drugs in yeast and identified secondary drug targets that help explain side effects in human patients (3), and Blackman et al. applied the screen to identify the molecular targets of elesclomol, a promising chemotherapy adjuvant (4). These unique chemogenomic data complement other HTP measures of drug effects, for example gene expression changes in response to drug treatment as measured in human cell lines by the Connectivity Map project (5), as well as databases on known drug–target interactions, including DrugBank (6), SuperTarget (7), the Comparative Toxicogenomics Database (8) and STITCH (9). The set of known drug targets, collected from small-scale experiments, is biased and incomplete: small molecules are typically screened against only a limited set of candidate targets. This bias limits the usefulness of these data for any genome-wide or systematic network-based analyses of drug effects (10). HTP chemogenomic assays, including barcode-based screens, are better suited for global analyses. NetwoRx is the first resource to integrate and make yeast chemogenomic screening data available in queryable format and to facilitate their systems-level analysis.
Previous bioinformatics analyses of individual chemogenomics datasets have provided valuable insights into drug mode of action. These analyses have included the unsupervised clustering of drug fitness profiles (growth responses) to identify groups of drugs that affect genes in the same way (11,12), and calculating gene co-fitness and using it to predict gene function (13).
Systems-level interrogations of drug response data that incorporate more realistic representations of complex animal phenotypes promise to improve our knowledge of drug actions and increase our ability to effect more precisely desired biochemical, biological and therapeutic outcomes (14,15). Gene set and network models of phenotypes offer a valuable first approximation to the problem of representing biological complexity. For NetwoRx, we comprehensively interrogated yeast chemogenomic data using gene set and network models.
The NetwoRx database integrates the three largest chemogenomic experiments (3,11,12), covering nearly 6000 yeast genes and 466 drugs, and facilitates the investigation of drug effects at the systems level. We used gene set analysis methods to identify pathways and phenotypes targeted by drugs, compute drug–drug similarity metrics for mode of action analysis and build drug–phenotype networks. We applied our methods to four gene set collections of high biological relevance: Gene Ontology categories (16), KEGG pathways (17), SGD mutant phenotypes (18) and YEASTRACT targets of transcription factors (19). Full results of our analyses are available through NetwoRx, a web database linking drugs to networks and phenotypes. We also set up automated analysis routines in NetwoRx; users can query new gene lists against the entire collection of drug profiles and NetwoRx will retrieve the drugs that target them.
We demonstrate with use case examples how NetwoRx can be applied to (i) identify drugs that modulate the oxidative stress response; (ii) repurpose drugs for cancer by examining pathways involved in DNA damage; (iii) investigate the druggability of transcription factor targets with a bipartite network; (iv) cluster the drug-pathway network to identify drugs with shared modes of action; and (v) predict new drugs that modulate yeast aging.
MATERIALS AND METHODS
NetwoRx construction methods
Data sets
Chemogenomic data
Log-ratio data of control to drug treatment strain abundance, and P-values for individual drug–gene associations, were obtained from the three largest previously published yeast chemogenomic studies (3,11,12). The union of these datasets comprised 5924 genes and 466 drugs. Ericson et al. (3) and Hillenmeyer et al. (11) used the diploid yeast deletion collection, including both homozygous and heterozygous deletion strains (2,20). Parsons et al. (12) used the haploid yeast deletion collection from (2). NetwoRx treats the experimental data in the same manner as in the original publications. The data from (11) are treated as two separate experiments, an experiment with homozygous deletion strains (4742 distinct ORFs, 132 drugs) and an experiment with heterozygous deletion strains (5272 ORFs, 318 drugs). The data from (3) are treated as a single experiment with a mix of heterozygous and homozygous deletion strains (5200 ORFs, 81 drugs). The data from (12) are treated as a single experiment with the haploid deletion collection (4111 ORFs, 82 drugs). Because of differences in experimental design, we treat each of these four datasets separately in all NetwoRx analyses; e.g. when a user searches for a particular drug or pathway, NetwoRx will report the P-values for that drug or pathway calculated in each dataset.
Gene sets
KEGG Pathways (21) and Gene Ontology categories (22) were obtained from the Bioconductor 2.8 package org.Sc.sgd.db; mutant phenotypes were downloaded from SGD (23); transcription factor targets were obtained from the YEASTRACT database (24).
Gene set scores
Gene-level scores
Scores for individual gene–drug relations were calculated as log strain abundance ratios (of control to drug treatment); these data were downloaded from the individual publications used in NetwoRx. For each drug treatment experiment, abundance of deletion strains was measured as intensity on a microarray, and drug treatment arrays were compared to non-drug control arrays; details of normalization and data cleaning specific to each source publication are fully described in (3,12,13). If a gene was represented more than once in a dataset, for each drug treatment we selected the gene’s largest score.
Gene set score (GSS)
The statistic for a set of genes was calculated as the mean of the gene-level scores for set genes, adjusted for set size (Figure 1). Gene set statistics were calculated separately in each of the four datasets. For a drug treatment with mean µ and standard deviation σ, and a gene set P of size n, if S(P) was the average of the gene-level scores si (for genes i in P), then GSS(P) = (S(P) − µ)/(σ/sqrt(n)). For each drug treatment, we calculated scores for those gene sets where gene-level scores were available for at least five and no more than 500 genes; other gene sets were assigned a value of NA.
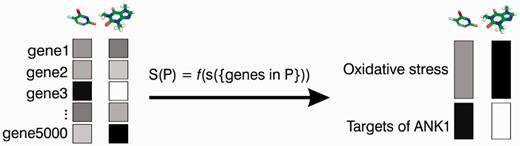
Gene set analysis of chemogenomic data. NetwoRx implements gene set analysis methods to convert scores that link drugs to genes (boxes on left), into scores that link drugs to pathways (boxes on right). The score S of a pathway P is calculated as a function f of the gene-level scores s for genes in P (S is the mean of the gene-level scores for genes is P genes, adjusted for set size—see ‘Materials and Methods’ section).
P-values
For a GSS corresponding to a given gene set and drug treatment, we calculated two P-values, P1 and P2. For P1, we computed the one-sided P-value corresponding to the Z-score defined by the GSS. For P2, we considered the matrix of GSS values for all drug treatments in a dataset and all gene sets of a given type (e.g. all GO categories); we calculated P2 as the fraction of these values equal to or exceeding the GSS. The conservative P-value for the gene set under the drug treatment was then reported as P = max(P1,P2). For user queries of new gene sets, we report only P1 (as there is no appropriate background gene set collection to use for P2).
Drug–drug similarity
For each chemogenomic dataset, we calculated two measures of drug–drug similarity for all pairs of drugs, S1 and S2. S1 and S2 quantify the extent to which two drugs are alike in their effects on genes and pathways, respectively.
For S1, we took the matrix of gene-level scores (genes vs. drugs), eliminated columns or rows where more than half of values were NA, and then calculated the Pearson correlation between all pairs of columns (drugs). For drugs represented more than once in a data set, we merged replicates by calculating average correlations. For each drug–drug similarity score, we calculated its associated P-value as the fraction of other drug–drug similarity scores equal to or exceeding it.
For S2, we repeated the same filtering, calculations and merging on the matrix of GSS scores (gene sets vs. drugs); all gene set types (GO, KEGG, YEASTRACT, SGD phenotype) were included in the GSS matrix.
Bipartite interaction networks
For a given gene set collection and chemogenomic dataset, a drug and a gene set were considered to interact if the GSS had an associated P ≤ 0.05 for at least one treatment with that drug. For each drug/gene set association, we report the lowest P-value observed over all treatments of the same drug.
Code
Code for all analyses was written in R 2.13.0; we also used the Bioconductor 2.8 GSEABase and org.Sc.sgd.db.
Database implementation
The NetwoRx portal was written in Java and runs on the WebSphere 6.1 application server on an IBM P595 server with a secondary P595 backup server. The database runs on DB2 9.5 on an IBM P570 server with a mirror running on P595 for redundancy and workload balancing.
Use-case methods
Data sets
Chronological aging
Three sets of genes that extend yeast chronological lifespan were obtained from previously published genome-wide experiments (25–27).
Drugs that modulate aging
Drugs known to modulate aging in Saccharomyces cerevisiae were downloaded from the Lifespan Observation Database at http://lifespandb.sageweb.org/.
Code and software
Code for all analyses was written in R 2.13.0. We used the WGCNA R package for drug–drug similarity network analysis (28). Networks were visualized with NAViGaTOR 2.2.1 (http://ophid.utoronto.ca/navigator/) (29).
RESULTS
NetwoRx content and functionality
Here we briefly describe basic database content and functionality.
Database contents
The NetwoRx web portal contains drug-response data calculated for 466 drugs and thousands of S. cerevisiae genes. Drugs are linked to their PubChem Compound IDs (30), yeast genes to their SGD entries (18) and gene sets to their relevant databases (GO, KEGG, YEASTRACT, or SGD phenotype).
Drug–gene associations
P-values for associations between drugs and individual genes. Link: http://ophid.utoronto.ca/networx/singleid
Drug–pathway associations
P-values and GSS for associations between drugs and KEGG pathways (21), GO categories, YEASTRACT targets of transcription factors (24) and SGD mutant phenotypes (23). Link: http://ophid.utoronto.ca/networx/drug2pathway
Drug–drug similarity metrics
Similarity values S1 and S2 (between −1 and 1) and associated P-values for all pairs of drugs, quantifying the extent to which drugs affect genes (S1) or pathways (S2) in the same way. Link: http://ophid.utoronto.ca/networx/drug2drug
Drug-pathway networks
Bipartite networks of significant drug–pathway associations are available as tab-delimited text files or Navigator 2.2.1 files for network visualization (29). Link: http://ophid.utoronto.ca/networx/drugnetworks
New pathway search
Users can specify a new set of genes, and NetwoRx will calculate which drugs interact with it. Link: http://ophid.utoronto.ca/networx/newmodule
Accessing data
Search by drug
Users can search for drugs by their name or by their PubChem Compound ID (e.g. rapamycin or 5284616).
Search by gene or list of genes
Users can search for yeast genes by their systematic names (e.g. YKL203C).
Search by gene set identifier
Users can search for gene sets by their set-specific identifiers (e.g. GO:0006979; Figure 2).
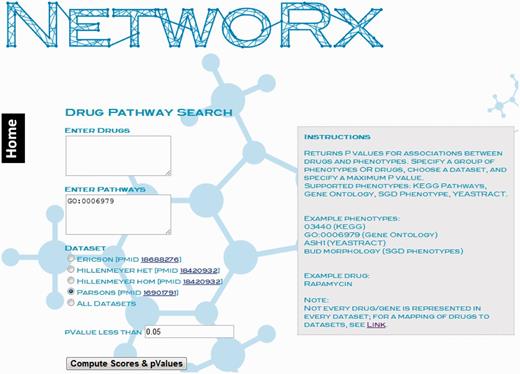
Searching NetwoRx by pathway ID. Users can search NetwoRx for drugs that target gene sets using set-specific identifiers, e.g. the Gene Ontology ID for ‘Response to oxidative stress’, GO:0006979.
NetwoRx use case examples
Here we provide several NetwoRx use cases, using NetwoRx data alone (cases 1–4) or in combination with data from other HTP experiments (case 5).
Case 1. Retrieving drugs that perturb phenotypes: oxidative stress
Querying NetwoRx with gene sets related to oxidative stress—from the Gene Ontology (‘response to oxidative stress’, GO:0006979) or SGD mutant phenotypes (‘oxidative stress resistance’) returns drugs that perturb these pathways. Both compounds known to cause oxidative stress (e.g. hydrogen peroxide, paraquat) and to protect from it (e.g. allyl disulfide, rapamycin) are returned. Other significant drugs have not yet been tested for their impact on oxidative stress (Figure 3A).
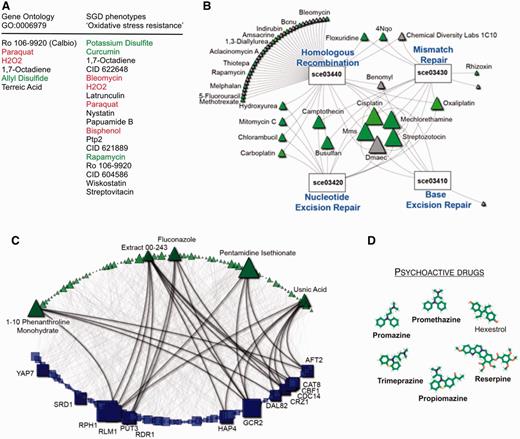
(A) Drugs that perturb oxidative stress pathways. Drugs are shown in order of increasing P-value; some drugs (green) are known to ameliorate the effects of oxidative stress, whereas other drugs (red) induce it. Drugs indicated in black have an unknown effect on oxidative stress. Data set: homozygous collection from (11). (B) Mode of action analysis of the chemotherapeutic Cisplatin. Node size is proportional to degree (nodes with more connecting edges are drawn larger). Known cancer drugs are indicated in green. Data set: homozygous collection from (11). (C) Bipartite network showing all connections between drugs and YEASTRACT targets of transcription factors. Node size is proportional to degree. Data set: (12). We highlight the high degree nodes and their connectivity. (D) Drug module identified by clustering the matrix of drug–drug similarity scores. Five of six drugs in this module are known to be psychoactive (indicated in bold). Data set: heterozygous collection from (11).
Case 2. Focused searches identify drugs with shared mode of action: drugs that target the same DNA damage pathways as Cisplatin
Querying NetwoRx with the chemotherapeutic agent Cisplatin (CID 441203) to identify its mode of action returns four significant KEGG pathways related to DNA damage: base excision repair (sce03410), nucleotide excision repair (sce03420), DNA mismatch repair (sce03430) and homologous recombination (sce03440). Querying NetwoRx with these four DNA damage pathways and extracting the drug–pathway network reveals that many significant drugs are known cancer drugs that are connected to multiple pathways (Figure 3B). Other significant drugs have not yet been tested for cancer and should be prioritized for further study.
Case 3. Bipartite networks reveal that some gene sets are druggable hubs
NetwoRx users can choose to download the entire collection of significant drug–pathway connections for a given gene set type, either as a tab-delimited text file or as a graph that can be visualized in NAViGaTOR 2.2.1 (29). Downloading the entire set of associations for YEASTRACT transcription factors reveals that while most targets of TFs are affected by only few drugs, some (e.g. GCR1, IFH1) are perturbed by many (Figure 3C).
Case 4. Clustering the drug-pathway matrix identifies drug modules that share modes of action
NetwoRx provides measures of drug–drug similarity that quantify the extent to which pairs of genes impact pathways in the same way. NetwoRx users can search these data by drug name or download them in bulk. We downloaded the entire matrix of drug–drug similarities from NetwoRx for the heterozygous experiments of (11). We then used the R package WGCNA (28) to cluster drugs into modules sharing mode of action. These modules can be applied for drug repurposing. For example, one module was highly enriched for psychoactive drugs (Figure 3D). Five of the six drugs in the module are used as sedatives and antipsychotics. The last drug, hexestrol, is a synthetic estrogen that NetwoRx predicts to be psychoactive.
Case 5. User-defined gene sets: identifying new drugs that modulate yeast chronological aging
NetwoRx can perform gene set analysis of new gene sets specified by the user. Here we apply this functionality to identify new drugs that may modulate yeast aging. Three previous studies have conducted genome-wide assays in yeast to identify gene deletions that lead to increased survival in prolonged stationary phase (25–27). We obtained sets of longevity genes from each publication (42, 57 and 90 genes, respectively). Notably, the overlap among these sets was poor (Figure 4, bottom right). There were three genes common to (26) and (27), and one gene common to (25) and (27). No gene was common to all three studies; furthermore, no gene was common to the two most recent studies, despite the fact that they shared a similar experimental methodology. This poor overlap may be due in part to false negatives common to noisy HTP experiments, as well as to the fact that aging is a particularly subtle and complex organismal phenotype; examining HTP data at the systems level in terms of pathways and gene sets rather than individual genes can help mitigate this problem, leading to more robust findings (31–33).
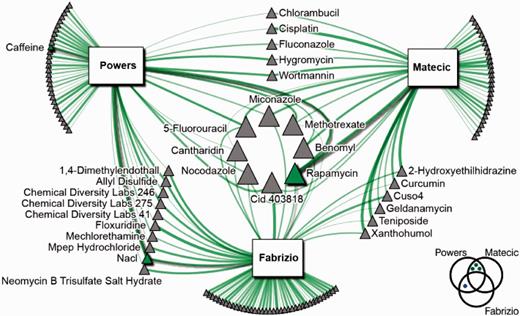
Drugs predicted by NetwoRx to modulate yeast chronological lifespan. Drugs known to increase yeast lifespan are indicated in green. Node size is proportional to degree, and edge width is proportional to the statistical significance of the drug/gene set connection (for all connections P ≤ 0.05). Diagram at bottom right indicates the overlap between the genes identified as significant in each aging study. Data set: union of all data sets.
Querying these gene sets against all datasets in the NetwoRx collection revealed that these gene sets share many targeting drugs. In total, 125 drugs target at least one gene set, 29 target at least two sets and eight target all three. We downloaded the set of drugs previously shown to extend yeast chronological lifespan from the Lifespan Observation Database at http://lifespandb.sageweb.org/. Three of these drugs (rapamycin, caffeine, and sodium chloride) are included in the NetwoRx collection, and our analysis identified all three as significantly associated with one or more aging gene sets (Figure 4, green nodes). Rapamycin, a well-known antiaging drug that has been shown to extend lifespan in multiple species (34), targets all three gene sets; NaCl targets two gene sets; caffeine targets one. Other drugs in the network have been reported to extend life in other species, e.g. curcumin and wortmannin extend life in Drosophila melanogaster (35,36).
Other NetwoRx functionalities can be applied to narrow down a list of interesting candidates from the set of 125 significant drugs. For example, we retrieved from NetwoRx a list of the top 10 drugs most similar in terms of their pathway-based mode of action to the antiaging drug rapamycin, from the heterozygous experiment of (11). Six of these ten drugs also target at least one aging gene set, i.e. are represented in the aging–drug network (Figure 4): allyl disulfide, allyl sulfide, CDL 14A, CDL 3F2, CID 688028 and CID 697443.
DISCUSSION
Integrative computational methods that mine chemogenomic data are fast, cheap and can complement traditional methods of drug screening. The NetwoRx database integrates data from the major S. cerevisiae barcode chemogenomics experiments, and facilitates systematic analysis of drug mode of action and drug:pathway links by identifying pathways and 5924 genes modulated by 466 drugs. Users can search or download data, allowing them to identify yeast pathways, functions and phenotypes that are targeted by particular drugs, compute measures of drug–drug similarity, and construct drug-phenotype networks. Users can also query new gene sets against all drug profiles and identify drugs that target them. These unique chemogenomic data complement existing drug database such as DrugBank and the Connectivity Map, and can help shed light on the genome-wide effects of drug treatment, accelerating the identification and development of new therapeutics. We illustrated with examples how NetwoRx can be applied to analyze mode of action of cancer drugs, repurpose psychoactive drugs and predict new drugs that modulate yeast aging.
As with any assay, yeast barcode chemogenomic screens have several limitations; these have been discussed elsewhere (e.g. 37,38). Importantly, these screens can be used only with those compounds bioactive in yeast; can capture only those drug–gene interactions that impact growth; and be relevant to disease for only those human proteins having yeast homologs.
NetwoRx goals and future developments
Many studies linking drugs to proteins and cellular responses have been conducted over the past decades, but most of the resulting data are biased, as drugs are typically screened against only a small set of candidate targets or genetic contexts. Although such screens are valuable for testing particular hypotheses about individual protein–drug relations, they have limited ability to quantify drug effects at the systems level. Hypothesis-free genome-scale HTP investigations of drug response have potential to improve our knowledge of drug mode of action (39) and accelerate the development of true systems medicine (40). With NetwoRx, our goal is to make data from large-scale yeast chemogenomics experiments available as a resource for HTP integrative computational biology analyses, and through it enable a global picture of drug action.
In the future, we will expand NetwoRx with data from comparable experiments of high enough throughput—where at least dozens of drugs are queried against thousands of genes. This will include future yeast chemogenomic barcode experiments of the type included in the current release of NetwoRx, but may also incorporate related experiments in other animals. In the future, developments in RNAi technology will allow experiments of comparable throughput to be conducted in mammalian cell lines, and we will expand NetwoRx to include these data. Pooled shRNA screens have already helped elucidate the mode of action of individual cancer drugs and show enormous promise for speeding drug development (41,42).
FUNDING
Ontario Research Fund [GL2-01-030 and RE-03-020]; Canada Institutes for Health Research [BIO-99745]; Canada Foundation for Innovation [CFI 12301, 203373, 29272 and 225404]; Canada Research Chair Program, and the Ontario Ministry of Health and Long-term Care (in part). The views expressed do not necessarily reflect those of the OMOHLTC. Funding for open access charge: Ontario Research Fund [GL2-01-030].
Conflict of interest statement. None declared.
ACKNOWLEDGEMENTS
The authors thank Marc Angeli and Abraham Heifets for their helpful comments on the manuscript.
REFERENCES
Author notes
Present addresses: Kristen Fortney, Department of Developmental Biology, Stanford University, Stanford, CA 94305, USA.
Yulia Kotseruba, Department of Computer Science, York University, Toronto, ON M3J 1P3, Canada.

Comments