


Abstract
Post-transcriptional gene regulation is mediated through complex networks of protein–RNA interactions. The targets of only a few RNA binding proteins (RBPs) are known, even in the well-characterized budding yeast. In silico prediction of protein–RNA interactions is therefore useful to guide experiments and to provide insight into regulatory networks. Computational approaches have identified RBP targets based on sequence binding preferences. We investigate here to what extent RBP–RNA interactions can be predicted based on RBP and mRNA features other than sequence motifs. We analyze global relationships between gene and protein properties in general and between selected RBPs and known mRNA targets in particular. Highly translated RBPs tend to bind to shorter transcripts, and transcripts bound by the same RBP show high expression correlation across different biological conditions. Surprisingly, a given RBP preferentially binds to mRNAs that encode interaction partners for this RBP, suggesting coordinated post-transcriptional auto-regulation of protein complexes. We apply a machine-learning approach to predict specific RBP targets in yeast. Although this approach performs well for RBPs with known targets, predictions for uncharacterized RBPs remain challenging due to limiting experimental data. We also predict targets of fission yeast RBPs, indicating that the suggested framework could be applied to other species once more experimental data are available.
INTRODUCTION
Progress in experimental techniques for the detection of protein–protein interactions has uncovered highly interconnected cellular networks (1,2). Proteins can also bind to DNA or RNA. RNA binding proteins (RBPs), which rival transcription factors in number, play crucial roles in post-transcriptional regulation of gene expression, including the processing, export, localization, turnover and translation of mRNAs. Control at the post-transcriptional level adds substantial complexity to gene expression and is mediated by various combinations of RBPs that determine the fate of the bound transcripts and that co-ordinately regulate specific subsets of mRNAs (3–5). Whereas considerable progress has been made in mapping transcriptional networks in some organisms, post-transcriptional networks are relatively poorly understood despite being of similar importance.
Protein–RNA interactions can be sequence specific, where the protein binds to specific motifs of a few nucleotides in RNA loops, or non-sequence specific, where no special sequence on the mRNA is necessary (6). In many cases, the protein forges the structure of the RNA as the interaction takes place (7). Sequence specific interactions are mostly mediated by hydrogen bonds and non-polar contacts (8–10). Protein domains known to take part in protein–RNA interaction are the RNA recognition motif, the double-stranded RNA binding motif, the K-homology domain and the zinc finger motif (11). Different amino acids have a different propensity for binding RNA, with histidine, arginine, threonine and lysine showing a particular affinity for RNA. Little is known about RNA sequences that can be bound by specific RBPs. The most likely nucleotide to be bound by an RBP is uracil followed by adenine (12).
The targets of RBPs can be experimentally identified through RBP immunoaffinity purification (RIP), whereby the proteins are purified together with the bound RNAs; the associated RNAs can then be globally interrogated on microarrays (RIP-chip) (13). Other approaches include the yeast three hybrid system, which identifies proteins that bind an RNA sequence of interest or mRNAs controlled by a specific regulatory protein (14,15), RNAcompete, a method which exploits a single binding reaction combined with microarray analysis to identify the enriched mRNAs bound by each of the proteins (16), and CLIP (cross-linking and immuno precipitation), a method that can directly determine the binding sites of RBPs (17).
Bioinformatics approaches have been used to predict the presence of new RNA binding motifs and to identify new RBPs. Primary protein sequences have been used as features in machine-learning approaches directed at the classification of RBPs (18). Other works have included physico-chemical properties of the RBPs directly derived from the sequence and, in some cases, even predicted solvent accessibility and secondary structures (19,20). Advances in the understanding of the physics behind protein–nucleic acid interactions have enabled the prediction of the RNA structure that can be bound by a specific protein motif. The same RNA structure, however, can be produced by multiple sequences (21). Recently, a motif finding approach which also considers the RNA structure in establishing the binding preferences of RBPs has been suggested (22), which aims at identifying the binding characteristics for each specific RBP.
Thus, RBPs have been identified and classified, but knowledge on their RNA target specificities is currently limited to data from wet-lab approaches. There are clear differences in the docking of proteins on RNA compared to DNA, the former being characterized by looser packing and dynamic conformational changes of RNA (23). Whereas binding of transcription factors to DNA occurs mostly through short sequence motifs, the less constrained binding between proteins and RNAs may also depend on physico-chemical and structural properties. In addition to sequence features, it is likely that RBP–RNA interactions are determined by some combination of their properties, be they physical or functional. The non-trivial, and likely non-linear, relationships between a number of features related to an RBP and its targets can be identified and exploited by machine-learning algorithms, such as Support Vector Machines (SVMs) (24) and Random Forests (RF) (25), to predict new targets. These methods perform classification tasks where a set of known objects is used to train a prediction algorithm in classifying new objects, determining whether new pairs of RBPs and RNAs are interacting. Any approach that could predict general features of the RBP–RNA interactions, or even the specific RNA targets themselves, would be useful.
Toward this goal, we analyzed more than 100 gene and protein features in budding yeast (Saccharomyces cerevisiae), which allow us to understand the relations between different properties of proteins and mRNAs in general. Next, we identified characteristics that distinguish RBPs from other proteins. We then analyzed correlations between the features of a set of 40 RBPs and their experimentally determined target mRNAs (26) and investigated pairs of RBPs with known targets in terms of expression correlations and physical interactions. Furthermore, we explored machine-learning approaches to predict new RBP targets in budding yeast and in fission yeast (Schizosaccharomyces pombe).
MATERIALS AND METHODS
Statistical analysis
The list of budding yeast genes was obtained from the Saccharomyces Genome Database (SGD) and the GO terms from the GO slim mapper in SGD (downloaded in October 2009). Lists of RBPs and ribosomal proteins were also obtained from this source. Our list of RBPs does not include ribosomal proteins leaving a total of 210 proteins. All statistical tests were performed using R. Spearman correlation coefficients were calculated for all the features, P-values were corrected for multiple testing with Bonferroni correction. Wilcoxon Rank-Sum tests (WRSTs) were carried out to establish the significance of difference in the features for RBPs versus other proteins. Correlations between protein and mRNA features are only considered if they appear to be significant in the positive set and the average P-value of the 100 negative realizations is not significant. After processing the different data sources, data was available for around 2700 budding yeast proteins. By eliminating some features, we could include most of the genome in the analysis and verify that no substantial differences were found compared to the full data set. Gene Ontology enrichment analysis was performed with the GO term finder tool (27).
Negative randomized sets
The RBP–mRNA pairs in the positive set were shuffled by reordering the proteins at random while keeping the mRNA fixed for a total of 100 random sets. These do not exclude interactions from the positive set, but it is expected that the overlap should be small compared to the total. For the machine learning, a single negative set was carefully constructed in the same way but this time ensuring that there was no overlap with the positive set.
Expression correlation
Pearson correlation was calculated for each gene across 502 different genetic conditions, cell programs and environmental perturbations (data kindly provided by Audrey Gasch).
Machine-learning approach
We interpret the problem of predicting links between RBPs and mRNAs as a binary classification task where edges in the interaction network can either be present or absent. Following training with known interactions and a random negative set, we make predictions that give us a probability for each object to belong to one class or another. To estimate the performance of the method, we use a subset of the data as a training set and the rest as a test set. We can then measure how many of the test set positive pairs we predict correctly, true positives (TP), how many we do not predict, false negative (FN), how many negative test pairs we predict, false positives (FP), and how many negative test pairs we correctly do not predict, true negatives (TN). Measures of performance are defined as follows: Specificity = TN/(TN+FP), sensitivity = TP/(TP+FN), accuracy = (TP + TN)/(TP + TN + FP + FN). We also used receiver operating characteristic (ROC) curves to visualize how changing the threshold of probability, which we consider the boundary between negative and positive prediction, changes the number of TPs and FPs (ROCR package for R). In the ROC curves, the color represents the threshold of probability, each point of the curve having as coordinates the number of TPs and FPs obtained with the threshold given by its color, ranging from 0 to 1 as shown in the color bar. An additional measure of performance is the area under the ROC curve (AUC), which is equal to 0.5 in the case of totally random predictions and equal to 1 when all the predictions are correct.
SVMs
SVMs are tools that have been used extensively to perform classification and regression tasks in multidimensional spaces (24). We trained our SVMs using package e1071 in R which is an implementation of LibSVM (28). The objects in our classifications are pairs of proteins and mRNAs, and we use the gene and protein features as coordinates of each of the objects in a multidimensional space, scaling them to unit variance and zero mean. The first step involves finding the support vectors, which define the maximal distance plane from the two object classes. Once these are known, they can be used to classify objects of unknown class, based on their features. We chose a Radial Basis Function kernel that allows us to consider non-linear relationships between the features. Two parameters can be tuned, γ and the cost of misclassified objects in the training set C. These were optimized using a parameter search function performed on a subset of the data in a cross-validation framework (tune.svm). Using other types of simpler kernels led to poorer performance in cross-validation tests (data not shown).
RF
A RF is a classifier based on growing an ensemble of decision trees, first proposed in (25). Amongst its advantages is the fact that the importance of features is automatically calculated. We used the randomForest package for R, growing 500 trees and we use the mean decrease inaccuracy as an estimate of the importance of each feature.
Training set construction
A positive set of RBP–mRNA interactions was taken from (26). A balanced negative set, where only the proteins and the mRNAs from the positive set were used, was assembled preserving the degree of both protein and mRNA. Only pairs for which all features were known were used both at the training and testing stages. Table 1 shows all the features and which ones were used in each of the different SVMs (Supplementary Table S1). The feature pairs were assembled by concatenating the protein and mRNA features in a single feature vector. The importance of maintaining the degree of each node of the network was recently highlighted by (29), where it was shown that not having this would lead to overestimation of the method's performance. Although it was deemed important to proceed in this fashion, previous results on unseen data obtained with less strictly balanced data sets were comparable to the ones presented.
Features used in the correlation analysis and in the predictions
| Feature class | Features and description of data | Protein | RNA |
|---|---|---|---|
| Gene Ontology | GO RNA metabolism, GO protein biosynthesis, GO transcription, GO transport, GO DNA metabolism, GO mitochondrion GO cell cycle, GO signaling, GO bioprocess GO metabolism | X | X |
| Chromosomal position | Chromosome, genomic strand, chromo. Start coordinates, chromo. Stop coordinates | X | X |
| Gene physical properties | Length (ORF length), number of introns, first intron GC, first intron length | X | X |
| Protein physical properties | Isoelectric point, kDa (mass), TRP, VAL, etc. (total) and A, Y, etc. (relative) abundance of each amino acid, sulphur content and nitrogen content | X | X |
| Other physical properties | Codon Adaptation Index, protein length, codon bias, frequency of Optimal Codons (FOP), hydropathicity (Gravy score, indicating hydrophylicity or hydrophobicity) aromaticity (frequency of aromatic amino acids such as Phenylalanine, Tyrosine and Tryptophan) | X | |
| Protein localization | Local. Vacuole, Local. Cytoplasm, Local. Nucleus, Local. End. Ret. | X | |
| Experimental translation | mRNA half-life, ribosome occupancy, ribosome density, mRNA levels | X | X |
| mRNA properties | mRNA properties (Vienna RNA package): stem density; number of stems; 3stems, 5stems and orfstems (per length in transcript sections); c3 c5 co (absolute number); mRNA fold. energy; score (PARS) | X | |
| Predicted protein structure | PSIPRED prediction of secondary structure: coils in struc., strands in struc., helix in struc | X | |
| UTR properties | UTR properties: 3′- and 5′-UTR length, 3′-UTR A cont. etc … (relative abundance of each RNA base for the two UTRs); u3AC etc … (dinucleotide occurence). | X | |
| Genetic interactions | Known genetic interactions from the BioGRID. | X | X |
Some features are used only for RBPs, some only for the mRNAs and some for both, as indicated. (Detailed feature names and references in Supplementary Table S1).
Statistics of protein and genetic interactions in the different data sets
Supplementary Table S2 lists the data that was used to calculate whether proteins that share mRNA targets are more likely to share physical interactions. The observed number of interactions in each subset is compared to the number expected from sampling the same number of pairs of proteins at random. Statistical Fisher's tests were also performed as described in Supplementary Table S2.
RESULTS AND DISCUSSION
Overall relationships between gene and protein features
To provide a framework for studying specific associations between RBPs and their mRNA targets, we first assembled available properties of genes and corresponding proteins in budding yeast and analyzed their global relationships. We compiled a large list of properties for all budding yeast genes, including mRNA properties, such as UTR characteristics, RNA structure, translational features, expression levels and protein properties, such as physical features and Gene Ontology associations (Table 1 and Supplementary Table S1). Multiple relationships were evident amongst these properties.
Considering all budding yeast proteins, we uncovered several new relationships (Supplementary Dataset S1, Bonferroni correction was applied to all P-values): proteins with high nitrogen content often localize to mitochondria, show higher isoelectric points, and are expressed at lower levels (Spearman r = −0.29, P < 10−73). We also detected strong correlations involving the physical locations of genes on the genome. For example, the 3′-UTR of genes tends to be longer on one of the DNA strands than on the other (WRST, P = 10−13). Although the reason for this intriguing difference remains to be explained, we also observe a correlation between 3′-UTR length and translational efficiency (measured by codon adaptation index). Tuller et al. (30) have noted a correlation between the 3′-UTR length and mRNA half-life and correspondingly mRNA levels, which could indicate a possible biological difference between genes on the two strands. The ribosome density correlates positively with the presence of predicted mRNA structure, expressed as the density of the stems on the transcript. This finding could be related to the observed inverse correlation between ribosome density and mRNA length (31–34). While this result by itself was not surprising, it suggested that the predicted secondary structure of mRNAs was reliable. Moreover, this finding is consistent with recent experimental measurements of paired bases in each mRNA (35). The score calculated from this experiment correlates with the number of stems predicted by the Vienna package; it also correlates negatively with the folding energy (r = −0.55 P < 10−200) and positively with the stem density (r = 0.48, P < 10−90).
Characteristic features of RBPs
We next focused on the list of budding yeast RBPs to identify what properties distinguish them from other proteins. Properties that characterize RBPs may reflect mechanisms for RNA binding and for binding specificities. We used WRST to assess differences between RBPs and other proteins (Supplementary Dataset S2). In addition to confirming previous observations (36), we found that RBPs had significantly greater nitrogen contents (WRST, P < 10−15). Moreover, we predicted the location of the RNA binding interfaces on each protein (37), which showed an even higher nitrogen content compared to the rest of the protein (Supplementary Figure S2). The amino acids that are more likely to bind to RNA are in fact rich in nitrogen [e.g. arginine (11), histidine]. RBPs also tend to have higher isoelectric points (WRST, P < 10−7). These data highlight that interactions between proteins and nucleic acids are mediated by electrostatic forces, with positive charges on the protein surface complementing negative charges on the RNA (38). We then proceeded to investigate the characteristics of a small subset of 40 RBPs for which targets are known (26). It is important to check for any significant difference with the other RBPs to ensure that the results are valid for all RBPs. The 40 RBPs with known targets showed only marginally lower translation efficiencies (WRST, P < 10−4) and higher hydropathicity (WRST, P = 0.001) compared to other RBPs. We therefore conclude that the RBP subset with known targets is largely unbiased (26) and that the observed characteristics are generally valid (Supplementary Dataset 2b).
Relationships between features of RBPs and their mRNA targets
We next searched for relationships between the properties of the 40 RBPs and properties of their reported mRNA targets. We considered over 12 000 protein–mRNA interactions (26). The negative controls were assembled by shuffling the RBPs and mRNAs from the positive set (Supplementary Dataset S3) into 100 randomized sets, preserving the number of interactions for each protein and for each mRNA (‘Materials and Methods' section).
Figure 1 shows heatmaps for correlations and corresponding P-values for the positive set and the average of the absolute values of the 100 randomized sets, with properties separated into protein and transcript features. This analysis highlights that correlations involving two protein or two mRNA features are present in positive and negative sets, whereas the positive set reveals additional correlations relating features of proteins to features of mRNA targets (Supplementary Datasets S4 and Supplementary Data). Figure 2A and B shows selected correlations in common between the positive and negative sets for protein and mRNA features respectively. Figure 2C shows selected correlations between features of RBPs and their mRNA targets that were significant only in the interacting pairs (Supplementary Dataset S6). The strongest correlation was seen between the relative amount of amino acids such as glycine, isoleucine and valine and the length of the mRNA target (Spearman r = −0.43, P < 10−160). Second, highly translated proteins, that is RBPs with high ribosome density, bind to shorter mRNA targets on average (Spearman r = −0.31, P < 10−71). Shorter mRNAs are highly expressed, which may require the RBPs that bind to them to be more abundant. Third, the relative amount of glycine correlates negatively with the presence of introns in the mRNA target (r = 0.15, P < 10−8), and the mRNA targets of proteins involved in RNA metabolism are enriched for introns (r = 0.15, P < 10−19), as expected due to their likely role in splicing (39). Fourth, proteins with high-isoelectric points tend to bind to long mRNAs with many stems (r = −0.18, P < 10−27); there is a negative correlation, however, between isoelectric point and relative proportion of bases in stems (r = −0.13, P < 10−14), suggesting that it is the actual length that matters and not the stem density.
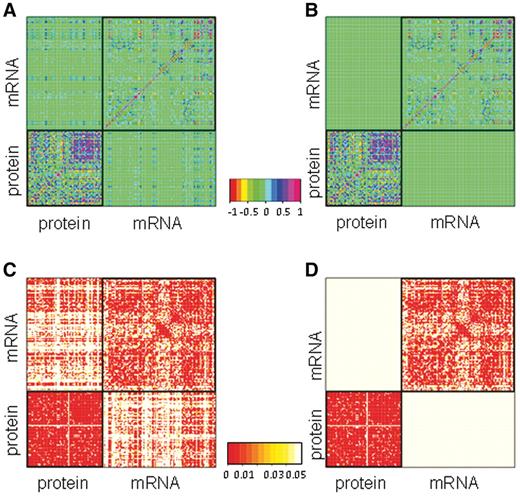
Differences in correlations between known RBP–mRNA pairs versus randomized sets. (A) Pair-wise Spearman correlation for positive protein–mRNA pairs. (B) Average of absolute value of Spearman correlation in the 100 randomized negative sets. (C) Spearman correlation P-values of the correlations in the positive set depicted in A. (D) Spearman correlation P-values of the correlations averaged over 100 randomized sets depicted in (B). Note how some correlations between the RBP features and corresponding target features are only present in the positive set (off-diagonal quadrants).
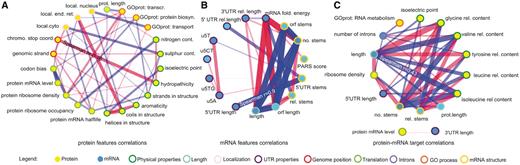
A selection of Spearman correlations between features of the budding yeast protein–mRNA pairs. Blue and red lines indicate positive and negative correlations, respectively, with thicker lines indicating stronger correlations. (A) Correlations of protein features, calculated for the 40 budding yeast proteins for which mRNA targets are known (26). (B) Correlations of mRNA features, calculated for all the mRNAs that are RBP targets. (C) Correlations between protein and mRNA features only present in experimentally verified RBP–mRNA interactions. Features are circled in different colors according to the type as indicated. Features and abbreviations are explained in Supplementary Table S1.
At the specific pH of the cytoplasm, longer proteins with higher isoelectric points are strongly positively charged and can balance the charge over longer stretches of negatively charged mRNA. Moreover, highly translated proteins are expected to be more abundant, so we speculate that the increase in protein concentration will favor complex formation even with weakly attracting short mRNA targets. Electrostatic properties have been shown to be useful in classifying RBPs into subclasses based on the RNA type they bind (38). Furthermore, the isoelectric point as well as the abundance of glycine correlate highly with the relative content of α-helices, β-strands and coils in the RBP (Spearman r = 0.61, P < 10−275), providing a possible link between the electrical properties of the protein and the structural features. Fifth, RBPs involved in transcription tend to bind to mRNAs with less structure (r = −0.1, P < 10−7). Finally RBPs that are highly expressed tend to bind to mRNAs with shorter 3′-UTRs (r = −0.1, P < 10−6). To conclude, we find a set of correlations specific to the RBP–mRNA pairs that could play a role in establishing the binding specificities of the RBPs, independent of any sequence or structural motifs on the mRNA targets.
Comparison with correlations found in human data
The described features allow us to analyze RBP–mRNA pairs in terms of their physical structure and constraints as well as their biological roles (e.g. through Gene Ontology) without relying solely on RNA and protein sequence motifs. We believe that the wealth of correlations identified here represents a general framework to understand post-transcriptional networks in other organisms, and to formulate hypotheses about molecular mechanisms that allow RBPs to recognize their RNA targets in vivo. A recent paper looked at explaining protein and mRNA levels based on different features of human proteins (40). Based on these data, we attempted to verify in human the correlations presented here. For example, these data show that the isoelectric point has a strong correlation with the partition energies of the protein (Spearman r = 0.42, P < 10−137), related to amino acid side chain properties, as well as with the Van der Waals volume (Spearman r = 0.15, P < 10−137), related to solvent accessibility. We thus assembled the lists of targets of five well-known human RBPs (41), for a total of 829 RBP–mRNA pairs and performed a correlation analysis similar to the one carried out for budding yeast. Although this small list is unlikely to be representative of all human RBPs, we again explored correlations that are present only in this interaction set and not in the 100 randomized sets. A significant inverse correlation between the partition energies of the protein, the Van der Waals volume and the target mRNA length was evident. The relative amount of glycine correlates with the mRNA target length, which was also found in our analysis in budding yeast (Supplementary Dataset S7). Although a detailed correlation analysis is not possible on such a small subset of RBPs, the finding that electrical and structural properties of the RBP are related to the length of the mRNA seems to be conserved from yeast to human.
mRNAs bound by the same RBP show high-expression correlation with each other and with the RBP
Keene et al. (42) and Hogan et al. (26) have observed that RBPs tend to bind to mRNAs that are functionally related. We used a compendium of genome-wide expression data for budding yeast under different conditions, including different stresses, drug treatments, mutants and cell-cycle stages, to assess expression correlations between the RBPs and their mRNA targets (43–45). We also used the protein interactions documented in BioGRID (46) for RBPs and the proteins encoded by their mRNAtargets.
After identifying the RBPs with less than 500 targets, we investigated whether sets of mRNAs bound by the same RBPs show higher expression correlation. For the 40 RBPs with known targets (26), we found a higher average expression co-regulation for mRNAs bound by the same RBP compared to pairs of mRNAs bound by different RBPs (0.18 versus 0.16 mean of absolute correlation; WRST, P < 10−16); however, expression of RBPs was often anticorrelated with that of their targets, leading to an average correlation close to 0. This result was robust for RBPs with less than 50 targets each, with a slightly decreasing but significant difference obtained with decreasing target numbers. The expression correlation of a pair of mRNA targets itself correlated with the number of RBPs that bind to both of them (a maximum of 10 in our data set, Spearman Rank correlation = 0.06, P < 10−16). Notably, pairs of mRNAs that are bound by the same eight RBPs show considerably higher expression correlation than pairs of mRNAs bound by fewer RBPs (Figure 3A). Moreover, RBPs themselves showed significantly higher expression correlation with their mRNA targets across multiple conditions (WRST, P < 10−8), compared to the randomly generated negative pairs (Figure 3B).
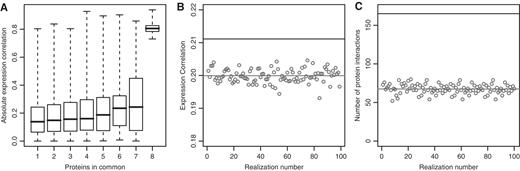
Differences in expression correlation and interactions in the positive and negative sets. (A) The average absolute correlation of mRNAs bound by the same RBPs is higher when more RBPs are shared (Spearman r = 0.08, P < 10−16), particularly when eight RBPs bind the same two targets. (B) The absolute expression correlation between RBP and mRNA targets is higher in the positive set of RBP–mRNA pairs (black line) than it is in random pairs (gray circles with gray line showing the average. (C) There are more physical protein interactions between RBP and mRNA pairs in the positive set (black line) than in the randomized sets (gray circles with gray line showing the average). The same analysis carried out on two other interaction data sets is shown in Supplementary Figure S3.
RBPs that bind to the same mRNAs often interact with each other
Many mRNAs are bound by combinations of multiple RBPs, and RBPs that bind to the same mRNA targets can physically interact with each other (47). To test whether this is a general trend, we collected all physical protein–protein interactions in BioGRID (46). These interactions included both small- and large-scale data for a total of 43 776 protein pairs. Notably, it was 1.5 times more likely (Fisher's test P = 0.0004) to find physical interactions among RBPs sharing mRNA targets than among random pairs of RBPs from the Hogan et al. data (Supplementary Table S2). We conclude that RBPs-sharing mRNA targets are more likely to interact with each other than expected by chance, even considering that RBPs are in general more likely to interact with each other than other proteins (Fisher's test P < 10−16, Supplementary Table S2). The 40 proteins with known targets (26) are even more interconnected than the other RBPs (Fisher's test P = 10−5). This result confirms and extends the finding that RBPs that share sets of targets are often known to physically interact (26) and is consistent with the hypothesis of combinatorial control of mRNAs by multiple RBPs that can form complexes (5). The analysis was repeated using only interactions that have at least two lines of evidence in BioGRID, excluding Yeast-Two-Hybrid, and also using the recently assembled, complexosome, a consensus of complexes experimentally verified in budding yeast (48). Most of the trends identified were confirmed although there appear to be differences in the three data sets, with the duplicate BioGRID data going against the observed trends (Supplementary Table S2).
RBPs often bind to the mRNAs that encode their interaction partners
Notably, RBPs in (26) and the cognate proteins of their mRNA targets showed ∼20 times more than the expected number of physical interactions documented in BioGRID (Fisher's test P < 10−16; Supplementary Table S2), although this effect was reduced when considering more strictly verified interactions or the consensus of yeast complexes data set. Considering a restricted set of RBP–mRNA pairs training set, we found 165 interactions within the verified RBP–mRNA pairs, whereas the average number of interactions in the 100 random sets was 67, ranging from 52 to 80 (Figure 3C). Repeating the analysis with the complex consensus data leads to similar results whereas the trend is not observed in the duplicate BioGRID data (Supplementary Figure S3). This result raises the intriguing possibility that RBPs tend to regulate their interaction partners at the mRNA level, possibly generating an auto-regulatory system where the levels of expression of all members of a complex can be post-transcriptionally coordinated by selected proteins within the complex. We additionally found that when the RBP and potential target are co-regulated, they are even more likely to interact (Fisher's test P < 10−11; Supplementary Table S2). This finding is consistent with the high-expression correlation we observed amongst mRNAs bound by the same RBPs, and with results indicating specialized protein production sites (49). We note, however, that the relationship between RBPs and their targets seems to be expressed both by positive correlation and in other cases by negative correlation, indicating that the same RBP could potentially stabilize a set of its targets and promote the destabilization of others.
Prediction of mRNA targets of RBPs in budding yeast
We tested whether the acquired information, obtained from features of RBPs and their mRNA targets is sufficient to predict unknown RBP targets, without any use of motifs and experimentally measured binding specificities. We integrated all the features described above to predict RBP–mRNA interactions using two machine-learning approaches, which provide probabilities for interactions between any RBP–mRNA pair. The data from the 40 RBPs with known targets (26) and a degree balanced randomized set were used as positive and negative training sets, respectively (Supplementary Datasets S3 and Supplementary Data, ‘Materials and Methods’ section). We trained a SVM (24) and a RF algorithm (25) using the same data. We measured the performance of our method using the accuracy (proportion of correct predictions) and AUC, which describes the relationship between false positive and true positive rate (‘Materials and Methods’ section). Selecting only pairs for which all data are available, we kept a total of 5166 positive RBP–mRNA pairs for the positive set and the same number of negative pairs.
To validate the model, we performed 2-fold cross validation 10 times using both SVM and RF, where one half of the data was used for training and the other half for testing. We obtained an average accuracy of 0.69 and an AUC of 0.77 (Figure 4). We also calculated the performance of the SVM based on three repeats of a 5-fold cross validation test, where one fifth of the data was excluded from training and predicted, reaching an average accuracy of 65.7% (Supplementary Dataset S9). A leave-one-out experiment gave comparable results, where all of the training set apart from one pair was used to predict the class of that one pair (data not shown). According to this analysis, both SVM and RF did not suffer from over- or under-prediction, with sensitivity and specificity both around 70%. RF performed slightly better than SVM. RF allows testing of the importance of each feature in the predictions. This analysis confirmed the importance of mRNA length as well as the relative amounts of glycine and the presence of alpha helices in the RBP (Supplementary Dataset S10).
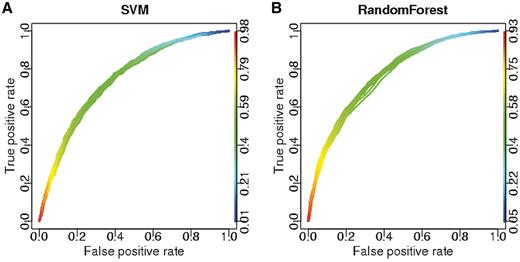
Performance of machine-learning approaches in 2-fold cross validation tests. ROC curves for predictions of budding yeast RBP–mRNA interactions. (A) SVM, 10 ROC curves with average AUC = 0.75. (B) RF, 10 ROC curves with average AUC = 0.77. See ‘Materials and Methods’ section for details on ROC curves.
Assuming that the binding of RBPs is only determined by a preference for specific sequence or structure motifs on target mRNAs, we would not expect our machine-learning approaches to perform better than a random assignment for RBPs not included in the training set, because the preferences of the RBPs in the training set would not suffice to predict targets for other RBPs. To test this prediction, we analyzed our model's performance on RBPs for which no targets are known. We predicted the mRNA targets for each RBP, having removed all interactions of that RBP from the training sets, thus pretending not to know any of the targets. We observed performance differences across the RBPs, and for about half of them the accuracy was higher than random (Supplementary Dataset S11). For the pairs that we can correctly classify, the method tends to over-predict, with an average sensitivity of 62% but a specificity of only 53%. Generally, both SVM and RF achieve an accuracy of only 50% (specificity of 50% and sensitivity of 49%). There does not appear to be any dominant characteristic for RBPs for which we can successfully predict targets; some of these RBPs have known RNA-binding motifs, but their presence does not seem to be a factor affecting the prediction (Supplementary Dataset S11).
The method seemed to work particularly well for She2p, an RBP functioning in asymmetric localization of selected mRNAs (50–51). We predicted many correct specific interaction targets for this protein, achieving an accuracy of ∼70% (specificity of 83% and sensitivity of 58%). Notably, we also predicted additional targets for this RBP that were not included in the data from (26) but are known from other experimental studies (50–51) and new targets. A total of 189 mRNA targets were predicted both by SVM and RF (Supplementary Dataset S12). These mRNAs are enriched for the GO term ‘cell wall organization or biogenesis’ (P = 10−5, Supplementary Dataset S12), raising the intriguing possibility that She2p transports mRNAs involved in cell wall formation to the site of polarized growth.
As described above, we are aware of a limitation of our model in determining targets for RBPs for which no targets are known. However, the input of a few mRNA targets can substantially improve the chances of predicting additional unknown targets. We proceeded to predict targets of Nop15p (51), for which no targets were included in the training sets as this RBP is not included in the 40 RBPs with known targets (26). We correctly identified only 6 of the 51 mRNA targets for which data were available. However, if we included in a new enhanced training set some of the predicted targets that are verified experimentally (51), we recovered 32 mRNA targets (Figure 5). Even after reducing the number of false positives by setting the threshold to 0.7 instead of 0.5, we could still predict 16 targets, compared to the eight expected by random guess. We conclude that our model is currently limited by the known RBP–mRNA interactions and will become more widely useful with increasing availability of experimental data.
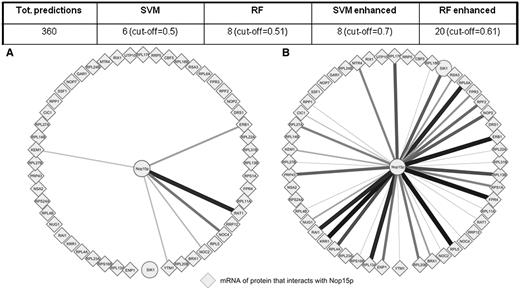
Predicting interactions of Nop15p, an RBP without targets in training set. A total of 51 interactions with data can be predicted, a subset of the set identified in (51). The number in brackets is the threshold of probability for which 360 predictions are obtained, to compare the different methods. Enhanced results are obtained after adding eight positive predictions to the training set. (A) Only six of the 51 targets are predicted. (B) Enhancing the training set with the six interactions that were predicted and experimentally verified in (51) we could predict 32 of the 51 targets. Thicker lines indicate more confident predictions. Targets represented with diamonds are proteins with which Nop15p is known to physically interact. The target which is represented with a circle is the only mRNA target whose protein is not physically interacting with Nop15.
Prediction of mRNA targets of RBPs in fission yeast
We established that the available data in budding yeast can be used to predict RBP targets without relying on RNA sequence or structure motifs and with an accuracy which will increase as more experimental data become available. The principles underlying RBP–RNA binding are likely conserved, and many features used for the predictions are also available in other organisms. As more organisms are sequenced, it becomes increasingly important to exploit the annotation and functional information available from model organisms to characterize additional species. To test cross-species RBP target prediction, we extended our method to fission yeast, which is only distantly related to budding yeast. A number of features used for the budding yeast predictions could not be used to predict fission yeast RBP targets, presumably due to experimental and/or biological differences. As the SVM seemed to perform better on absent data, we chose this method to extend the predictions to fission yeast. The SVM trained on budding yeast RBP–mRNA data, but with only a subset of the features, was used to predict targets of four fission yeast RBPs: Csx1p, Cdc5p, Mei2p and Meu5p. We compared our predictions with targets identified by preliminary RIP-chip experiments for the same RBPs (J. Mata, personal communication); reassuringly, some overlaps were found (Fisher, P = 10−32, 0.02, 0.06 and 0.5, respectively; TextS1, Supplementary Figure S1 and Supplementary Dataset S13). However, we predicted only 14 of the 76 Meu5p targets that have been recently identified experimentally (52). This performance suggests that the application of the model across species is limited by the features that can be used in the training and by the assumptions about conservation, which are quite strict and unproven. Nonetheless, these results are encouraging, and we expect that with additional experimental data becoming available for training, our approach will show improved applicability to other species.
Concluding remarks
Some RBPs have defined RNA binding motifs and bind to known motifs on their target mRNAs, which suggests that improved bioinformatics methods could be used to map such interactions. However, we have shown that there are additional relationships between RBPs and their targets which could facilitate specific target predictions independently of sequence motifs. A combination of machine-learning and motif-based approaches may therefore be even more powerful to uncover RBP–mRNA interactions. Recent experiments suggest that the number of RBPs in yeast is highly underestimated, providing experimental evidence for proteins binding to specific RNAs without containing any of the recognized RNA binding motifs (53,54). These findings motivate efforts in exploring RBP–mRNA interaction networks with less restrictive, non-motif-centred approaches.
The two machine-learning approaches achieved comparable performance, although RF may produce better results in the cross-validation stages than SVM, which were, however, not matched by better prediction accuracy on the test sets. An important issue in our analysis is the small number of RBPs for which the mRNA targets have been experimentally identified. A larger set of RBPs with known targets would allow us to distinguish general principles from correlations that reflect biases of the available data. As expected, mRNA targets of RBPs for which no targets are known were not predicted with machine learning, with a few exceptions. Nevertheless, knowing even a few targets of an RBP will allow prediction of additional targets. Hence, a more complete training set, containing a wider range of RBPs, would greatly improve the predictive power of this approach (Figure 6). Over-fitting is probably another limiting factor for the SVM approach, suggesting that applying feature selection methods could lead to improved results by increasing the method's generalization capability. However, RF performs feature selection automatically, and it did not show a significantly better performance. Moreover, we believe that some level of redundancy in the information embodied in the features is useful to buffer errors in experimental measurements and in predicted features such as RNA and protein structures.
![Diagram reflecting the bias present in the currently available data. This diagram shows why knowing more RBP targets helps to improve the predictions. The feature set for one of our objects is composed of protein and mRNA features, implying that all objects involving the interaction of one RBP with different mRNA targets will have a large set of identical features. Each feature is a coordinate on an axis of a multidimensional space. The 2D space represented here shows two of these axes, with the x-axis corresponding to one RBP feature and the y-axis corresponding to one mRNA feature. It follows that pairs of the same RBP with different mRNAs have the same coordinates on the x-axis. Three different training sets are represented with squares (interacting pairs) and circles (non-interacting pairs). The training defines a boundary between two regions of the 2D space, one for interacting pairs and one for non-interacting pairs. The black triangle represents a new RBP–mRNA pair with known features (i.e. its position), but unknown interaction (i.e. its shape). If we used the boundary established during SVM training shown in (A), we would not be able to conclude whether the new pair interacts. The boundary could include the triangle on either side with equal probability. However, with just one known interaction of this RBP in the training [indicated by the extra square and circle in (B) and (C) at x = 2.5] the boundary would be better defined and we could be more certain that the new pair either interacts (B) or not (C).](https://oup.silverchair-cdn.com/oup/backfile/Content_public/Journal/nar/39/14/10.1093_nar_gkr160/2/m_gkr160f6.jpeg?Expires=1716349434&Signature=vFxyYNL-XqNEW72LZj8NgX7XDZT1~djDk-Qtn5kpCbmG~8x9r43GRDHchyLfG0zmE7FGVRPMFLQEKlIY0wOeMUclvc5eB72FivvTdNF35qP9PDiOLMB4BocimUaR24SgYuAAcQoyheo5UqlhQdtDv0lI5DKEB1Bm3NSEvTmon4qDloVWlsUKQraS1d-02BMAGoC5RswY-KN1vL-UEeV8nTST17tShtbg6WQLSIYGNDpTso7RtZYoCAfszA0nS6OYyfAkxjPJygwPNiYOGAYGhQ9MaJtH2hIUmdzRSacw-DWkiB72CXuvTIOeLWPv5JzKsYQzaIgeH~7ltwBL9Mhgvw__&Key-Pair-Id=APKAIE5G5CRDK6RD3PGA)
Diagram reflecting the bias present in the currently available data. This diagram shows why knowing more RBP targets helps to improve the predictions. The feature set for one of our objects is composed of protein and mRNA features, implying that all objects involving the interaction of one RBP with different mRNA targets will have a large set of identical features. Each feature is a coordinate on an axis of a multidimensional space. The 2D space represented here shows two of these axes, with the x-axis corresponding to one RBP feature and the y-axis corresponding to one mRNA feature. It follows that pairs of the same RBP with different mRNAs have the same coordinates on the x-axis. Three different training sets are represented with squares (interacting pairs) and circles (non-interacting pairs). The training defines a boundary between two regions of the 2D space, one for interacting pairs and one for non-interacting pairs. The black triangle represents a new RBP–mRNA pair with known features (i.e. its position), but unknown interaction (i.e. its shape). If we used the boundary established during SVM training shown in (A), we would not be able to conclude whether the new pair interacts. The boundary could include the triangle on either side with equal probability. However, with just one known interaction of this RBP in the training [indicated by the extra square and circle in (B) and (C) at x = 2.5] the boundary would be better defined and we could be more certain that the new pair either interacts (B) or not (C).
We have shown that our method can be applied to other species for which key features are known but the RBP targets are not. Besides supporting the mapping of RBP–RNA interactions in less studied organisms, there could be an advantage in pooling together RBP targets from different species. Such an approach would also increase our chances of understanding the universal principles of protein–RNA interactions that ultimately control posttranscriptional regulatory networks.
FUNDING
Cancer Research UK; PhenOxiGEn (an EU FP7 research project). Funding for open access charge: EC FP7.
Conflict of interest statement. None declared.
ACKNOWLEDGEMENTS
We thank Juan Mata for inspiring discussions and for sharing unpublished data, Audrey Gasch and Christine Vogel for helping with budding yeast data, Christine Vogel and Neelanjan Mukherjee for help with the human protein data. We are also grateful to Caia Duncan, Dan Jeffares, Sam Marguerat and Juan Mata for comments on the article. We also would like to thank an anonymous referee for useful comments and suggestions.
REFERENCES
Author notes
Present address: Vera Pancaldi, Department of Plant sciences, University of Cambridge, Downing Street, Cambridge, CB2 3EA, UK.

Comments