


Abstract
FeatureMap3D is a web-based tool that maps protein features onto 3D structures. The user provides sequences annotated with any feature of interest, such as post-translational modifications, protease cleavage sites or exonic structure and FeatureMap3D will then search the Protein Data Bank (PDB) for structures of homologous proteins. The results are displayed both as an annotated sequence alignment, where the user-provided annotations as well as the sequence conservation between the query and the target sequence are displayed, and also as a publication-quality image of the 3D protein structure with the selected features and sequence conservation enhanced. The results are also returned in a readily parsable text format as well as a PyMol ( http://pymol.sourceforge.net/ ) script file, which allows the user to easily modify the protein structure image to suit a specific purpose. FeatureMap3D can also be used without sequence annotation, to evaluate the quality of the alignment of the input sequences to the most homologous structures in the PDB, through the sequence conservation colored 3D structure visualization tool. FeatureMap3D is available at: http://www.cbs.dtu.dk/services/FeatureMap3D/ .
INTRODUCTION
The 3D structure and flexibility of proteins determine their function in biological processes. The reactive mechanism and specificity of enzymes is determined by the active site residues location relative to each other in the protein structure, post-translational modification of proteins, such as glycosylation or phosphorylation affect residues on the surface of proteins and localization signals, such as Nuclear Export Signals (NES) are a part of the 3D protein structure. Alternative splicing of genes can only result in functional proteins if the exonic structure is compatible with a foldable protein structure. When studying protein features, it is relevant to investigate their localization in the biologically functioning form of the protein: the 3D protein structure ( 1 , 2 ).
The protein sequence databases are growing at a much faster rate than the Protein Structure Databank (PDB) ( 3 ). However, with a few notable exceptions ( 4 , 5 ), it is generally believed that if two proteins share 50% or higher sequence identity, their structures are expected to have the same overall fold ( 6 ). Although there are examples of mutations that dramatically affect the structure of a protein ( 7 ), most point mutations outside the catalytic site have relatively small structural effects ( 8 ). Therefore, provided sufficiently high sequence homology, it is possible to transfer structural information from proteins in the PDB to their structurally uncharacterized homologues.
The FeatureMap3D server can be used in two ways. If the user simply needs to perform a BLAST ( 9 , 10 ) search of a sequence against the PDB, a protein sequence in FASTA format can be submitted to the FeatureMap3D server. If the search results in one or more hits, the PDB structure of the homologous protein(s) will be shown in a publication quality image, with the sequence conservation between the query sequence and the target protein structure mapped onto the structure in color. The alignment of the query and the target sequence is also given, along with the sequence numbering of the two sequences and the DSSP secondary structure annotation ( 11 ). If an active site is annotated in the PDB structure, it is automatically labeled in the sequence alignment and the active site residues are shown in the figure in stick representation. This functionality works independently of the user specified annotation mentioned below.
The FeatureMap3D server can also be used with pre-annotated sequences, to show directly the localization of protein features in the 3D structure of a homologous protein. The annotation can be provided in two ways: (i) using a descriptive format in a separate input field for annotation a FASTA file (useful for single residue annotation), or (ii) using a TAB format file, which contains both sequence and annotation information directly (detailed description on the website).
The location of any such annotated feature will be displayed at the corresponding site in the structure of the hit, by highlighting the amino acid residue of the hit structure at that position. The server has a number of predefined graphical representations of annotation for both animo acid side-chain and backbone—see Table 1 for details. The hit structure therefore does not need to have N-glycosylation or even an asparagine at an annotated N-glycosylation site—the image simply shows where in the structure of the hit the glycosylated residue would be, based on the sequence alignment shown below the figure.
The structure is colored by sequence conservation, which makes it easy to see, whether the feature of interest is located in a highly conserved part of the structure, or whether it is in a region of poor sequence conservation. In the latter case, the local 3D structure of the query sequence is less likely to be well represented by the structure of the hit protein.
Although other public domain tools and WWW servers are able to perform BLAST searches against the PDB ( 12 ) or to map annotated features onto 3D structures ( 13 ), this is to our knowledge the first server, which combines these tools and which provides an easy means of producing publication quality images of the results.
SOFTWARE FEATURES
Basic functionality
FeatureMap3D works according to the following workflow.
Step 1: searching
All input sequences are aligned to the PDB using blastp ( 10 ).
Hits against structures that are not based on X-ray or NMR are discarded.
Hits not fulfilling the user-adjustable criteria for significance are discarded.
The best hit is selected. Optimization criteria: best homology and best resolution in combination.
A report file (the ‘GetStruct report’) containing the mapping between the input data and the PDB match is created. This file also contains the optional sequence feature annotation of the input sequence and a number of calculated features from the PDB entry.
Step 2: visualizing
Based on the ‘GetStruct report’ a PyMol script ( * .pml) is autogenerated, which colors the matched PDB structure according to coverage and quality of the hit and the optional protein feature annotation supplied by the user. Using the generated PyMol script (which is available to download on it’s own) a publication quality ray-traced image is generated.
Also based on the ‘GetStruct report’ an annotated pairwise alignment is generated, containing both information about coverage and homology as well as protein feature annotation.
Finally the following files are offered as both separate downloads as well as in a single packed archive: GetStruct report, PDB file, ray-traced 3D image and the PyMol script. This makes it very easy for the user to download all the relevant data and manipulate the colored PDB structure in PyMol on the local computer. Local processing of the colored structure requires the PyMol program, available separately for download at http://pymol.sourceforge.net/ .
Integrating annotation of protein features
In addition to working on standard FASTA files, FeatureMap3D has the option of working on files containing annotation of protein features, for example annotated glycosylation or phosphorylation sites, or annotation of the underlying exon structure ( 14 ). Table 1 shows an overview of the annotation recognized by FeatureMap3D.
EXAMPLES OF USE
Mapping sequence homology and the underlying exon structure
Figure 1 illustrates two of the main features of FeatureMap3D, namely the color-coding of the quality of the sequence alignment ( Figure 1A ) and the color-coding of user defined sequence annotation ( Figure 1B ). The annotated pairwise alignment generated by the server is shown in Figure 1C.
The data shown in Figure 1 was generated as follows. A TAB file containing the DNA sequence and Intron/Exon structure of the Columba livia Alpha-A globin was constructed using the FeatureExtract software ( 15 ) on the GenBank entry AB001981. Next the DNA file was translated using the Virtual Ribosome software described elsewhere in this issue ( 14 ), yielding a TAB file containing both protein sequence and annotation of the underlying exon structure. Finally the peptide sequence was submitted to the FeatureMap3D server with ( Figure 1B and C ) and without ( Figure 1 A) the accompanying exon numbering annotation.
Mapping protein feature annotation onto a PDB structure
Rhamnogalacuturonan acetylesterase is an example of a protein with known active site residues and two N-glycosylation sites ( 16 ). The protein sequence (in FASTA format) was annotated using the option of entering a small descriptive annotation in the manual annotation text-field on the FeatureMap3D server. The three active site residues were labeled with ‘A’, and the two N-glycosylation sites were labeled with ‘N’. After submitting the query to the FeatureMap3D server, the zipped archive containing all relevant files was downloaded. The image in Figure 2 was prepared from the extracted PyMol script file by rotating the molecule, selecting the ‘stereo’ option, zooming to get the right size of the molecule and clicking on the ‘Ray’ button in PyMol. From the PyMol script file it is possible to customize the figure for many other views.
Types of annotation recognized by FeatureMap3D
| Letter | Description | Color | Graphics |
|---|---|---|---|
| . | Null annotation | . | . |
| A | Active site | yellow | stick |
| N | N-glycosylation | red | spheres |
| O | O-glycosylation | purple | spheres |
| S | S-phosphorylation | cyan | spheres |
| T | T-phosphorylation | slate | spheres |
| Y | Y-phosphorylation | blue | spheres |
| U | Tyr-sulfation | orange | spheres |
| X | Generic PTM | white | stick |
| 0 | Custom backbone color | black | . |
| 1 | Custom backbone color | white/slate | . |
| 2 | Custom backbone color | red | . |
| 3 | Custom backbone color | cyan | . |
| 4 | Custom backbone color | purple | . |
| 5 | Custom backbone color | green | . |
| 6 | Custom backbone color | blue | . |
| 7 | Custom backbone color | yellow | . |
| 8 | Custom backbone color | orange | . |
| 9 | Custom backbone color | brown | . |
In the Color and Graphics columns ‘.’ means ‘No effect’. The description of the type of annotation is only meant as a guide-line, and the annotation letters can be freely used as a mean for highlighting any kind of feature (e.g. disulfide bridges can be annotated with ‘X’ to mark the positions in white stick representation or ‘A’ to use yellow stick representation).
![Visualizing the underlying exon structure of Columba livia Alpha-A globin. This figure illustrates the mapping of the protein sequence and underlying exon structure of Columba livia (domestic pigeon) Alpha-A globin onto the PDB structure 1A4F [ 17 ], which contains the Alpha/Beta-globin dimer from Anser indicus (bar-headed goose). ( A ) Shows the coloring scheme when the exon structure annotation is not used. Here the coloring reflect the alignment between the query protein sequence and the PDB protein sequence. Color key—green: perfect match; brown: mismatch (low significance); violet: mismatch (high significance); blue: sequence gap in query sequence; light gray; unmatched chain(s)—in the case the Beta-globin chain. ( B ) Shows the coloring when the exon structure is taken into account. Color key—slate-blue: exon 1, red: exon 2, cyan: exon 3, light gray: unmatched chains(s). ( C ) Shows the pairwise alignment generated by the FeatureMap3D server (here it has been color-coded to highlight both the underlying exon structure and the sequence homology). The topmost sequence is the query sequence (Alpha-D), the sequence below is the PDB hit sequence (1A4F, chain a). The line above the query sequence holds the (optional) annotation information (here the numbers 1, 2 and 3—indicating the exon number). The line below the PDB sequence contains DSSP secondary structure information (inferred from the PDB entry).](https://oup.silverchair-cdn.com/oup/backfile/Content_public/Journal/nar/34/suppl_2/10.1093_nar_gkl227/2/m_gkl227f1.jpeg?Expires=1716481822&Signature=4ykbIoC5oFDZ2ma-uAdFNRxaS~j0dJUzpkVAh3M3DXIEt9RbX3fkfXsU8KUI1ObNn27nD~7JAkiyiCeqdgUMWvGdQ2OB0vwaD~LkKmUoFL4EYZOyXF32REEjHrUEn35GKroOcpR2q8Uwlz-WWSQ8pUvLCeNHziDt-qHjZK1jsETiReV6W~ATCZzY2SOcsclSKIYqd-8MHNvr-t3AWsxvVncF0Zm57vrDSWPfvMEG4xlnSGXmYiocAfp-2hVZ3biHkcw-lgNPFBdL37DMl0u9rYSVrfz1Mp2wYtkWEbq7~RM2FbYnSq3OWAlvBPh9vzpC9rf5RuuNxnwEVpg0uUDDiA__&Key-Pair-Id=APKAIE5G5CRDK6RD3PGA)
Visualizing the underlying exon structure of Columba livia Alpha-A globin. This figure illustrates the mapping of the protein sequence and underlying exon structure of Columba livia (domestic pigeon) Alpha-A globin onto the PDB structure 1A4F [ 17 ], which contains the Alpha/Beta-globin dimer from Anser indicus (bar-headed goose). ( A ) Shows the coloring scheme when the exon structure annotation is not used. Here the coloring reflect the alignment between the query protein sequence and the PDB protein sequence. Color key—green: perfect match; brown: mismatch (low significance); violet: mismatch (high significance); blue: sequence gap in query sequence; light gray; unmatched chain(s)—in the case the Beta-globin chain. ( B ) Shows the coloring when the exon structure is taken into account. Color key—slate-blue: exon 1, red: exon 2, cyan: exon 3, light gray: unmatched chains(s). ( C ) Shows the pairwise alignment generated by the FeatureMap3D server (here it has been color-coded to highlight both the underlying exon structure and the sequence homology). The topmost sequence is the query sequence (Alpha-D), the sequence below is the PDB hit sequence (1A4F, chain a). The line above the query sequence holds the (optional) annotation information (here the numbers 1, 2 and 3—indicating the exon number). The line below the PDB sequence contains DSSP secondary structure information (inferred from the PDB entry).
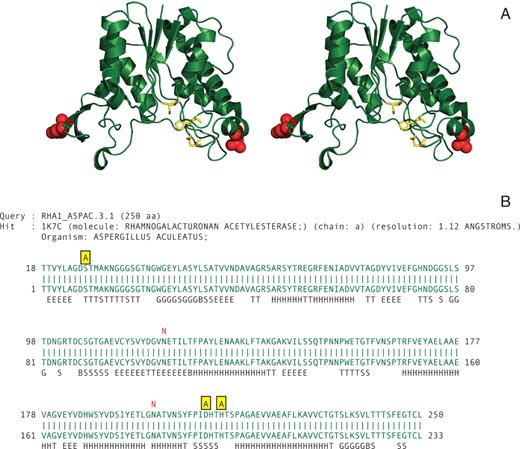
Stereo view of the 3D structure of Aspergillus aculeatus rhamnogalacturonan acetylesterase ( 16 ) showing the localization in the structure of the annotated residues. The catalytic triad residues are shown in yellow stick representation, and the glycan structure bound at the two N-glycosylation sites is shown as red spheres ( A ). ( B ) The pairwise sequence alignment generated by the FeatureMap3D server. The catalytic residues are shown in yellow in the annotation line above the sequences and the two N-glycosylation sites are indicated in red.
Dikeos Mario Soumpasis, Ramneek Gupta and Søren Brunak are thanked for helpful discussions. This work is supported by a grant from The Danish National Research Foundation and The Danish Research Agency. Funding to pay the Open Access publication charges for this article was provided by The Danish Research Agency.
Conflict of interest statement . None declared.
REFERENCES
Cour, T., Kiemer, L., Mølgaard, A., Gupta, R., Skriver, K., Brunak, S.
Julenius, K., Mølgaard, A., Gupta, R., Brunak, S.
Berman, H.M., Westbrook, J., Feng, Z., Gilliland, G., Bhat, T.N., Weissig, H., Shindyalov, I.N., Bourne, P.E.
Dalal, S., Balasubramanian, S., Regan, L.
Koehl, P. and Levitt, M.
Glykos, N.M., Cesareni, G., Kokkinidis, M.
Sinha, N. and Nussinov, R.
Altschul, S.F., Gish, S., Miller, W., Myers, E.W., Lipman, D.J.
Altschul, F., Madden, T.L., Schaeffer, A.A., Zhang, J., Zhang, Z., Miller, W., Lipman, D.J.
Kabsch, W. and Sander, C.
Li, W., Jaroszewski, L., Godzik, A.
Prlic, A., Down, T.A., Hubbard, T.J.P.
Wernersson, R.
Wernersson, R.
Mølgaard, A., Kauppinen, S., Larsen, S.

Comments