


Abstract
Population genetic analyses often use polymorphism data from one species, and orthologous genomic sequences from closely related outgroup species. These outgroup sequences are frequently used to identify ancestral alleles at segregating sites and to compare the patterns of polymorphism and divergence. Inherent in such studies is the assumption of parsimony, which posits that the ancestral state of each single nucleotide polymorphism (SNP) is the allele that matches the orthologous site in the outgroup sequence, and that all nucleotide substitutions between species have been observed. This study tests the effect of violating the parsimony assumption when mutation rates vary across sites and over time. Using a context-dependent mutation model that accounts for elevated mutation rates at CpG dinucleotides, increased propensity for transitional versus transversional mutations, as well as other directional and contextual mutation biases estimated along the human lineage, we show (using both simulations and a theoretical model) that enough unobserved substitutions could have occurred since the divergence of human and chimpanzee to cause many statistical tests to spuriously reject neutrality. Moreover, using both the chimpanzee and rhesus macaque genomes to parsimoniously identify ancestral states causes a large fraction of the data to be removed while not completely alleviating problem. By constructing a novel model of the context-dependent mutation process, we can correct polymorphism data for the effect of ancestral misidentification using a single outgroup.
Introduction
Identifying the action of natural selection from patterns of standing genetic variation has long been of interest to the population genetic community. The recent confluence of genomic data and the requisite computational power for large scale analyses now make this important goal a tractable problem. Of the many statistical methods developed to detect the presence and infer the strength of natural selection, those that make use of the frequency distribution of all derived mutations observed in a sample of chromosomes (the unfolded site-frequency spectrum, or SFS) appear to be the most powerful (Sawyer and Hartl 1992; Hartl et al. 1994; Akashi 1999; Bustamante et al. 2001; Nielsen et al. 2005b).
One technique that has been applied to make analysis of the SFS more robust to demographic and non-stationary evolutionary processes is to compare the SFS in a region of interest to the SFS in a genomic region putatively untouched by natural selection (Akashi 1999; Williamson et al. 2005). However, as large scale human polymorphism data has become available, a striking pattern has emerged. Figure 1 shows the normalized SFS expected under the standard neutral model (SNM) (Watterson 1975; Hudson 1990; Fu 1995) and the normalized SFS for the observed non-coding and synonymous mutations from 161 gene regions sequenced across a world-wide panel of 95 humans (NIEHS panel 2, as described in Hernandez et al. 2007). A visual inspection of figure 1 suggests that the observed data show an overrepresentation of both low and high frequency mutant alleles and a paucity of intermediate ones compared to the SNM.
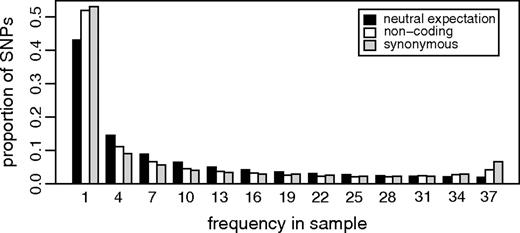
The normalized SFS expected under the standard neutral model and observed in putatively neutral regions (non-coding and synonymous). SNPs with missing data were incorporated by generating the expected SFS in a sub sample of 40 chromosomes (Marth et al. 2004; Nielsen et al. 2004), then all SNPs were pooled into frequency bins of size 3.
An observed skew toward rare alleles is generally attributed to either the effect of natural selection restricting the spread of slightly deleterious mutations (Fu and Li 1993; Williamson and Orive 2002), or to the effect of a growing population where most mutations tend to be young (Slatkin and Hudson 1991; Griffiths and Tavaré 1994). A relative excess of mutant alleles at high frequency compared to the SNM is typically attributed to the presence of recurrent positive natural selection (Akashi and Schaeffer 1997; Hartl et al. 1994; Bustamante et al. 2001), linkage to the target of a recent selective sweep (Kim and Stephan 2000; Fay and Wu 2000), or the existence of hidden population substructure with low levels of migration (Wakeley and Aliacar 2001). Because the data used here includes several individuals from each population, hidden population structure is unlikely to have caused the excess high frequency tail, therefore an excess of both low and high frequency mutant alleles casts doubt upon the assumption of selective neutrality for both non-coding and synonymous mutations.
Another explanation for the relative excess of high frequency mutations in putatively neutral regions is based on violations of the parsimony assumption used to construct the SFS. Namely, if a substitution occurred during the divergence time of the 2 species being compared, and a subsequent polymorphism (back mutation) recently arose at the same site, then the nucleotide observed in the outgroup would not be the ancestral state of the SNP. Since most mutations are transitions, multiple mutations at a site (multiple hits) would often be back mutations, thus ancestral misidentification would often times go unnoticed. Because most derived mutations are expected to be rare (Watterson 1975; Fu 1995), ancestral misidentification would most often result in mislabeling low frequency mutations as high frequency ones (Baudry and Depaulis 2003).
Previous studies that have addressed multiple hits have either focused on correctly counting the number of substitutions between 2 diverged sequences (Jukes and Cantor 1969; Kimura 1980), or correctly counting the number of segregating mutations in a sample of sequences from hypervariable regions (Tajima 1996; Yang 1996). These studies typically assume that all sites are evolving homogeneously and at stationarity, but may allow for mutation rate variation across sites (though constant over time). However, recent analysis of mammalian sequences have revealed mutational patterns that are much more complex than these models account for. In particular, the mutation rate at a site appears to depend on the source and target nucleotides, as well as the adjacent nucleotides 5′ and 3′ of the site (Hwang and Green 2004; Siepel and Haussler 2004). Under such a context-dependent model, site-specific mutation rates can vary in magnitude as much as 50-fold (Blake et al. 1992; Hess et al. 1994; Hwang and Green 2004; Siepel and Haussler 2004). The largest change in site-specific mutation rates is due to the production (or removal) of a methylated CpG dinucleotide (the so called “CpG-effect”). Surprisingly, non-CpG sites can also vary as much 4-fold depending on their context (Hwang and Green, 2004). By taking the complexities of such a mutation process into account, we derive a mathematical model for the SFS that can correct for ancestral misidentification.
Materials and Methods
Theory
In this study, we consider a context-dependent nucleotide mutation model. This model assumes that the rate of mutation at a nucleotide site depends on its flanking nucleotide context (i.e., its 5′ and 3′ neighboring nucleotides), and is composed of 16 4 × 4 nucleotide mutation rate matrices (one for each pair of flanking nucleotides). For ease of notation, we consider , the 64 × 64 instantaneous trinucleotide mutation rate matrix that is restricted to only allow changes at the second position of each trinucleotide. Hwang and Green (2004) estimated the parameters of such a context-dependent mutation model assuming non-reversiblity and strand-symmetry from an untranscribed DNA sequence of length 5.2 Mb across 19 mammalian species. In our applications, we will use their estimates obtained along the human lineage, but our derivations will be sufficiently general to allow for any model of mutation rate variation (subject to additional assumptions as necessary).
The probability of substituting 1 nucleotide for another over a time interval ts in a fixed context (i.e., when both 5′ and 3′ nucleotides do not change), can be obtained from the probability substitution matrix , where . Note that time (ts) is scaled in terms of the expected number of substitutions per site, and that the main diagonal of was set so as to satisfy the mathematical requirement that each row sums to zero.
Probability of Ancestry
We will derive the probability of correctly identifying the ancestral state of a SNP when the orthologous site in the outgroup matches one of the segregating alleles. Let M be the unknown ancestral state of the SNP, with S the 2 segregating alleles (an unordered pair) and U the allele observed in the outgroup. Assume that the divergence time between species (ts) is scaled in terms of the number of substitutions per site and known. For simplicity, and to accommodate the structure of our context-dependent mutation model, we assume that the nucleotides flanking the polymorphism have remained constant since the divergence of the 2 species being compared (henceforth referred to as the constant context assumption).
Correcting the SFS
We consider the SFS constructed from a sample of n chromosomes with orthologous outgroup information. For all pairs of trinucleotides (generically denoted u and x) that meet the constant context assumption, let Nux(i) be the number of diallelic sites at which i chromosomes carry allele x, and the remaining n – i chromosomes as well as the outgroup carry the allele u. Nux(·) would then be the SFS for the inferred mutations. However, because of ancestral misidentification, Nux(·) is not necessarily the SFS for all SNPs of type . We therefore model Nux(i) as a mixture of the number of true mutations at frequency i whose ancestral states were correctly identified (an unknown number denoted by Rux(i)) and the number of true mutations at frequency n – i whose ancestral states were misidentified (another unknown number, denoted Rxu(n – i)).

There are 3 steps to implementing this correction:
Tally the number of SNPs in each trinucleotide mutation class at each frequency (e.g., = the number of ACG ATG SNPs with i chromosomes carrying ATG and = the number of ATG ACG SNPs with n – i chromosomes carrying ACG)
Calculate the probabilities of ancestral misidentification from equation (3) (e.g., and )
Plug the results from steps 1 and 2 into equations (5) and (6), and sum across all pairs of trinucleotides.
Simulations
To test the effect of a context-dependent mutation model with and without natural selection on our ability to compare closely related sequences, we simulated population genetic data with an outgroup. Our simulation program was written in the C programming language, and can be described as generating 2 Wright-Fisher populations with a known divergence time under a context-dependent mutation process across finitely many sites. The structure of the simulation is as follows: a single diploid population of constant size Ne is evolved for a large number of generations (≥ 8Ne) to mix and introduce variation, at which point there is a speciation event that splits the population into 2 independent populations of constant size Ne. After 2Neτ generations (the divergence time), a sample is taken from both populations. From these samples, several statistics are computed (e.g., Tajima's D, Fu and Li's D, Fay and Wu's H, etc. as described below).
Each simulated generation consisted of 3 main components: (i) random mating, whereby the chromosomes of each diploid individual were chosen from two individuals of the previous generation (with replacement) with probabilities given by their relative fitness (assuming fitnesses are multiplicative across sites), (ii) mutation, whereby a Poisson number of events occurred with mean θ/2 = 2Neμ (the population scaled mutation rate per sequence per generation), and (iii) recombination, whereby a Poisson number of events occurred with mean ρ/2 = 2Ner (the population scaled recombination rate per sequence per generation).
Recombination events were distributed uniformly across individuals and sites (i.e., no hot spots). Mutation events were distributed uniformly among all chromosomes in the population, but sites within chromosomes were chosen according to each site's “hit probability” (i.e., the site's mutation rate relative to the rest of the sequence). Because the mutation rate at a site is context-dependent, a mutation event at a flanking nucleotide can change a site's hit probability as well as the overall mutability of a sequence (though only nominally for sufficiently long sequences). After choosing a site to mutate, a new nucleotide was chosen according to the relative mutation rate from the current state into each of the other 3 states (conditional on the flanking nucleotides). If the chosen mutation event resulted in an amino acid change and a selective effect was desired, then the derived state was also assigned a fitness coefficient from a specified distribution (e.g., discrete, Gamma, Normal, or a more complicated mixture model). Should the mutation event result in the genesis of a stop codon, a different nucleotide was chosen for this site using the same probabilities as before. Although our algorithm for avoiding stop codons reduces the state space for some mutations, and slightly alters the resulting stationary trinucleotide frequencies, this does not induce a systematic bias in terms of polymorphism or divergence since a mutation is still introduced into the population.
In order to accommodate our assumption of statistical stationarity, we seeded our founding population with a single sequence drawn from the stationary distribution induced by the context-dependent mutation model. To obtain such a sequence, we first determined the stationary distribution of nucleotides for each context, π, which is the diagonal of . By construction, each nucleotide context has 4 entries in π whose values correspond to the probability of each nucleotide in the given context. We then initialized each site of a sequence to A, C, G, or T randomly, and then updated each site of the sequence by drawing a new nucleotide from π corresponding to the site's current nucleotide context. In order to avoid problems at the boundary of a sequence, we considered the sequence to be circular during the updating phase (i.e., the first and last site were considered to be neighbors). We continued to update the sequence until trinucleotide frequencies converged to stationarity. Convergence to stationarity was monitored using the statistic (Gelman et al. 2004). Convergence to for each of the 64 trinucleotide frequencies was ensured for 100 independent chains after 500 iterations (i.e., 500L nucleotide updates).
Unless otherwise noted, all simulation results discussed were obtained assuming 2 diploid populations with effective size of Ne = 250, where n = 50 chromosomes were sampled from 1 population and n = 2 chromosomes were sampled from the outgroup (both without replacement). In agreement with diffusion theory (Sawyer and Hartl 1992; Ewens 2004), neutral coalescent theory (Kingman 1982; Hudson 1990), and previous forward simulation studies (McVean and Charlesworth 2000; Williamson and Orive 2002), we found that the actual population size does not impact our results when the mutation rate, recombination rate, divergence time, and selection coefficients are scaled by the effective population size (tested using Ne = 250, 500, 1000, and 5000, results not shown).
Implementation of our forward simulation was done by storing a single consensus sequence for each population, and 2 Splay trees (efficient self-balancing binary search trees; Sleator and Tarjan 1985) for each individual. Each tree kept track of the mutations that an individual carried on a chromosome (including information regarding the generation in which they arose, whether or not they were synonymous, ancestral and derived codons, the states of the flanking nucleotides, the selective effect, as well as the true ancestral state). An individual inherited an entire tree from each parent, and the consensus sequence was updated after each fixation event, at which point the reference to that mutation was removed from the trees of each individual and stored in a separate Splay tree. Such a simulation allowed us to evaluate the effect of ancestral misidentification directly, since the true ancestral state of each SNP was known, and we had outgroup information.
In order to evaluate the effect of natural selection, we implemented 3 “shift models” of selection. In a shift model, the selection coefficient at a site returns to zero when a mutation fixes in the population (i.e., fitness is relative). In our simulations, the population genetic selection coefficient γ = 2Nes was drawn for each nonsynonymous mutation. The first selective scheme (γ1) is a Normal-shift model where γ1 ∼ N(0, 2). Normal-shift models are generally considered to represent positive selection, as a new mutation will increase the individual's fitness half of the time, and positively selected mutations are much more likely to be maintained/fixed in the population (Cutler 2000). The second selective scheme (γ2) refers to a gamma-shift model, where all nonsynonymous mutations are deleterious with γ2 ∼ – Γ(1, 0.25) (this is a model of negative selection, where Γ is the common gamma distribution with mean 4, but reflected across the y-axis). The third selection scheme (γ3) refers to a mixture of normals model with a point mass at zero, where most mutations are neutral (54.5% of nonsynonymous mutations have γ3 = 0) or strongly deleterious (45% of nonsynonymous mutations have γ3 ∼ N(– 10, 5)), but a small fraction are strongly advantageous (0.5% of nonsynonymous mutations have γ3 ∼ N(50, 5)). Note that in each of these models, synonymous sites are completely neutral (i.e., γsyn = 0).
In order to contrast our simulations under the context-dependent mutation model with a nucleotide mutation model having no context effects, we simulated evolution under a generalized Kimura 2-parameter model (Kimura 1980). In this model, each nucleotide has its own transition and transversion mutation rates, but there were no context effects such as the hypermutability of CpG dinucleotides. The parameters of this model were estimated by Zhang and Gerstein (2003) from 1,726 human ribosomal protein pseudogenes.
We verified the neutral component of our simulation study by comparing the number of segregating sites, fixed differences, and the SFS to those generated under the coalescent simulation program ms (Hudson 2002). In supplemental table S1, we show that the distribution of the observed number of segregating sites and fixed differences (with short divergence times) in our simulation matched the expected distribution very closely. However, as the divergence time increases, the number of unobserved substitutions grows substantially. Because we store information regarding all mutations during the simulation, we can see that the total number of substitutions that occurred matches the number we expect to see very closely, but due to multiple substitutions per site, the observed number of fixed differences is much less than expected.
Simulations for Poisson Random Field Analysis
A statistical test for positive selection using the SFS under the Poisson random field (PRF) framework of Sawyer and Hartl (1992) was recently proposed (Nielsen et al. 2005a). This test assumes that each nonlethal mutation enters the population and is assigned to one of 3 categories: neutral (with population scaled selection coefficient γ = 2Nes = 0), positively selected (with selection coefficient γ+ > 0), or negatively selected (with selection coefficient γ– < 0) with probabilities p0, p+, and p– (respectively). A likelihood ratio test (LRT) for positive selection is then performed by constraining the probability that a new mutation is advantageous to be zero under the null hypothesis (i.e., H0: p+ = 0 versus H1: p+ ≠ 0).
To evaluate the robustness of this test for positive selection to ancestral misidentification, we simulated 1,000 datasets consisting of 200 independent loci with no intragenic recombination, each of length 1 kb with θ per site = 0.0043 (similar to the value inferred by Williamson et al. 2005), and an outgroup with population scaled divergence time of τ = 10. For each pooled set of 200 loci, we sampled 50 sequences from one population and 2 sequences from the other, then constructed three SFS: the true SFS (using ancestral information stored during the simulation), the observed SFS (based on polarizing each SNP with homozygous sites in the outgroup sequence), and the corrected SFS based on applying our correction (equation (7)) to the observed data. The LRT was then performed for each of the 3 SFS for all 1,000 datasets.
Results
The Effect of Ancestral Misidentification
Using forward simulations with a context-dependent mutation process, we compared the effect of ancestral misidentification on the SFS under neutrality to the effect of recurrent positive selection. Figure 2 shows that while the expected frequency distribution of neutral mutations (solid black line) differs from the frequency distribution of mutations with recurrent positive selection (solid gray line), ancestral misidentification can cause the frequency distribution of neutral mutations (dashed black line) to look substantially like positive selection. This qualitative similarity suggests that complex mutation patterns across sequences of finite length can compromise statistical tests of the standard neutral model, even when comparing species as closely related as human and chimpanzee.
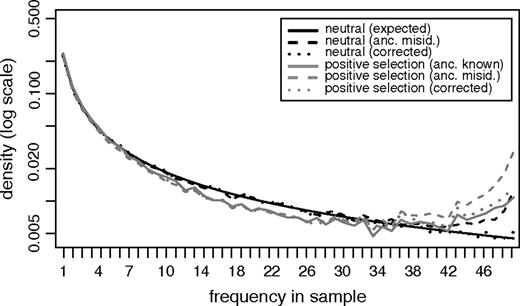
Simulation results showing the effect of ancestral misidentification on the SFS with and without rampant positive selection (gray and black, respectively) when using an outgroup as diverged as human-chimpanzee. Solid lines show the SFS when the ancestry for each SNP is known, dashed lines show the SFS when the ancestry for each SNP is inferred from the outgroup, and dotted lines show the result of correcting the observed data for ancestral misidentification. Each curve shows the average over 5,000 simulations, with an average population scaled mutation rate θ= 0.0043 per site across sequences of length 1kb. In the case of positive selection all synonymous mutations are neutral (γ= 2Nes= 0) and all nonsynonymous mutations are positively selected (γ= 5).
Some of the most common methods for identifying departures from the standard neutral model (SNM) are based on comparing summary statistics of the SFS (Tajima 1989; Fu and Li 1993; Fay and Wu 2000). Among the most common summaries are those that use the SFS to estimate the population scaled mutation rate, θ. One of the first estimates of θ was proposed by Watterson (1975), and uses the total number of segregating sites (θW). Another common estimate is based on the average pairwise heterozygosity (θπ; Tajima (1983)). Under the assumptions of the SNM, these 2 estimates of θ are unbiased; however, departures from the SNM will affect these 2 estimates differently. Tajima (1989) capitalized on this characteristic and proposed a statistical test for the equality of θW and θπ, and defined the test statistic D. However, since neither θW nor θπ require ancestral information (i.e., both can be written as a function of the folded SFS), ancestral misidentification has no effect on Tajima's D. Indeed, the distribution of the D statistic for 5,000 forward simulations with ancestral misidentification significantly overlaps the distribution of D from 20,000 coalescent simulations for a range of parameters (MWU (Mann-Whitney U test) P = 0.35, 0.24, 0.39 for θ = 2.15, 4.3, 10.75, respectively).
The second test statistic we considered was the statistic proposed by Fu and Li (1993) that uses outgroup information (denoted here as Dfl). The motivation for this test was based on the notion that purifying selection or a recent selective sweep would lead to a relative excess of young/rare mutations in the population, while balancing selection would lead to a relative deficiency. To capture this effect, Dfl statistically tests for the equality of θW and θ1 (the estimate of θ based on the number of mutations that are carried by only a single chromosome in the sample). However, one of the effects of ancestral misidentification is that some rare mutations are mislabeled as being at high frequency. This causes Fu and Li's test to reject the SNM more frequently than expected at the 5% level due to a deficiency of rare mutants (i.e., an excess of observations greater than the 95% critical value, shown in fig. 3a), especially when divergence times are long.
The third test statistic that we consider is Fay and Wu's H (Fay and Wu 2000). This test was motivated by the desire to identify regions that may have been the target of a recent selective sweep. One characteristic of a selective sweep in a recombining locus is that some neutral alleles will have hitchhiked to very high frequency in the population. To identify regions with an overrepresentation of high frequency mutants, H statistically tests for the equality of θπ and θH (the estimate of θ based on the homozygosity of derived mutations; Fu 1995). However, one of the primary effects of ancestral misidentification is to increase the inferred proportion of derived mutations at very high frequency. As with the test of Fu and Li, ancestral misidentification can cause the H statistic to reject the SNM more often than expected at the 5% level (but due to an excess of large negative values that are below the 5% critical value, shown in fig. 3b and Baudry and Depaulis (2003)), especially when divergence times are long. Figure 3b also shows that ancestral misidentification has a larger impact on H in the presence of high recombination. This unintuitive result can be explained by supplemental figure S1, which shows that while the mean value of H does not differ between R = 0 and R = 25, the variance of H is much larger in the absence of recombination (indicated by comparing the 0.05 critical values). Supplemental figure S1c shows the affect of ancestral misidentification on H by plotting the value of H when all ancestral states are inferred from the outgroup minus the value of H when all ancestral states are known. These distributions overlap considerably (MWU P = 0.167), indicating that the effect of ancestral misidentification on H is independent of the recombination rate.
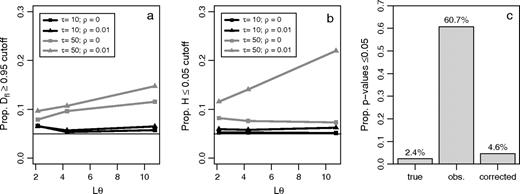
The effect of ancestral misidentification on statistical tests of the standard neutral model (SNM). The proportion of simulations resulting in (a) a Fu and Li (1993),Dstatistic (denoted Dfl) greater than the 0.95 critical value, (b) a Fay and Wu (2000)H statistic below the 0.05 critical value, and (c) a PRF-test for positive selection rejecting neutrality at the 5% level for the true, observed, and corrected data. For (a–b), the horizontal axis represents the average mutation rate across the simulated sequences with τ the population scaled divergence time and ρ the average per site recombination rate, and critical values determined using 20,000 coalescent simulations.
Correcting the SFS
To account for ancestral misidentification in the presence of context-dependent mutation rate variation, we model each component of the SFS as a mixture of SNPs whose ancestral states were correctly identified and SNPs whose ancestral states were misidentified (2 unknown quantities; see Materials and Methods). In our model, the mixture components account for variation in substitution probabilities, stationary frequencies, and relative rates of mutation for each type of polymorphism in a given nucleotide context. The resulting model is a linear system of equations with unknown quantities that can readily be solved to reconstitute the true SFS.
Figure 2 shows examples of simulated SFS with and without positive natural selection (in gray and black, respectively). The solid lines show the SFS when the ancestral state is known (or the expected SFS in the case of neutrality; Watterson 1975; Fu 1995). The dashed lines show the SFS when the ancestral state of each SNP is identified using an outgroup with divergence similar to human and chimpanzee. The dotted lines show the SFS after correcting for ancestral misidentification. If the correction were perfect, then the dotted lines would be directly on top of the solid lines. This is nearly the case for our neutral simulations, but a slight deviation remains in the case of positive selection. However, this result is promising, given that our correction does not explicitly model the effect of natural selection.
For a range of mutation, selection, and divergence parameters, 5,000 polymorphism datasets were simulated with an outgroup. In each dataset, the ancestral state of each SNP was identified using the outgroup, and the average proportion of SNPs whose ancestral states were misidentified was calculated (fig. 4). We then applied our correction to the observed data using both the observed divergence and the true divergence (measured in terms of the average number of substitutions per site), and calculated the number of SNPs whose ancestral states were still misidentified (fig. 4). Though our correction can eliminate a majority of the ancestral misidentification events for all the parameters tested (with and without selection), underestimating the level of divergence can have a strong impact (particularly for highly diverged outgroups). In our simulations of selection (fig. 2 and 4c and d), our correction tends to underestimate the effect of ancestral misidentification. This is primarily because selection provides an unaccounted for source of variance in the substitution probabilities across sites.
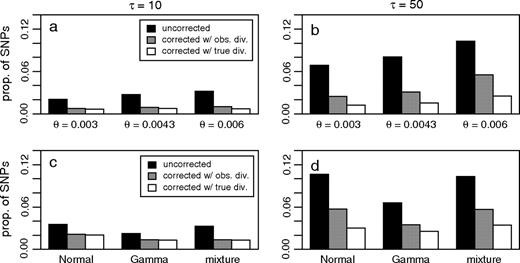
Simulation results showing the proportion of SNPs whose ancestral states have been misidentified for each value of the average population scaled mutation rate per site θ (a–b) or selection scheme (c–d). Each bar represents the average over 5,000 simulations. “Uncorrected” refers to inferring the ancestral state of each SNP using an outgroup sequence with population scaled divergence time τ = 10 (a and c, representing human–chimpanzee divergence) or τ = 50 (b and d, representing human–macaque divergence), and “corrected” refers to the data after performing our proposed correction with either the observed number of substitutions per site or the true number of substitutions per site (as determined by saving information during the simulation). Simulations with selection (c–d) were performed with θ = 0.0043 per site and no intergenic recombination.
We determined the extent to which ancestral misidentification can produce statistical evidence for positive selection using a recently proposed statistical test based on the Poisson random field (Nielsen et al. 2005a). This test assumes that each nonlethal mutation enters the population and is assigned to one of three categories: neutral, positively selected, or negatively selected with probabilities p0, p+, and p– (respectively). We found that the LRT based on the PRF framework is not robust to ancestral misidentification, but the false-positive rate can be controlled by correcting for ancestral misidentification. As shown in figure 3c, the LRT for the true SFS (based on saving the ancestral state of each polymorphism during the simulation) was conservative at the 5% level, rejecting H0 only 2.4% of the time. Applying the LRT to the uncorrected (observed) SFS resulted in rejecting H0 60.7% of the time at the 5% critical value. After performing the correction proposed in equation (7) using the observed divergence, the LRT rejected H0 4.6% of the time at the 5% critical value.
An alternative approach to dealing with ancestral misidentification might be to restrict the analysis to the subset of SNPs that have outgroup support from multiple species (e.g., the SNPs that have an allele matching both chimpanzee and rhesus macaque). To evaluate this strategy, we used a non-coding data set from the African-American population (described in our concurrent article Hernandez et al. 2007). Orthologous regions were identified in both chimpanzee and macaque using BLAT (Kent 2002). As shown in figure 5, using macaque as an outgroup to identify the ancestral states of human SNPs would lead to a very large excess of high frequency derived mutations (a result of ∼ 6% divergence over 25 million years). Using chimpanzee alone results in a lower proportion of high frequency derived mutations, but still an excess. Requiring the chimpanzee allele to match the macaque allele at each human SNP reduces the proportion of high-frequency derived mutations further, but there is still a slight excess. The excess high frequency tail completely vanishes when we apply the correction proposed above. It is also important to note that while the ancestral state of 10,179 SNPs could be identified using the chimpanzee, requiring the chimpanzee to equal the macaque results in just 7,082 SNPs (a reduction of 30%). However, by using the correction proposed in this paper when inferring ancestral states using chimpanzee, only 404 SNPs (3.96%) must be removed from the analysis (due to violations of the constant-context assumption).
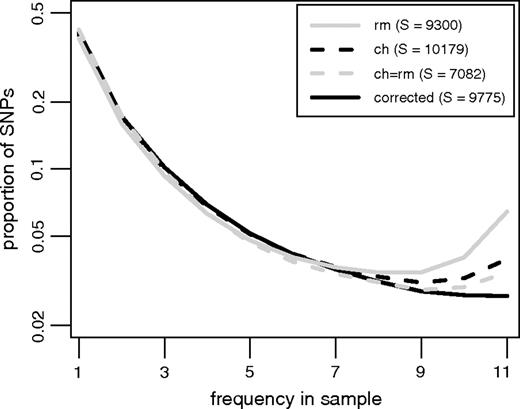
The SFS using 4 strategies to identify the ancestral states of each SNP. The solid gray (dashed black) line shows the result of using the rhesus macaque (chimpanzee) genome, the dashed gray line shows the subset of SNPs that have an allele matching both chimpanzee and rhesus macaque (ch = rm), and the solid black line shows the result of applying our correction to the observed data using only the chimpanzee outgroup. The legend indicates the resulting number of SNPs (S) for each strategy.
To see the effect that the various strategies for identifying ancestral states of SNPs would have on population genetic analyses, we asked whether the SFS produced from each strategy could be explained by a simple demographic history with no selection. We used the method developed by Williamson et al. (2005), which fits a 2-epoch demographic model to the SFS in the absence of selection. The model assumes that at some time τ in the past (scaled in terms of the current effective population size), the effective population size instantaneously changed from NA to NC (i.e., from the ancestral to the current population size, with ω = NA/NC the magnitude of the change). We then performed a goodness-of-fit test, to see whether the inferred demographic model could sufficiently explain the data. Using the chimpanzee alone, we inferred τ = 0.11 and ω = 0.49 (that is, there was a 2-fold population size increase). However, this simple demographic model cannot fully explain the data (as suggested by a goodness-of-fit P = 1.1 × 10⁻¹⁶, with twice the difference in log-likelihods Λ = 92.9 on 8 degrees of freedom). Using both outgroups, we infer a slightly older and stronger demographic event, with τ = 0.14 and ω = 0.42. However, a goodness-of-fit test still rejects this model as a sufficient explanation for the data (P = 2.6×10⁻⁸, with Λ = 51.0). When we apply our correction to the data using chimpanzee as the only outgroup, we find the demographic event was older than either of the other methods, and intermediate in strength, with τ = 0.19 and ω = 0.47. Importantly, a goodness-of-fit test on this data cannot reject the simple 2-epoch demographic model (P = 0.35, with Λ = 8.9).
Discussion
Ancestral misidentification of a SNP occurs when the ancestral state is not the allele observed at the orthologous site in the outgroup. Because most derived mutations tend to be rare (Watterson 1975; Fu 1995), ancestral misidentification most often leads to mislabeling low frequency derived mutations as very high frequency ones when constructing the site-frequency spectrum (SFS) using an outgroup. This results in an increase in the proportion of SNPs found at very high frequency, a pattern similar to positive selection. We have shown that ancestral misidentification causes many statistical tests to reject selective neutrality more frequently than expected.
Ignoring outgroup information and using the frequency distribution of minor alleles (the folded SFS) leads to a lack of power for some statistical tests (Bustamante et al. 2001). Moreover, the inclusion of another outgroup that is more diverged seems to cause a large fraction of the data (30%) to be removed while not significantly reducing the problem. We therefore propose a correction for the effect of ancestral misidentification on the SFS that takes advantage of our growing knowledge regarding the underlying neutral mutation process. The novelty of this method is in our use of a finite sites model for between species divergence, while maintaining an infinite sites model for within species polymorphism in the context of a realistic mutational process. Our technique is independent of population demography and ambivalent regarding the presence/absence of natural selection. Though it has long been suggested that frequency information is informative about the ancestral state of a polymorphism (Watterson and Guess 1977; Griffiths and Tavaré 1998), we have modeled ancestral misidentification strictly as a function of the mutational process for the sake of being robust to unknown demographic histories, and to make inference regarding natural selection (or the distribution thereof) more conservative.
Our analysis shows that ancestral misidentification occurs frequently between human and chimpanzee, and we argue that this is primarily due to the fact that neutral mutation rates can vary both across sites as well as over time. An effect of ancestral misidentification could also be caused by sequencing errors in the outgroup. However, if this were the sole cause of the observed excess high frequency derived SNPs, then we would not expect to see a more dramatic effect when ancestral states were determined using rhesus instead of chimpanzee (fig. 5). Moreover, it may be the case that no species pair exists such that one can reliably polarize polymorphism data. For species more closely related than human and chimpanzee, further complications may arise due to lineage sorting and shared polymorphisms. It is therefore necessary to consider probabilistic models that can account for ancestral misidentification. However, our approach makes several simplifying assumptions that may be violated in some situations. For example, we assume that the flanking nucleotides of each polymorphism are constant between species, which may not always be the case. Using the polymorphism dataset consisting of 11,626 genes from 39 humans and a chimpanzee presented in Bustamante et al. (2005), we estimated that roughly 2.6% of SNPs in the coding regions of the human genome violate this constant context assumption (1.2% due to adjacent fixed differences and 1.4% due to adjacent SNPs). In the current non-coding dataset, 5.1% of SNPs were in violation of the constant context assumption (1.9% due to adjacent fixed differences and 3.2% due to adjacent polymorphisms). However, the inclusion and exclusion of polymorphic sites in violation of the constant context assumption has no effect on the qualitative results presented here.
The model presented here also assumes that all SNPs are independent, an assumption that is clearly not true for many SNPs occurring within the same gene. However, the effect of this assumption is minimized when pooling SNPs from across the genome. Moreover, because mutation rates and patterns are not necessarily constant across different regions of the genome (e.g., it is unknown whether different isochores are following different mutational patterns), it is of interest to develop new techniques that will allow us to estimate context-dependent effects and account for ancestral misidentification on a local scale.
The effect we have observed will likely hold for any species pair in which there is sufficient mutation rate variation. In mammals, context-dependence contributes significantly to the amount of mutation rate variation. However, in some species, such as Drosophila, context-dependence has not been found (Andolfatto 2005). In these species, other sources of mutation rate variation must be accounted for.
Though the context-dependent mutation pattern we have conditioned on may not be constant across all sequences, and though there may be other sources of mutation rate variation in addition to context-dependence, our analysis and simulations suggest a consistent pattern: without taking ancestral misidentification into account during the analysis of human polymorphism data, spurious signs of positive selection will be observed.
Abbreviations
- likelihood ratio test
LRT
- Poisson random field
PRF
- single nucleotide polymorphism
SNP
- site-frequency spectrum
SFS
- standard neutral model
SNM
We are grateful to Jaroslaw Pillardy for computational assistance, Dara G. Torgerson for helpful comments, and Rasmus Nielsen for insightful suggestions. This work was funded by a National Science Foundation grant (0516310) to CDB.
References
Author notes
John H. McDonald, Associate Editor
