


Abstract
The nature of heterotachy at the center of recent controversy over the relative performance of tree-building methods is different from the form of heterotachy that has been inferred in empirical studies. The latter have suggested that proportions of variable sites (pvar) vary among orthologues and among paralogues. However, the strength of this inference, describing what may be one of the most important evolutionary properties of sequence data, has remained weak. Consequently, other models of sequence evolution have been proposed to explain some long-branch attraction (LBA) problems that could be attributed to differences in pvar. For an empirical case with plastid and eubacterial RNA polymerase sequences, we confirm using capture-recapture estimates and simulations that pvar can differ among orthologues in anciently diverged evolutionary lineages. We find that parsimony and a least squares distance method that implements an overly simple model of sequence evolution are susceptible to LBA induced by this form of heterotachy. Although homogeneous maximum likelihood inference was found to be robust to model misspecification in our specific example, we caution against assuming that it will always be so.
Introduction
The “ongoing debate concerning model-based phylogenetics” has come sharply into focus recently, with discussion over computer simulations that have been suggested to model the evolutionary properties of sequences more realistically (Kolaczkowski and Thornton 2004; Spencer, Susko, and Roger 2005; Steel 2005; Thornton and Kolaczkowski 2005). These properties of sequences are well known to include evolving distributions of variable sites (e.g., Fitch and Markowitz 1970; Lockhart et al. 2000; Philippe and Lopez 2001; Ané et al. 2005). Less clear has been whether or not sequence evolution involves lineage-specific changes in proportions of variable sites (pvar; e.g., Lockhart et al. 1996, 1998; Philippe and Germot 2000; Steel, Huson, and Lockhart 2000; Lockhart and Steel 2005). If pvar is not constant across evolutionary lineages, then neither the discrete gamma distribution (Yang 1997) nor the standard covarion model (Fitch and Markowitz 1970; Tuffley and Steel 1998; Galtier 2001; Penny et al. 2001; Huelsenbeck 2002; Ané et al. 2005; Spencer, Susko, and Roger 2005) may be a sufficient description of sequence evolution for some cases of phylogenetic inference.
The concept of “heterotachy” at the center of recent controversy (Kolaczkowski and Thornton 2004; Spencer, Susko, and Roger 2005; Steel 2005; Thornton and Kolaczkowski 2005) is empirically based. The term has been derived to account for the possibility that pvar may change in different evolutionary lineages (Philippe and Germot 2000; Philippe and Lopez 2001, Lockhart and Steel 2005). However, changing pvar is only one specific case of heterotachy, and it is not the form of heterotachy that has been modeled in recent simulations (Kolaczkowski and Thornton 2004; Spencer, Susko, and Roger 2005). Strictly speaking, heterotachy describes the inference, made for a particular site in a multiple sequence alignment, that there are lineage-specific differences in evolutionary rate (Lopez, Casane, and Philippe 2002). Thus, it is a site property for which lineage-specific differences could in principle arise under “two very different processes” of sequence evolution (Lockhart and Steel 2005). Heterotachy might arise under the scenario first studied by Felsenstein (1978) and elaborated upon in recent simulations (Kolaczkowski and Thornton 2004; Spencer, Susko, and Roger 2005) or because there is a change in pvar among homologues. The latter form of heterotachy is expected to be problematic for “all methods” of tree building because it will induce long-branch attraction (LBA) effects similar to, but distinct from, the form of LBA originally described by Felsenstein (1978) and Lockhart and Steel (2005).
Despite inferences of changing pvar having motivated the concept of heterotachy and despite numerous observations supporting its occurrence, unambiguous evidence that pvar differs among orthologues has been lacking. This lack of evidence is presumably why other explanations, such as “parallel across-site rate variation” (e.g., Inagaki et al. 2004; Susko, Inagaki, and Roger 2004), have been proposed as an explanation for some LBA problems, when these problems could more simply be explained by differences in pvar among orthologues.
Here, we report an empirical study of pvar in plastid and eubacterial orthologues, in which the taxonomic sampling and nature of phylogenetic relationships allow us to draw stronger conclusions about the nature of heterotachy in real sequences. Our example describes a case of phylogenetic incongruence, first noted by Martin et al. (1998), and concerns differences between gene trees reconstructed from RNA polymerase (Rpo) subunits versus other plastid gene loci. We demonstrate that this incongruence is a consequence of increased pvar in the green algal lineage. We discuss the implication of our findings for future analytical studies that investigate the relative performance of tree-building methods.
Materials and Methods
The Data
Data sets were assembled for these analyses using previously published sequences (http://www.ncbi.nlm.nih.gov and http://www.kazusa.or.jp/cyano/cyano.html) for RpoB, RpoC1, RpoC2, TufA, AtpA, and AtpB, sampling the same four accessions from each of the following four groups: (1) green algae; (2) red algae; (3) cyanobacteria; and (4) nonphotosynthetic (non-PS) bacteria (in which RpoC corresponds to RpoC1 + C2). Phylogenetic inferences from similar data sets form a basis for current understanding of the evolutionary relationships of plastids (Palmer and Delwiche 1998). Individual taxa and accession numbers are given in Appendix 1, provided online as Supplementary Material. Protein sequences were aligned using DIALIGN (Morgenstern 1999). RpoC1 and RpoC2 were aligned as concatenated sequences to RpoC in non-PS prokaryotes. Because misalignment could adversely affect the conclusions of the present study, only unambiguously aligned block regions without gaps that were bounded by conserved residues were used for tree-building analyses and subsequent estimates of parameters.
Individual Gene Trees and Estimates of pvar
Estimates of pvar were made on four-taxon data sets for each of the individual proteins (RpoC1C2, RpoB, TufA, AtpA, AtpB), using the capture-recapture method of Steel, Huson, and Lockhart (2000) implemented in SplitsTree3.2. (Huson 1998; http://www-ab.informatik.uni-tuebingen.de/software/welcome.html). For example, with RpoC1C2 sequences, estimates of pvar were made on four cyanobacteria, on four red algae, on four green algae, and on four outgroup taxa. For each of these four-taxon data sets, protein maximum likelihood trees were reconstructed using ProML from the PHYLIP software package (Felsenstein 2004) assuming (1) a Jones, Taylor and Thornton (JTT) model with no correction for across-site rate variation and (2) a JTT-gamma model with the optimal alpha shape parameter estimated using PAML3.14 (Yang 1997). The sum of the individual branch lengths in each of these four-taxon trees was plotted against the pvar value for the corresponding quartet, and correlation coefficients were calculated using S-Plus 4.5 (Mathsoft 1999).
Concatenated Data Sets, Gene Trees, and Estimates of pvar
Analyses of concatenated data sets were used to draw inferences about the relative performance of commonly used tree-building methods. Two data sets were created using the same 16 taxa, by concatenating genes that had supported two different topologies in earlier analyses (e.g., Martin et al. 1998). We concatenated TufA, AtpA, and AtpB sequences (1,037 sites: the “TAB” data set) and concatenated the RpoB and RpoC1 + C2 subunits (1,133 sites: the “Rpo” data set). For both data sets, heuristic parsimony estimates of phylogeny (unweighted, unordered, with Tree Bisection-Reconnection branch swapping), including nonparametric bootstrapping (100 replicates), were made using PAUP*4.0 (Swofford 2003). Ordinary least squares (with p distances or a JTT substitution model) and maximum likelihood reconstructions (which assumed a JTT model), including nonparametric bootstrapping (100 replicates), were made using PHYLIP3.6 (Felsenstein 2004). Where across-site rate variation was assumed in distance and maximum likelihood reconstructions, we used the optimal alpha shape parameter estimates for within-lineage comparisons (i.e., the values estimated using PAML3.14 for either the cyanobacterial or green chloroplast groups).
To help interpret the evolutionary properties of the concatenated data, we made estimates of pvar for each taxon group and studied their apparent differences in simulations using Seq-gen V1.3 (Rambaut and Grassly 1997; http://evolve.zoo.ox.ac.uk/software.html?id=seqgen). In these simulations, protein sequences were simulated with a specified pvar along a four-taxon tree. Estimates of pvar were then made on the simulated data and compared to the original specified value. The aim of the simulations was to see whether or not sampling variability and estimation bias could explain the apparent difference in pvar estimates among orthologues in different taxon groups. Particular concerns were whether or not (1) the capture-recapture estimator was valid for nongroup-based substitution models (Steel, Huson, and Lockhart 2000) and (2) whether or not underlying tree shape might bias estimates of pvar. Thus, sequences the length of the concatenated TAB data set were simulated under a JTT + I model, assuming the empirical green algal pvar value and a four-taxon tree with branch lengths equivalent to that of the optimal ProML four-taxon cyanobacterial tree. Sequences the length of the concatenated Rpo data set were also simulated under a JTT + I model, assuming the empirical cyanobacterial pvar value and a tree with branch lengths equivalent to those of the optimal ProML green algal tree obtained with the Rpo data set. pvar estimates on the simulated data were made using the capture-recapture method implemented with a Perl script written by J. Riden, and the values were plotted as a histogram against pvar values obtained on real data for each taxon set. In plotting our results, rather than report the empirically derived point estimates of pvar, we have reported pvar estimates made on bootstrap samples for each taxon group. To obtain these, we used seqboot, from the PHYLIP3.6 (Felsenstein 2004) software package, together with our Perl script, to obtain estimates for 100 pseudoreplicates.
Mapping Insertions and Deletions and Nonconservative Substitutions to Specific Lineages
Using the DIALIGN alignments initially produced for each of the protein data sets, insertions and deletions (indels) were mapped to ingroup evolutionary lineages (cyanobacteria, red algae, green algae) based on their unique occurrence in each of these groups (the alignment has been provided in Appendix 2 of the online Supplementary Material).
Using the concatenated Rpo and TAB data sets, we also recorded when substituted amino acids in specific lineages differed in their physico-chemical properties from those at the same sites in other ingroup and outgroup taxa. For this purpose, ClustalX was used to identify when substitutions occurred outside classes that are strongly conserved in Gonnet mutability matrices (STA, NEQK, NHQK, NDEQ, QHRK, MILV, MILF, HY, FYW).
Results
A Relationship Between pvar and Branch Length
Figure 1 shows the four-taxon trees obtained with ProML for each of the four evolutionary lineages and five protein data sets. Of particular interest is the observation that the extent of phylogenetic divergence within each of these lineages is not similarly proportional across proteins. With the Rpo subunits, branch lengths in the green algal trees are relatively long and in the cyanobacterial trees, branch lengths are relatively short. In contrast, with the AtpA, AtpB, and TufA data sets, branch lengths in the green algal trees are relatively short while in the cyanobacterial trees, branch lengths are relatively long. Figure 2 shows the summed branch lengths for each tree plotted against its corresponding capture-recapture pvar estimate. Correlation coefficients were calculated for all pairwise comparisons of proteins. Correlation coefficients for all pairwise comparisons were highly significant, a finding only possible if there is independence or weak dependence due to common phylogenetic signal between Rpo and non-Rpo proteins. Further, correlations were always significant irrespective of whether or not the substitution model (JTT model) included a correction for positional rate heterogeneity and also when branch lengths were estimated using a least squares distance criterion rather than a maximum likelihood criterion (results not shown). Higher pvar estimates were correlated with four-taxon trees having longer branches, while lower pvar estimates were correlated with the four-taxon trees having shorter branches.
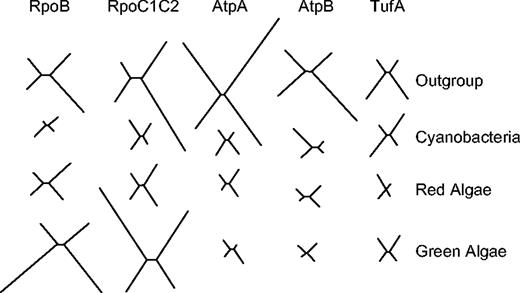
Optimal four-taxon trees reconstructed using ProML and PAML for each of the evolutionary lineages: outgroups, cyanobacteria, red algae, and green algae. Relative branch lengths in trees reconstructed for the different genes and taxa sets are indicated.
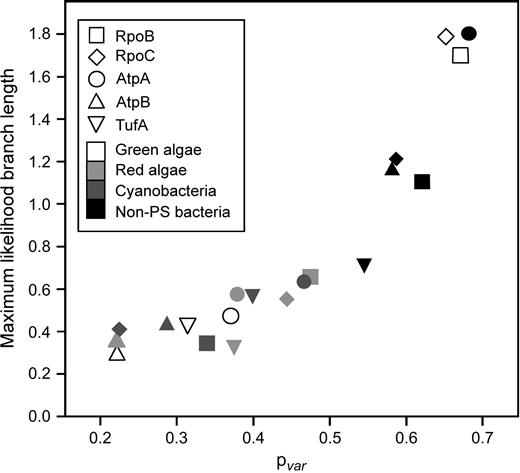
Plot for each of the trees shown in figure 1 of summed branch lengths and estimated pvar. Correlation coefficients were calculated (eight data points in each comparison) for all pairwise combinations of genes (e.g., for RpoB + AtpA: the pvar values associated with the trees shown in columns 1 and 3 of figure 1 were compared with the summed branch length values of these same trees); values were all signficant at P = 0.05 and ranged between 0.74 and 0.94.
Estimation Bias Does Not Explain Apparent Differences in pvar
Cyanobacterial sequences gave a similar, although somewhat elevated, pvar estimate from the TAB data set in comparison to that of green algae. In contrast, the green algal estimate of pvar in the concatenated Rpo data set was much higher than the cyanobacterial estimate (fig. 3b). The distributions of the simulated pvar values (shown as histograms) are very narrow and centered close to the values specified for the simulations. Thus, we conclude that the relationship between summed branch lengths and pvar values shown in figure 2 cannot be explained by estimation bias or sampling variation.
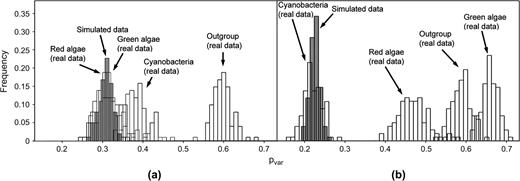
Capture-recapture estimates of pvar in (a) concatenated TufA, AtpA, and AtpB (TAB) sequences and (b) concatenated RpoB and RpoC1 + C2 (RpO) sequences. The open histograms indicate estimates of pvar on 100 bootstrap samples made for each taxon group with the concatenated data sets. The shaded histograms indicate pvar values for 100 data sets that were simulated with Seq-gen assuming a JTT + invariable sites model.
Indels and Nonconservative Substitution Patterns
The Rpo data set contains a much greater proportion of indels than the TAB data set, and most of the Rpo indels map to the green lineage (Supplementary Material online: Appendix 2). Further, within unambiguously aligned regions, there is a dramatic increase in nonconservative substitutions within the green algal Rpo lineage. That is, there are six, eight, and nine nonconservative substitutions, respectively, on the green algal, cyanobacterial, and red algal lineages in the TAB data set. In contrast, there are 107, 4, and 11 nonconservative substitutions on the green algal, cyanobacterial, and red algal lineages in the Rpo data set.
Heterotachy and Tree Building
Nonparametric bootstrap support for a split that separates the red and green algae from cyanobacteria and non-PS bacteria (fig. 4a) varied depending on the tree-building method used, as well as assumptions made concerning the substitution model. In reconstructions from the TAB data set, bootstrap support under heuristic ProML was 93% for the JTT model, 99% for the JTT + Γ; under ordinary least squares it was 94% with p distances, 99% with JTT, 99% with JTT + Γ, and 85% with parsimony. With the Rpo data set, heuristic ProML weakly favored this same tree, irrespective of whether or not a correction was made for positional rate heterogeneity (70% for the JTT model, 66% for the JTT + Γ). In contrast, the optimal parsimony reconstruction failed to recover this tree and instead weakly favored placing the long-branched green algae as adjacent to the outgroups (4b; 53% bootstrap support). Ordinary least squares provided the most support for the reconstruction shown in figure 4b. Greatest support for this reconstruction was obtained with the simplest substitution models (p distances: 100%; JTT: 66%). Implementing ordinary least squares with the most complex substitution model gave marginal support for the tree shown in figure 4a (47% or 66% for the JTT + Γ).
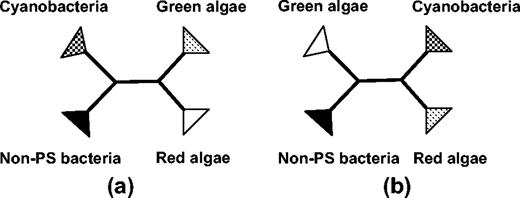
Alternative unweighted tree reconstructions favored by different methods: (a) green algae and red algae are adjacent and (b) green algae and outgroups are adjacent.
Discussion
Lineage-Specific Differences in pvar Among Rpo Orthologues
The branch lengths in trees reconstructed from anciently diverged eubacterial and plastid orthologues are correlated with estimates of pvar. Such correlations would be uninteresting if they could be explained by an underlying pattern of phylogeny that was common to all protein data sets. However, the correlations observed for comparisons involving Rpo subunits with other proteins indicate that this is not the case. Further, weak (or not) phylogenetic dependence is anticipated given the nature of our empirical example (i.e., because the lineages are anciently diverged).
Shorter branches in the four-taxon ProML trees (for both individual protein and concatenated data sets) are associated with relatively lower estimates for pvar, while longer branches are associated with relatively higher values (fig. 2). A point of note is that while the capture-recapture method of Steel et al. (2000) is appropriate for all group-based substitution models (e.g., such as the Kimura 3ST model), this does not include the JTT substitution model assumed in our analyses. Thus, the similarity of the distributions for simulated and corresponding empirical estimates shown in figure 3 is important for confirming the accuracy of our estimator. While the capture-recapture estimator does exhibit an estimation bias with certain underlying tree shapes when assuming a reversible and simple substitution process (Lockhart and Milligan, unpublished data), the simulation results also indicate that estimation bias cannot explain our empirical findings of between-group differences in pvar (fig. 3).
In general, interpretation of pvar estimates does need to be made cautiously because the capture-recapture estimator of Steel, Huson, and Lockhart (2000) assumes no covarion patterns of change among the sequences upon which the estimate is made. If there is covarion change within and between groups (i.e., without pvar changing), then it is possible that different estimates of pvar could be returned for different groups in cases where there were also unequal amounts of evolutionary change within these groups (Lockhart and Steel 2005). This might be the situation if one group was older than another or if the orthologues were evolving faster in one group than in another. However, for the specific plastid example that we study, it is unlikely that the observed differences in pvar are an artifact of phylogenetic divergence because additional observations also indicate lineage-specific differences in the evolutionary constraints of Rpo subunits.
The most significant of these observations is that the distribution of indels and nonconservative substitutions is significantly skewed among phylogenetic groups, with a much greater relative proportion of both indels and nonconservative substitutions mapping to the green lineage in Rpo sequences (Appendix 2). This observation is consistent with the relaxation of structural constraints within the green evolutionary lineage of Rpo proteins, and it is interesting to note that this apparent asymmetric nature of sequence evolution is not unique to our example. Lineage-specific changes in the structural/functional constraints of orthologues have been suggested previously by numerous authors (e.g., Simon et al. 1996; Horner and Embley 2001; Lopez, Casane, and Philippe 2002; Misof et al. 2002; Inagaki et al. 2004; Brown 2005). Of particular note is the observation that sequences from organisms with reduced genomes often exhibit higher “rates of evolution,” where there may also have been relaxation of structural constraints (e.g., Inagaki et al. 2004). Although certain patterns of lineage-specific patterns of substitution (Felsenstein 1978) and across-site rate variation (e.g., Susko, Inagaki, and Roger 2004) can explain some LBA problems in tree building, differences in pvar among orthologues provide an alternative explanation (Lockhart and Steel 2005). Currently there is much interest in the impact of transient and obligate protein-protein interactions on relative rates of protein evolution (e.g., Guo and Stiller 2005; Mintseris and Weng 2005). Understanding the coevolution of such interactions will be important for understanding variation in pvar values among orthologues in different evolutionary lineages.
Heterotachy and Tree Building
Although empirical studies have helped form the concept of heterotachy (e.g., Lockhart et al. 1996; Philippe and Germot 2000; Philippe and Lopez 2001), the parameter space suggested from these earlier studies and confirmed in the case study we report here was not investigated in recent simulations of heterotachy (Kolaczkowski and Thornton 2004; Spencer, Susko, and Roger 2005). Thus, our example provides a novel opportunity to study the relative performance of different tree-building methods.
Phylogenetic analyses of genes encoded by the nucleus and mitochondrion, as well as inferences on protein import machinery, suggest that red and green algae share organelles that are derived from the same or phylogenetically similar endosymbionts (McFadden and van Dooren 2004). Thus, an expectation is that orthologues from red and green plastids should be most closely related in phylogenetic reconstructions (fig. 4a).
With the TAB data set, there is a weak topological bias induced by differences in pvar among orthologues. In this case, the bias favors red and green algae being adjacent, and all methods converge efficiently onto this, the expected relationship, with 100% nonparametric bootstrap support. In this sense, our finding is comparable with reported findings in simulation studies where topological bias favors the expected phylogeny (Siddall 1998; Bruno and Halpern 1999; Swofford et al. 2001).
The more significant result concerns the strong topological bias revealed in the Rpo data set, which favored grouping of the green algae and outgroup taxa under least squares reconstructions and also parsimony tree building. Homogeneous maximum likelihood inference weakly favored an alternative tree, the tree returned by all methods of tree building on the TAB data set. Thus, these findings parallel those in earlier simulation studies, where sequences are highly diverged (Hillis, Huelsenbeck, and Swofford 1994), where a topological bias favors an incorrect phylogeny (Swofford et al. 2001), and where substitution model misspecification exists in some form (Sullivan and Swofford 2001; Susko, Inagaki, and Roger 2004). Findings from these simulation studies suggest that distance methods tend to be susceptible to model misspecification, less accurate than site pattern methods when sequences are highly diverged, and that maximum likelihood inference is more robust than parsimony to the problems of topological bias given some forms of model misspecification.
Although the form of model misspecification we report in our current study is different to that studied in these earlier simulations, our findings are nevertheless similar. The concurrence in this growing body of evidence is significant because the relevance of the findings of Sullivan and Swofford (2001) and Swofford et al. (2001) to real world sequences was recently brought into question by Kolaczkowski and Thornton (2004). Simulation studies by the latter suggested that parsimony outperformed homogeneous maximum likelihood under conditions that were thought to be more realistic than those considered earlier. However, their simulated conditions do not describe the form of heterotachy that we have identified in plastid and eubacterial sequences, and this may explain why our tree-building findings differ from those of Kolaczkowski and Thornton (2004).
Simulation studies that model the parameter space most relevant to empirical observations on sequence evolution are presently lacking, and this observation highlights an important direction for future research. We support the concern of Thornton and Kolaczkowski that there is a need to develop a better understanding of the potential forms of heterotachy that occur in nature. We stress that, although homogeneous maximum likelihood inference was robust to model misspecification in the example we have studied here, other cases are known (e.g., Inagaki et al. 2004) where pvar differs significantly among orthologues and where all standard methods of phylogenetic inference fail.
Martin Embley, Associate Editor
The sequences for Gloeobacter were kindly provided by Satoshi Tabata before their public release. We thank the anonymous reviewers and Associate Editor for many helpful comments that have improved our manuscript. This work was supported by the New Zealand Marsden Fund.
References
Ané, C., J. G. Burleigh, M. M. McMahon, and M. J. Sanderson.
Brown, R. P.
Bruno, W. J., and A. L. Halpern.
Felsenstein, J.
———.
Fitch, W. M., and E. Markowitz.
Galtier, N.
Guo, Z., and J. W. Stiller.
Hillis, D. M., J. P. Huelsenbeck, and D. L. Swofford.
Horner, D. S., and T. M. Embley.
Huelsenbeck, J. P.
Huson, D.
Inagaki, Y., E. Susko, N. M. Fast, and A. J. Roger.
Kolaczkowski, B., and J. W. Thornton.
Lockhart, P. J., A. W. D. Larkum, M. A. Steel, P. J. Waddell, and D. Penny.
Lockhart, P. J., M. A. Steel, A. C. Barbrook, D. H. Huson, and C. J. Howe.
Lockhart, P. J., D. Huson, U.-G. Maier, M. J. Fraunholz, Y. Van de Peer, A. C. Barbrook, C. J. Howe, and M. A. Steel.
Lopez, P., D. Casane, and H. Philippe.
Martin, W., B. Stoebe, V. Goremykin, S. Hansmann, M. Hasegawa, and K. V. Kowallik.
Mathsoft.
McFadden, G. I., and G. G. van Dooren.
Mintseris, J., and Z. Weng.
Misof, B., C. L. Anderson, T. R. Buckley, D. Erpenbeck, A. Rickert, and K. Misof.
Morgenstern, B.
Palmer, J. D., and C. F. Delwiche.
Penny, D., B. J. McComish, M. A. Charleston, and M. D. Hendy.
Philippe, H., and A. Germot.
Philippe, H., and P. Lopez.
Rambaut, A., and N. C. Grassly.
Siddall, M. E.
Simon, C., L. Nigro, J. Sullivan, K. Holsinger, A. Martin, A. Grapputo, A. Franke, and C. McIntosh.
Spencer, M., E. Susko, and A. J. Roger.
Steel, M. A.
Steel, M. A., D. Huson, and P. J. Lockhart.
Sullivan, J. A., and D. L. Swofford.
Susko, E., Y. Inagaki, and A. J. Roger.
Swofford, D. L.
Swofford, D. L., P. J. Waddell, J. P. Huelsenbeck, P. G. Foster, P. O. Lewis, and J. S. Rogers.
Thornton, J. W., and B. Kolaczowski.
Tuffley, C., and M. Steel.
Author notes
*The Allan Wilson Centre, Institute of Molecular BioSciences, Massey University, Palmerston North, New Zealand; †Manaaki Whenua—Landcare Research, Lincoln, New Zealand; ‡Department of Biology, New Mexico State University, Las Cruces; §Department of Zoology, University of Oxford, Oxford, United Kingdom; and ‖Sydney University Biological Informatics and Technology Centre, School of Biological Sciences, University of Sydney, Sydney, Australia
