


Abstract
We examine the properties of a sample of 35 nearby passive spiral galaxies in order to determine their dominant quenching mechanism(s). All five low-mass (M⋆ < 1 × 10¹⁰ M⊙) passive spiral galaxies are located in the rich Virgo cluster. This is in contrast to low-mass spiral galaxies with star formation, which inhabit a range of environments. We postulate that cluster-scale gas stripping and heating mechanisms operating only in rich clusters are required to quench low-mass passive spirals, and ram-pressure stripping and strangulation are obvious candidates. For higher mass passive spirals, while trends are present, the story is less clear. The passive spiral bar fraction is high: 74 ± 15 per cent, compared with 36 ± 5 per cent for a mass, redshift and T-type matched comparison sample of star-forming spiral galaxies. The high mass passive spirals occur mostly, but not exclusively, in groups, and can be central or satellite galaxies. The passive spiral group fraction of 74 ± 15 per cent is similar to that of the comparison sample of star-forming galaxies at 61 ± 7 per cent. We find evidence for both quenching via internal structure and environment in our passive spiral sample, though some galaxies have evidence of neither. From this, we conclude no one mechanism is responsible for quenching star formation in passive spiral galaxies – rather, a mixture of mechanisms is required to produce the passive spiral distribution we see today.
1 INTRODUCTION
In the established picture of galaxy evolution, a galaxy is likely to be quenched if it is massive (e.g. Kauffmann et al. 2003), or located in a dense environment (e.g. Peng et al. 2010). Low-mass quenched galaxies are preferentially satellites (e.g. Geha et al. 2012; Davies et al. 2016), and the vast majority of quenched galaxies possess early type morphology (e.g. Strateva et al. 2001; Bell et al. 2012). This implies that the mechanism(s) responsible for quenching star formation in most galaxies also result in morphological transformation, or vice versa.
Quenching mechanisms that alter morphology include processes that strip a galaxy of its gas upon entry into a denser environment, such as galaxy harassment (Lake, Katz & Moore 1998; Moore et al. 1996), galaxy–galaxy mergers (Toomre & Toomre 1972; White & Rees 1978; Kormendy & Ho 2013) and tidal stripping. There do exist environmental mechanisms that can quench a galaxy without impacting its morphology, however. Ram-pressure stripping (Gunn & Gott 1972; van Gorkom 2004; Bekki 2009) occurs in large galaxy clusters and strips the halo and disc of cold gas used as fuel for star formation without destroying the disc (e.g. Weinmann et al. 2006). Strangulation also acts to cut off the gas supply from the galaxy's sub-halo, causing star formation to cease when its gas reservoir is consumed (e.g. Larson, Tinsley & Caldwell 1980; Balogh, Navarro & Morris 2000). Mass quenching mechanisms such as AGN heating also act to cease star formation without destroying a galaxy's disc (e.g. Tabor & Binney 1993; Fabian et al. 1994).
There exist galaxies that do not conform to the above quenching paradigm, such as massive, star-forming discs (e.g. Ogle et al. 2016) and spiral galaxies that show no signs of star formation (Fraser-McKelvie et al. 2016). Passive spiral galaxies are rare but intriguing objects, as their existence asserts that morphological transformation is not always required to quench star formation. Although red spiral galaxies have been discussed in the literature for over 40 yr, (e.g. van den Bergh 1976; Goto et al. 2003; Ishigaki, Goto & Matsuhara 2007; Bamford et al. 2009; Skibba et al. 2009; Wolf et al. 2009; Bundy et al. 2010; Masters et al. 2010; Rowlands et al. 2012), these earlier samples often showed evidence of nebular line emission, ultraviolet (UV) light from young stellar populations or infrared (IR) excess from warm dust (e.g. Cortese 2012). For this reason, we define spiral galaxies that are optically red as red spirals, and those spirals without any signs of star formation as passive spiral galaxies.
In Fraser-McKelvie et al. (2016), we presented a photometrically and spectroscopically confirmed sample of passive spiral galaxies, selected using a mid-IR colour cut to ensure quiescence. These galaxies spanned a range of stellar masses, yet were uniformly passive and contained undisturbed spiral arms. Given that the mechanism(s) that cease star formation in passive spiral galaxies must do so without disrupting spiral structure, we may question whether the traditional quenching mechanisms that often destroy internal structure are occurring within these galaxies. The alternative hypothesis is that unique quenching pathways may be invoked to quench passive spiral galaxies, and this is the topic of this paper.
Alternate quenching mechanisms that do not require high stellar mass nor dense environmental regions have been characterized in the literature: for example, morphological quenching (e.g. Martig et al. 2009) or extra heating provided by the winds of dying low-mass stars (Conroy, van Dokkum & Kravtsov 2015). However, these mechanisms have been described only in early-type galaxies, and it is unclear whether they are also effective at quenching disc galaxies. In low-mass galaxies, supernova winds can expel a large fraction of interstellar medium on short time-scales, also quenching star formation (e.g. Dekel & Silk 1986; Yepes et al. 1997; Scannapieco et al. 2008; Bower et al. 2017).
The role of bars in galaxy evolution and quenching is well studied (e.g. Kormendy 1979; Kormendy & Kennicutt 2004; Ellison et al. 2011; Cheung et al. 2013). By channelling cold gas into the central regions of galaxies forcing a short lived starburst, bars are one of the most efficient re-distributors of gas in the discs of galaxies (e.g. Combes & Sanders 1981; Weinberg 1985; Friedli & Benz 1995; Athanassoula 2002; Knapen, Pérez-Ramírez & Laine 2002; Masters et al. 2011; Athanassoula 2013; Holmes et al. 2015).
Simulations show that strong bars are difficult to destroy once created (e.g. Shen & Sellwood 2004; Debattista et al. 2006), and are capable of driving gas into the nuclear regions of galaxies (e.g. Shlosman, Frank & Begelman 1989; Martinet & Friedli 1997; Jogee, Scoville & Kenney 2005; Khoperskov et al. 2017; Spinoso et al. 2017). The resultant quenched galaxy retains its spiral structure (e.g. Cheung et al. 2013; Gavazzi et al. 2015). Therefore, naturally we may suspect bars (or the mechanisms that create them) as being involved in passive spiral quenching.
Given the above quenching pathways, we wish to determine whether passive spiral galaxies have particular morphologies or environments that clearly distinguish them from other spiral galaxies, and thus identify or constrain their quenching mechanisms. To achieve this, we define a sample of passive spiral galaxies, along with a mass, redshift (z) and T-type-matched comparison sample.
This paper is organized as follows: In Section 2, we describe the sample of passive spiral galaxies used for this work, and in Section 3, we detail the control sample of spiral galaxies used for comparison. In Section 4, we examine the quenching mechanisms responsible for the formation of passive spirals by splitting our sample into high and low-mass bins. Throughout this paper, we use AB magnitudes and a flat Λ cold dark matter cosmology, with Ωm = 0.3, ΩΛ = 0.7 and H0 = 70 km s−1 Mpc2.
2 PASSIVE SPIRAL SAMPLE
To create our passive spiral sample, we use a similar method to Fraser-McKelvie et al. (2016), with some added refinements. We begin with the catalogue of Bonne et al. (2015), which is an all-sky sample of 13 325 local Universe galaxies drawn from the 2-Micron All-Sky Survey (2MASS) Extended Source Catalogue (Jarrett et al. 2000). This catalogue has a redshift and morphological completeness of 99 per cent to K = 12.59, with the majority of morphologies (in the form of T-types) coming from the PGC catalogue (Paturel et al. 2003).
We limit our analysis to the Sloan Digital Sky Survey (SDSS) imaging regions, to aid in accurate morphological classification using a large sample of uniform imaging. We select galaxies with −3 < T-type < 8, which allows for the misclassification of spirals as lenticulars, and perform the mid-IR colour cut of M%%%([0-9a-z]+)%% − MW3 < −2.73, where MK and MW3 are the 2MASS K band and Wide-Field Survey Explorer (WISE) 12-μm k-corrected absolute magnitudes, respectively. Fraser-McKelvie et al. (2016) showed this mid-IR colour cut is effective at separating passive spiral galaxies from optically red galaxies suffering from dust-obscured star formation. We confirm spiral morphology by visually inspecting each passive spiral candidate using SDSS colour images. Edge-on galaxies, shell galaxies, merger remnants, and elliptical and lenticular galaxies are rejected from our sample, leaving 35 bona fide spiral galaxies with passive mid-IR colour.
Our passive spiral sample spans the SDSS DR13 coverage region, and
0.0024 < z < 0.033 ,
3.9 × 10⁹ M⊙ < M⋆ < 8.5 × 10¹⁰ M⊙ ,
1 < T-type < 8,
where stellar masses are sourced from the NASA Sloan Atlas.1
We note there is no crossover between our passive spiral sample and that of the optically identified red spirals of Masters et al. (2010). In an effort to produce a sample dominated by discy spirals, Masters et al. (2010) selected only red spirals with a small bulge size using the SDSS quantity fracdeV < 0.5, where fracdeV measures the fraction of the galaxy light fit by a de Vaucouleurs profile. In Fig. 1 we plot a normalized probability histogram of the SDSS value fracdeV of both our passive spiral sample and the Masters et al. (2010) red spirals. Just one galaxy in our sample has fracdeV <0.5, highlighting the dichotomy between the Masters et al. (2010) sample and our own. We suggest that the reason our passive spiral sample is more passive than the red spirals of Masters et al. (2010) is simply because by making a cut in fracdeV, they excluded the most passive spiral galaxies.
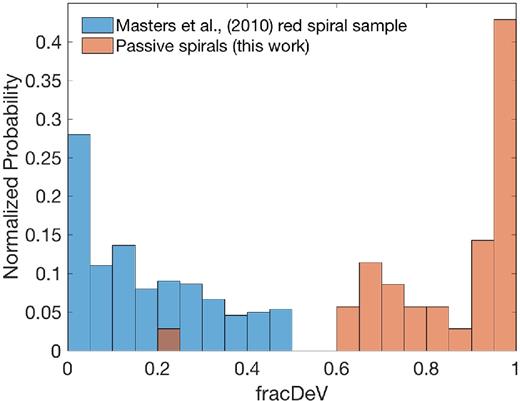
Comparison of the fracdeV quantity, a proxy for bulge size between the red spirals sample of Masters et al. (2010) in blue and the passive spirals selected in this work (orange). Just one galaxy from our sample has fracdeV < 0.5, and this is NGC 4880. We expect the almost bimodal distribution in bulge size between this work and that of Masters et al. (2010) is the reason that our passive spiral sample is more passive.
3 COMPARISON SAMPLE SELECTION
In order to analyse the trends seen in our passive spiral sample, we create a control sample of spiral galaxies. As bar fraction is correlated with stellar mass (e.g. Cameron et al. 2010; Melvin et al. 2014) and T-type (e.g. Martinez-Valpuesta, Knapen & Buta 2007; Nair & Abraham 2010), we elect to match our control sample in stellar mass, T-type and z. To create the control sample, we take all galaxies from the Bonne et al. (2015) catalogue, the parent catalogue of the passive spiral sample, and select the four galaxies that are closest in z and mass to each passive spiral galaxy. We impose the constraint that the T-type of the comparison galaxy must match that of the passive spiral galaxy it is being compared to. If the T-type of the passive spiral galaxy is listed as <1, we re-classify the galaxy, and select comparison galaxies according to the new T-type given. We note that to ensure a meaningful comparison that can be made between passive and non-passive spirals, we include the restriction that a galaxy already designated as a passive spiral galaxy cannot be used as a comparison for any other passive spiral galaxy and each comparison galaxy may only be used once. We select the four galaxies nearest in mass and z range to each passive spiral galaxy with the same T-type for a sample of 140, in the following ranges:
0.0027 < z < 0.043 ,
7.1 × 10⁸ < M⋆ < 9.0 × 10¹⁰ M⊙,
1 < T-type < 8.
We additionally require that all galaxies are within the SDSS DR13 imaging regions to ensure ease of morphological classification, and with axial ratio greater than 0.4, to enable easy feature identification. We clean the sample to remove any lenticulars or merging galaxies that have been misclassified.
In Fig. 2, we provide some examples of SDSS images of the passive spiral galaxies in our sample in the left-hand column, and the mass-matched comparison galaxies are shown in the four right-hand columns. All galaxies not already shown in the body of this paper are included in Fig. A1. We use this comparison sample to compare the trends seen in the passive spiral sample.
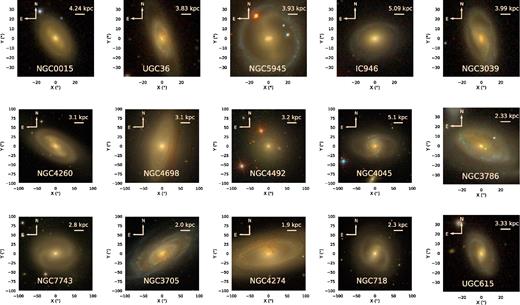
SDSS cutout gri images of some example passive spiral galaxies (left-hand side) and their four galaxies from the comparison sample closest in both z and stellar mass with the same T-type in the four columns on right-hand side . Although some of the galaxies in the comparison sample are red (a consequence of matching by T-type), the comparison galaxies generally show evidence for star formation including blue stellar populations and dust lanes.
4 QUENCHING MECHANISMS
We search for viable quenching pathways for our sample of passive spiral galaxies by determining their mass, environmental and internal structure properties. Given the dichotomy in galaxy properties and traditional quenching pathways present in mass-selected samples of galaxies (e.g. Geha et al. 2012), we split our analysis into low-mass passive spirals in Section 4.1 and high mass in Section 4.2.
4.1 The low-mass regime
Environmental quenching can account for nearly all quiescent low-mass galaxies at low redshift (e.g. Bamford et al. 2009; Peng et al. 2010; Geha et al. 2012; Kawinwanichakij et al. 2017). Motivated by studies such as these, we examine the environmental properties of the low-mass passive spirals in our sample.
Wolf et al. (2009) found that optically red low-mass spiral galaxies are rare – indeed, there are only five with M⋆ < 1 × 10¹⁰ M⊙ in our sample. These five galaxies – NGC 4440, NGC 4277, NGC 4880, NGC 4305 and NGC 4264 – are shown as postage stamp images with their four comparison galaxies in Fig. 3.
SDSS cutout gri images of the five low-mass passive spiral galaxies (left-hand side) and their four galaxies from the comparison sample closest in both z and stellar mass with the same T-type in the four columns on right-hand side. The five passive spirals are all located in Virgo, whilst the comparison galaxies with varying amounts of star formation are located across a range of environments.
As a first pass, in Fig. 4, we consider the positions of the low-mass passive spirals (gold stars) and their mass, z and T-type-matched comparison galaxies (gold squares) on the sky. Immediately from their right ascension, declination and distance listed in Table 1, we notice that the low-mass passive spiral galaxies are all part of the Virgo cluster. This is in line with results such as Bamford et al. (2009), who found that low-mass spirals in the densest regions are mostly optically red. Although the low-mass passive spiral galaxies are all satellites, as predicted by the Peng et al. (2010) model, none are located in groups, and are instead all members of a rich cluster. The same is not true of the low-mass comparison galaxies, which are spread across all environments. Of the comparison sample galaxies that are satellites, some show obvious star formation in their colour images (e.g. NGC 3380 and NGC 4413 in Fig. 3). It seems that being a low-mass spiral galaxy in a group or cluster is a necessary, but not sufficient condition for quenching. Therefore, the fact that these low-mass passive spiral galaxies are all in Virgo (and not just any sized group) is very significant.
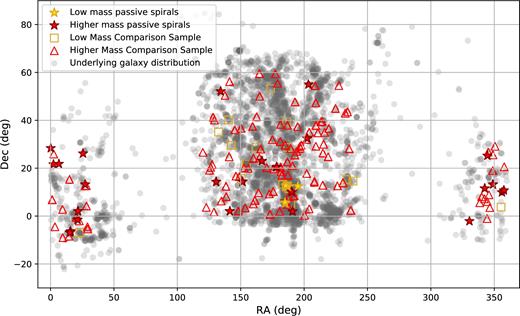
The position of passive spirals and comparison sample galaxies in the sky, with the underlying galaxy distribution for z < 0.01 from the NASA Sloan Atlas to accentuate local superstructure. Low-mass passive spirals are marked as gold stars, whereas higher mass passive spirals are red stars. The overdensity of the Virgo cluster is clearly seen in the underlying galaxy distribution, and all low-mass passive spirals lie in this region.
| Name | RA | Dec. | z1 | D2 | Stellar mass3 | T-type4 | |${N}_{\textrm{group}}^{5}$| | Galaxy5 | Bar?6 | Ansa Bar?6 |
|---|---|---|---|---|---|---|---|---|---|---|
| (J2000) | (J2000) | (Mpc) | (M⊙) | environment | ||||||
| NGC 4440 | 186.9732 | 12.2932 | 0.0024 | 25.69 | 3.89 × 10⁹ | 1 | 197 | Satellite | Yes | Yes |
| NGC 4277 | 185.0154 | 5.3414 | 0.0083 | 27.60 | 5.36 × 10⁹ | 1 | 39 | Satellite | Yes | No |
| NGC 4880 | 195.0439 | 12.4833 | 0.0051 | 25.55 | 6.85 × 10⁹ | 1 | 1 | Isolated7 | No | – |
| NGC 4305 | 185.5150 | 12.7408 | 0.0064 | 26.59 | 8.84 × 10⁹ | 1 | 197 | Satellite | No | – |
| NGC 4264 | 184.8991 | 5.8468 | 0.0084 | 27.61 | 9.28 × 10⁹ | 1 | 39 | Satellite | Yes | Yes |
| NGC 4260 | 184.8427 | 6.0988 | 0.0060 | 38.58* | 1.97 × 10¹⁰ | 1 | 39 | Satellite | Yes | No |
| NGC 2692 | 134.2418 | 52.0660 | 0.0126 | 30.03* | 2.12 × 10¹⁰ | 1 | 3 | BGG | Yes | Yes |
| NGC 0357 | 15.8412 | −6.3392 | 0.0078 | 27.22 | 2.13 × 10¹⁰ | 1 | 1 | Isolated | Yes | Yes |
| NGC 7743 | 356.0881 | 9.9341 | 0.0055 | 20.70* | 2.27 × 10¹⁰ | 1 | 2 | BGG | Yes | No |
| NGC 2648 | 130.6658 | 14.2855 | 0.0069 | 34.01* | 2.45 × 10¹⁰ | 1 | 1 | Isolated8 | No | – |
| NGC 656 | 25.6135 | 26.1431 | 0.0131 | 48.77 | 2.51 × 10¹⁰ | 1 | 1 | Isolated | Yes | Yes |
| NGC 4608 | 190.3053 | 10.1558 | 0.0062 | 20.18* | 2.95 × 10¹⁰ | 1 | 197 | Satellite | Yes | Yes |
| UGC 12800 | 357.5797 | 10.7574 | 0.0180 | 68.52 | 3.05 × 10¹⁰ | 1 | 1 | Isolated | Yes | Yes |
| NGC 4643 | 190.8339 | 1.9784 | 0.0044 | 26.44 | 3.22 × 10¹⁰ | 1 | 1 | Isolated | Yes | Yes |
| NGC 7563 | 348.9831 | 13.1962 | 0.0144 | 58.76* | 3.28 × 10¹⁰ | 1 | 7 | BGG | Yes | Yes |
| NGC 2878 | 141.4477 | 2.0896 | 0.0243 | 117.63 | 3.30 × 10¹⁰ | 2 | 2 | BGG | Yes | No |
| NGC 109 | 6.5610 | 21.8074 | 0.0182 | 60.16* | 3.34 × 10¹⁰ | 1 | 18 | Satellite | Yes | Yes |
| UGC 01271 | 27.2502 | 13.2112 | 0.0170 | 65.76 | 3.46 × 10¹⁰ | 1 | 10 | Satellite | Yes | Yes |
| NGC 538 | 21.3585 | −1.5506 | 0.0182 | 66.26* | 3.59 × 10¹⁰ | 2 | 43 | Satellite | Yes | No |
| NGC 345 | 15.3421 | −6.8843 | 0.0174 | 67.93 | 4.07 × 10¹⁰ | 1 | 9 | Satellite | No | – |
| NGC 4596 | 189.9831 | 10.1761 | 0.0062 | 26.38 | 4.19 × 10¹⁰ | 1 | 197 | Satellite | Yes | Yes |
| PGC 047732 | 203.3438 | 54.9491 | 0.0250 | 114.77 | 4.30 × 10¹⁰ | 2 | 1 | Isolated | Yes | No |
| UGC 8484 | 202.4019 | 32.4007 | 0.0247 | 117.32 | 4.47 × 10¹⁰ | 3 | 7 | Satellite | Yes | Yes |
| NGC 0015 | 2.2603 | 21.6245 | 0.0209 | 122.30* | 4.50 × 10¹⁰ | 1 | 1 | Isolated | Yes | No |
| PGC 070141 | 344.5540 | 25.2209 | 0.0251 | 99.78 | 4.81 × 10¹⁰ | 1 | 9 | Satellite | Yes | Yes |
| UGC 06163 | 166.7132 | 23.01627 | 0.0214 | 104.45 | 4.94 × 10¹⁰ | 1 | 4 | BGG | No | – |
| NGC 3943 | 178.2358 | 20.4791 | 0.0220 | 107.65 | 4.95 × 10¹⁰ | 2 | 18 | Satellite | Yes | Yes |
| PGC 67858 | 330.4222 | −2.0983 | 0.0269 | 109.82 | 5.07 × 10¹⁰ | 3 | 7 | Satellite | No | – |
| NGC 7383 | 342.3986 | 11.5564 | 0.0270 | 108.39 | 5.14 × 10¹⁰ | 1 | 10 | Satellite | Yes | No |
| NGC 7389 | 342.5670 | 11.5662 | 0.0264 | 105.51 | 5.70 × 10¹⁰ | 3 | 10 | Satellite | Yes | Yes |
| PGC 029301 | 151.4473 | 14.3387 | 0.0312 | 148.71 | 6.27 × 10¹⁰ | 5 | 6 | Satellite | Yes | Yes |
| UGC 12897 | 0.1581 | 28.3845 | 0.0290 | 126.28* | 7.64 × 10¹⁰ | 2 | 6 | Satellite | No | – |
| NGC 550 | 21.6773 | 2.0224 | 0.0194 | 92.57* | 7.75 × 10¹⁰ | 1 | 8 | Satellite | No | – |
| NGC 2618 | 128.9731 | 0.7072 | 0.0134 | 61.05* | 8.17 × 10¹⁰ | 2 | 1 | Isolated | No | – |
| NGC 3527 | 166.8258 | 28.5278 | 0.0333 | 107.39* | 8.52 × 10¹⁰ | 1 | 27 | Satellite | Yes | Yes |
Notes.1From Bonne et al. (2015).
2*Denotes redshift independent distances from NED, collated by Bonne et al. (2015), otherwise these are flow-corrected distances, calculated by Bonne et al. (2015).
3From NASA Sloan Atlas.
5Group information from Tully (2015).
6From visual inspection by the authors.
7Whilst listed as isolated by Tully (2015), we expect this galaxy to be within the Virgo cluster (e.g. de Vaucouleurs 1961; Eastmond & Abell 1978).
8Whilst listed as isolated by Tully (2015), this galaxy has a close companion confirmed by SDSS imaging and spectroscopy.
| Name | RA | Dec. | z1 | D2 | Stellar mass3 | T-type4 | |${N}_{\textrm{group}}^{5}$| | Galaxy5 | Bar?6 | Ansa Bar?6 |
|---|---|---|---|---|---|---|---|---|---|---|
| (J2000) | (J2000) | (Mpc) | (M⊙) | environment | ||||||
| NGC 4440 | 186.9732 | 12.2932 | 0.0024 | 25.69 | 3.89 × 10⁹ | 1 | 197 | Satellite | Yes | Yes |
| NGC 4277 | 185.0154 | 5.3414 | 0.0083 | 27.60 | 5.36 × 10⁹ | 1 | 39 | Satellite | Yes | No |
| NGC 4880 | 195.0439 | 12.4833 | 0.0051 | 25.55 | 6.85 × 10⁹ | 1 | 1 | Isolated7 | No | – |
| NGC 4305 | 185.5150 | 12.7408 | 0.0064 | 26.59 | 8.84 × 10⁹ | 1 | 197 | Satellite | No | – |
| NGC 4264 | 184.8991 | 5.8468 | 0.0084 | 27.61 | 9.28 × 10⁹ | 1 | 39 | Satellite | Yes | Yes |
| NGC 4260 | 184.8427 | 6.0988 | 0.0060 | 38.58* | 1.97 × 10¹⁰ | 1 | 39 | Satellite | Yes | No |
| NGC 2692 | 134.2418 | 52.0660 | 0.0126 | 30.03* | 2.12 × 10¹⁰ | 1 | 3 | BGG | Yes | Yes |
| NGC 0357 | 15.8412 | −6.3392 | 0.0078 | 27.22 | 2.13 × 10¹⁰ | 1 | 1 | Isolated | Yes | Yes |
| NGC 7743 | 356.0881 | 9.9341 | 0.0055 | 20.70* | 2.27 × 10¹⁰ | 1 | 2 | BGG | Yes | No |
| NGC 2648 | 130.6658 | 14.2855 | 0.0069 | 34.01* | 2.45 × 10¹⁰ | 1 | 1 | Isolated8 | No | – |
| NGC 656 | 25.6135 | 26.1431 | 0.0131 | 48.77 | 2.51 × 10¹⁰ | 1 | 1 | Isolated | Yes | Yes |
| NGC 4608 | 190.3053 | 10.1558 | 0.0062 | 20.18* | 2.95 × 10¹⁰ | 1 | 197 | Satellite | Yes | Yes |
| UGC 12800 | 357.5797 | 10.7574 | 0.0180 | 68.52 | 3.05 × 10¹⁰ | 1 | 1 | Isolated | Yes | Yes |
| NGC 4643 | 190.8339 | 1.9784 | 0.0044 | 26.44 | 3.22 × 10¹⁰ | 1 | 1 | Isolated | Yes | Yes |
| NGC 7563 | 348.9831 | 13.1962 | 0.0144 | 58.76* | 3.28 × 10¹⁰ | 1 | 7 | BGG | Yes | Yes |
| NGC 2878 | 141.4477 | 2.0896 | 0.0243 | 117.63 | 3.30 × 10¹⁰ | 2 | 2 | BGG | Yes | No |
| NGC 109 | 6.5610 | 21.8074 | 0.0182 | 60.16* | 3.34 × 10¹⁰ | 1 | 18 | Satellite | Yes | Yes |
| UGC 01271 | 27.2502 | 13.2112 | 0.0170 | 65.76 | 3.46 × 10¹⁰ | 1 | 10 | Satellite | Yes | Yes |
| NGC 538 | 21.3585 | −1.5506 | 0.0182 | 66.26* | 3.59 × 10¹⁰ | 2 | 43 | Satellite | Yes | No |
| NGC 345 | 15.3421 | −6.8843 | 0.0174 | 67.93 | 4.07 × 10¹⁰ | 1 | 9 | Satellite | No | – |
| NGC 4596 | 189.9831 | 10.1761 | 0.0062 | 26.38 | 4.19 × 10¹⁰ | 1 | 197 | Satellite | Yes | Yes |
| PGC 047732 | 203.3438 | 54.9491 | 0.0250 | 114.77 | 4.30 × 10¹⁰ | 2 | 1 | Isolated | Yes | No |
| UGC 8484 | 202.4019 | 32.4007 | 0.0247 | 117.32 | 4.47 × 10¹⁰ | 3 | 7 | Satellite | Yes | Yes |
| NGC 0015 | 2.2603 | 21.6245 | 0.0209 | 122.30* | 4.50 × 10¹⁰ | 1 | 1 | Isolated | Yes | No |
| PGC 070141 | 344.5540 | 25.2209 | 0.0251 | 99.78 | 4.81 × 10¹⁰ | 1 | 9 | Satellite | Yes | Yes |
| UGC 06163 | 166.7132 | 23.01627 | 0.0214 | 104.45 | 4.94 × 10¹⁰ | 1 | 4 | BGG | No | – |
| NGC 3943 | 178.2358 | 20.4791 | 0.0220 | 107.65 | 4.95 × 10¹⁰ | 2 | 18 | Satellite | Yes | Yes |
| PGC 67858 | 330.4222 | −2.0983 | 0.0269 | 109.82 | 5.07 × 10¹⁰ | 3 | 7 | Satellite | No | – |
| NGC 7383 | 342.3986 | 11.5564 | 0.0270 | 108.39 | 5.14 × 10¹⁰ | 1 | 10 | Satellite | Yes | No |
| NGC 7389 | 342.5670 | 11.5662 | 0.0264 | 105.51 | 5.70 × 10¹⁰ | 3 | 10 | Satellite | Yes | Yes |
| PGC 029301 | 151.4473 | 14.3387 | 0.0312 | 148.71 | 6.27 × 10¹⁰ | 5 | 6 | Satellite | Yes | Yes |
| UGC 12897 | 0.1581 | 28.3845 | 0.0290 | 126.28* | 7.64 × 10¹⁰ | 2 | 6 | Satellite | No | – |
| NGC 550 | 21.6773 | 2.0224 | 0.0194 | 92.57* | 7.75 × 10¹⁰ | 1 | 8 | Satellite | No | – |
| NGC 2618 | 128.9731 | 0.7072 | 0.0134 | 61.05* | 8.17 × 10¹⁰ | 2 | 1 | Isolated | No | – |
| NGC 3527 | 166.8258 | 28.5278 | 0.0333 | 107.39* | 8.52 × 10¹⁰ | 1 | 27 | Satellite | Yes | Yes |
Notes.1From Bonne et al. (2015).
2*Denotes redshift independent distances from NED, collated by Bonne et al. (2015), otherwise these are flow-corrected distances, calculated by Bonne et al. (2015).
3From NASA Sloan Atlas.
5Group information from Tully (2015).
6From visual inspection by the authors.
7Whilst listed as isolated by Tully (2015), we expect this galaxy to be within the Virgo cluster (e.g. de Vaucouleurs 1961; Eastmond & Abell 1978).
8Whilst listed as isolated by Tully (2015), this galaxy has a close companion confirmed by SDSS imaging and spectroscopy.
There are many low-mass passive satellite galaxies in groups in the Bonne et al. (2015) sample, but these are mostly T-type<1 galaxies without discernible spiral structure. The obvious inference is that upon entering a group, spiral galaxies that have their star formation quenched via environmental processes will also transform their morphology from late to early type. Given that the only place where we have found low-mass passive spirals is within the rich cluster environment, we question whether the quenching mechanism that preserves spiral morphology occurs exclusively in galaxy clusters. Alternatively, gas stripping in rich clusters may occur so quickly that we observe passive spirals before their morphology is transformed. Ram-pressure stripping has been shown in simulations to act on time-scales as short as ∼2 Gyr (Fillingham et al. 2015), for low-mass galaxies, and could certainly explain our results. Either way, we speculate that the only way a spiral can avoid the violent group processes that transform its morphology is by instead entering a cluster. Cluster-specific processes such as ram-pressure stripping or strangulation can then act to strip gas gently and quench the galaxy whilst preserving its morphology.
We note here that a significant portion of our nearby galaxies are located within the Virgo cluster. All of our low-mass passive spirals and 5/20 of their comparison sample counterparts are located within Virgo. We also note that we have a small sample size. We therefore determine that the chance that five galaxies are randomly located in Virgo given that 25 per cent of low-mass comparison galaxies are within Virgo to be 0.1 per cent by the binomial theorem. From this, we determine there is only a small chance that the passive spirals may be located in Virgo by random chance.
From the above analysis, we may infer that cluster-scale gas stripping mechanisms such as ram-pressure stripping and/or strangulation may be the mechanism(s) responsible for ceasing star formation in low-mass (M⋆ < 1 × 10¹⁰ M⊙) passive spiral galaxies.
4.2 Higher mass passive spirals
If prior literature on red spiral galaxies is a guide, it is unlikely that higher mass (M⋆ > 1 × 10¹⁰ M⊙) passive spiral galaxies will occupy specific environments or display unique morphologies. Previous samples of red spiral galaxies defined by optical colour selection criteria place red spirals in denser regions on average than their more star-forming counterparts (e.g. Bamford et al. 2009; Masters et al. 2010), and are more likely to be satellites (Skibba et al. 2009), but with considerable spread among these trends. Optically red spirals have been found at all environmental densities, and indeed we see a range of environments listed in Table 1.
To quantify this, we match the passive spiral and comparison sample to the groups catalogue of Tully (2015), which is an all-sky groups catalogue using the 2MASS Redshift Survey as an input catalogue. Although the fraction of passive spiral galaxies in groups (defined as two or more members) is high at 74 ± 15 per cent, it is comparable to the control sample of spiral galaxies with 61 ± 7 per cent. The fraction of brightest group galaxies (BGGs) and fraction of galaxies located in clusters (ten or more members) are comparable for both the passive spiral and comparison sample galaxies, though passive spirals are slightly less likely to be isolated (26 ± 9 per cent compared to 39 ± 5 per cent for the comparison sample). The environment fractions are listed in Table 2, and the passive spiral and comparison sample group properties are listed in Tables 1 and A1, respectively. Given the lack of environmental trends seen in the passive spiral sample when compared to the comparison sample, we turn instead to other quenching mechanisms, and examine the internal structure of the galaxies in our sample.
The environments of both the passive spiral and mass, z and T-type-matched comparison samples as matched to the Tully (2015) catalogue. There is no significant difference in group fraction between the passive spiral and comparison samples.
| per cent in groups of N ≥ 2 | per cent BGGs | per cent in clusters of N ≥ 10 | per cent Isolated | |
|---|---|---|---|---|
| Passive spiral sample | 74 ± 15 per cent (26/35) | 14 ± 6 per cent(5/35) | 20 ± 8 per cent (7/35) | 26 ± 9 per cent (9/35) |
| Comparison Sample | 61 ± 7 per cent (85/140) | 20 ± 4 per cent (28/140) | 19 ± 4 per cent (26/140) | 39 ± 5 per cent (55/140) |
4.2.1 Passive spiral bar fractions
Bars are an important component of disc galaxies, thought to have the ability to transfer angular momentum and gas from the disc to the central regions of a galaxy (e.g. Combes & Sanders 1981; Weinberg 1985; Masters et al. 2011). The Masters et al. (2010) red spiral sample had a bar fraction ∼ 40 per cent higher than a similar sample of blue (or more obviously star-forming) spirals. They suggest a correlation between bar instabilities and the quenching of star formation in optically red spirals. Motivated by this result, we check the bar fraction of both our passive spiral sample and, to mitigate any selection issues in bar identification, the mass, z and T-type-matched control sample.
We visually examine the SDSS colour images of each galaxy to determine bar fraction, including both large and small bars. We note that due to the quality of the SDSS images coupled with the low redshift of the sample, small bars within a galaxy are easily visible. The subtlety of these objects may have made them more difficult to see in older photographic plate images.
We find a significantly higher bar fraction in the passive spiral sample of 74 ± 15 per cent, compared to the comparison sample with 36 ± 5 per cent, shown in Table 3, where errors are binomial. Local Universe bar fractions have been stated to be anywhere from 20–30 per cent (de Vaucouleurs et al. 1991; Masters et al. 2011), up to ∼ 50 per cent (Barazza, Jogee & Marinova 2008; Aguerri, Méndez-Abreu & Corsini 2009). Our result is in line with the red spiral bar fraction of 67 ± 5 per cent for the Masters et al. (2010) sample.
Bar fractions in the passive spiral sample and the mass, z and T-type-matched comparison sample. The bar fraction and ansa bar fraction of the passive spiral sample are much higher than those of the comparison sample, suggesting bars are involved in the quenching of passive spirals.
| Bar fraction | Ansa bar fraction | |
|---|---|---|
| Passive spiral sample | 74 ± 15 per cent (26/35) | 69 ± 16 per cent (18/26) |
| Control Sample | 36 ± 5 per cent (51/140) | 29 ± 8 per cent (15/51) |
| Bar fraction | Ansa bar fraction | |
|---|---|---|
| Passive spiral sample | 74 ± 15 per cent (26/35) | 69 ± 16 per cent (18/26) |
| Control Sample | 36 ± 5 per cent (51/140) | 29 ± 8 per cent (15/51) |
Ansa bars are bars that terminate with two distinct enhancements of light at either end of the bar (or a ‘handle’, e.g. Martinez-Valpuesta, Knapen & Buta 2008), a good example of which is shown by NGC 4440 in Fig. 3. The origin of ansae is unknown, but it is thought to be related to the growth of galactic bars, with ansae appearing in simulations only after a few Gyr of evolution (e.g. Martinez-Valpuesta, Shlosman & Heller 2006). Ansa bars are prevalent in Sa spirals, but almost non-existent in later types (Martinez-Valpuesta et al. 2007). Interestingly, the ansa bar fraction of the passive spiral sample is much higher than the comparison sample (69 ± 16 per cent of all barred spirals in the sample, compared to 29 ± 8 per cent), despite being matched in T-type. Bars (and ansa bars in particular) are far more common in passive spiral galaxies than comparable star-forming spiral galaxies. However, whether these bars are responsible for, or an effect of, quenching is unclear.
4.2.2 Other quenching mechanisms
From the previous sections, one could paint a picture of quenching being a consequence of bars and environment in combination, perhaps with unbarred galaxies being satellites while barred galaxies are BGGs and isolated galaxies. This is inconsistent with the data, however, as passive spiral galaxies without bars and with stellar masses of ∼5 × 10¹⁰ M⊙ can be BGGs (UGC 6163), satellite galaxies (PGC 070141) and isolated galaxies (NGC 2618).
The one unbarred, truly isolated galaxy in our passive spiral sample, NGC 2618, has a stellar mass of 8.2 × 10¹⁰ M⊙. This implies a halo mass of ∼1013 M⊙ (Hopkins et al. 2014), at which star formation is largely truncated and consistent with virial shock heating (e.g. Dekel & Birnboim 2006; Dolley et al. 2014). Although by definition we can invoke mass quenching to explain the most massive passive spiral galaxies, it provides few, if any, insights into the underlying astrophysics. Furthermore, all of our massive passive spiral galaxies are matched to star-forming control galaxies with comparable stellar masses, so mass quenching is not deterministic (at least for our mass range).
Combining mass quenching with another mechanism is not particularly satisfying either, given passive spiral galaxies with masses in the 1 × 10¹⁰–8.5 × 10¹⁰ M⊙ range include galaxies with and without bars, isolated galaxies and group members. Only passive spiral galaxies with masses below 1 × 10¹⁰ M⊙, which all reside in Virgo, show evidence of all being quenched by the same cluster-specific mechanism. For now, we conclude that the mechanism(s) that quench the most massive passive spiral galaxies remain a puzzle.
5 STELLAR AGE AND METALLICITY DIFFERENCES BETWEEN LOW AND HIGH MASS PASSIVE SPIRALS
Given that low-mass passive spiral galaxies appear to be quenched by cluster-scale environmental processes and higher mass through a combination of mechanisms, we investigate whether evidence of the quenching mechanism shows up in a galaxy's stellar population. We examine both the integrated colours and the central stellar age and metallicity derived from H β and [MgFe]΄ Lick indices of the passive spiral sample.
Fig. 5 is an optical and UV colour–colour diagram, with passive spiral photometry re-measured using matched-aperture photometry of archival NASA Sloan Atlas images. We ensure that any foreground features are masked in this process. The SED sample of Brown et al. (2014) with reliable multiband photometry is also shown to illustrate the general shape of the galaxy distribution in this colour space. High-mass barred and unbarred passive spirals are systematically redder in g − r colour than their low-mass counterparts. Given the well-known age-metallicity degeneracy (e.g. Tremonti et al. 2004), this suggests either a younger or more metal poor stellar population in low-mass passive spiral galaxies.
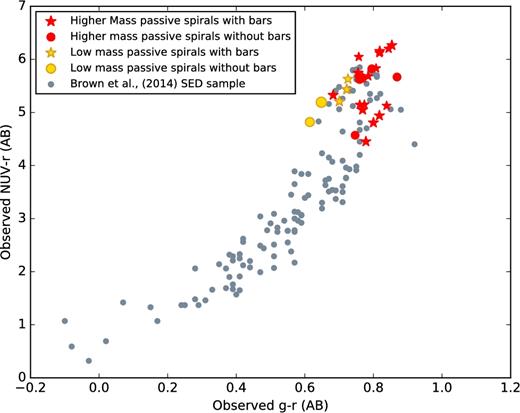
Optical/NUV colour–colour diagram of the passive spiral sample in order to determine whether we can see evidence of particular quenching mechanisms showing up in their stellar populations. Photometry for the passive spirals is taken from matched aperture photometry of NASA Sloan Atlas images, and the underlying galaxy population from Brown et al. (2014). The low-mass passive spirals are mostly bluer in g − r colour than the higher mass sample, indicating either younger stellar populations, or lower metallicity (or both).
![Spectroscopic index–index diagram for passive spiral galaxies and the mass, z, and T-type matched comparison sample using the Lick indices H β and [MgFe]΄ measured with SDSS-II 3″ fibre spectroscopy of galaxy nuclei. The single stellar population model predictions of Vazdekis et al. (2010) are plotted as black lines for comparison. Of the passive spirals that have SDSS Lick index measurements, all but one of the higher mass galaxies have similar metallicities and ages, whereas lower mass galaxies have a broad spread of ages and metallicities. The lower mass passive spirals have on average, younger stellar populations than the high mass passive spirals. Given the lower mass passive spirals are located in a rich cluster, we may speculate that they have fallen into the cluster relatively recently.](https://oup.silverchair-cdn.com/oup/backfile/Content_public/Journal/mnras/474/2/10.1093_mnras_stx2823/4/m_stx2823fig6.jpeg?Expires=1716480664&Signature=EzUamifDzqvat2qfAufjvXBTe3mmRMTR-ICVA-M5QCVG05tnaDqCeQWSMA~oESUY0-aLhhgj82h7qWj4w50f7Yz78gYd2K4CUO3M5yE1MDEnqaLetat0DoSO5Eg5CUylTQFQVjmYXqHqHwqdaQTAvuTSyzPN3tlsr51vNws6iOWMgtUvECJggp6WntcNgQYGLboQRGVXHcKQY05e40MkQAzBp2VQFygZh6b6mTpOhX6~JLOkeVinbmhLSJLo2T47cZ5GmVklpmRbXq6PVRJ5SD59iJt4eqW6Kx~CXqEd-LZ1-jF3IsiE27BQOsjDdQHi2vtQxY9CBMpI9Wmn4-wkpA__&Key-Pair-Id=APKAIE5G5CRDK6RD3PGA)
Spectroscopic index–index diagram for passive spiral galaxies and the mass, z, and T-type matched comparison sample using the Lick indices H β and [MgFe]΄ measured with SDSS-II 3″ fibre spectroscopy of galaxy nuclei. The single stellar population model predictions of Vazdekis et al. (2010) are plotted as black lines for comparison. Of the passive spirals that have SDSS Lick index measurements, all but one of the higher mass galaxies have similar metallicities and ages, whereas lower mass galaxies have a broad spread of ages and metallicities. The lower mass passive spirals have on average, younger stellar populations than the high mass passive spirals. Given the lower mass passive spirals are located in a rich cluster, we may speculate that they have fallen into the cluster relatively recently.
In contrast, the four low-mass passive spirals are spread across a range of metallicities and stellar ages. The low-mass passive spirals have younger stellar ages than all but one of the higher mass galaxies, and while one is more metal poor than the higher mass spirals, the other three are more metal rich. From their comparatively young stellar ages, we postulate that the low-mass passive spirals have fallen into Virgo and quenched relatively recently, within the past ∼1–2 Gyr. The low-mass comparison sample are also spread throughout stellar age and metallicity space.
The tight clustering of the higher mass passive spirals around a common age and metallicity is perhaps surprising, given their lack of coherent quenching model. We suspect that the similarly old bulge stellar ages and rich metallicities mean these galaxies quenched a long time ago, and any signature of quenching is no longer visible.
6 SUMMARY AND CONCLUSIONS
We investigate what quenched star formation in passive spiral galaxies, using a sample of 35 z < 0.033 passive spiral galaxies and a comparison sample matched in mass, z and T-Type.
All five low-mass (M⋆ < 1 × 10¹⁰ M⊙) passive spiral galaxies in our sample are members of the Virgo cluster, and thus environment driven quenching is the most likely explanation for these galaxies. A large spread in both [MgFe]΄ and H β Lick indices implies a range of central metallicities and stellar ages, though the oldest of the low-mass passive spirals is younger than all but one of the high mass passive spiral sample. Given the implied ages and metallicities from the Vazdekis et al. (2010) models and the similar environments of the low-mass passive spiral sample, we suspect these galaxies have fallen into the Virgo cluster and quenched more recently than their higher mass passive spiral counterparts. Ram-pressure stripping and/or strangulation may be the relevant quenching mechanisms.
The bar fraction of passive spiral galaxies is high: 74 ± 15 per cent, compared to 36 ± 5 per cent for a mass, z and T-type-matched comparison sample of spirals. The bars of passive spiral galaxies feature ansae 69 ± 16 per cent of the time, much more frequently than the comparison sample at 29 ± 8 per cent. From this, we conclude that bars or the mechanism(s) responsible for creating them may also be quenching star formation in passive spirals. This is consistent with a bar quenching scenario, where gas is funnelled via a bar to the central regions of the galaxy, promoting pseudobulge growth, and inducing a starburst, followed by eventual quenching (e.g. Friedli & Benz 1995; Knapen et al. 2002; Jogee et al. 2005).
Higher mass passive spiral galaxies are amongst the oldest and most metal-rich spiral galaxies. Although many high mass passive galaxies have bars and all low-mass passive spiral galaxies are Virgo satellite galaxies, a simple combination of bars and environment driven quenching does not explain passive spiral galaxies. Passive spiral galaxies without bars can be BGGs (e.g. UGC 6163), satellite galaxies (e.g. NGC 345), be interacting (e.g. NGC 2648) or isolated galaxies (e.g. NGC 2618). We thus conclude that no one mechanism is responsible for quenching all passive spiral galaxies in our sample. Bars (and ansa bars) seem heavily involved for many galaxies, and environment driven quenching (perhaps ram-pressure stripping or harassment) best explains the lowest mass passive spiral galaxies.
Although future studies with larger sample sizes will be able to address this question in a more statistical way, large-scale galaxy integral field spectroscopic surveys may also be employed to determine stellar populations and metallicities across an entire galaxy. Surveys such as Mapping Nearby Galaxies at APO (MaNGA; Bundy et al. 2015) and the Sydney-AAO Multi-object Integral field Spectrograph galaxy survey (SAMI; Croom et al. 2012) will provide insight into the star formation and quenching history of low and high mass passive spiral galaxies, in turn, confirming the relevant quenching mechanisms and time-scales.
ACKNOWLEDGEMENTS
We wish to thank the anonymous referee for their insightful comments that improved the quality of this manuscript. AF-M acknowledges the support of an Australian Postgraduate Award and a Monash Graduate Education Postgraduate Publications Award. Funding for the SDSS III has been provided by the Alfred P. Sloan Foundation, the US Department of Energy Office of Science and the Participating Institutions. This publication makes use of data products from the Wide-field Infrared Survey Explorer, which is a joint project of the University of California, Los Angeles and the Jet Propulsion Laboratory/California Institute of Technology, funded by the National Aeronautics and Space Administration. This publication makes use of data products from the Wide-field Infrared Survey Explorer, which is a joint project of the University of California, Los Angeles and the Jet Propulsion Laboratory/California Institute of Technology, funded by the National Aeronautics and Space Administration. This publication makes use of data products from the Two Micron All Sky Survey, which is a joint project of the University of Massachusetts and the Infrared Processing and Analysis Center/California Institute of Technology, funded by the National Aeronautics and Space Administration and the National Science Foundation.
Footnotes
REFERENCES
APPENDIX A: PASSIVE SPIRAL COMPARISON SAMPLE PROPERTIES AND HIGHER MASS SAMPLE IMAGES
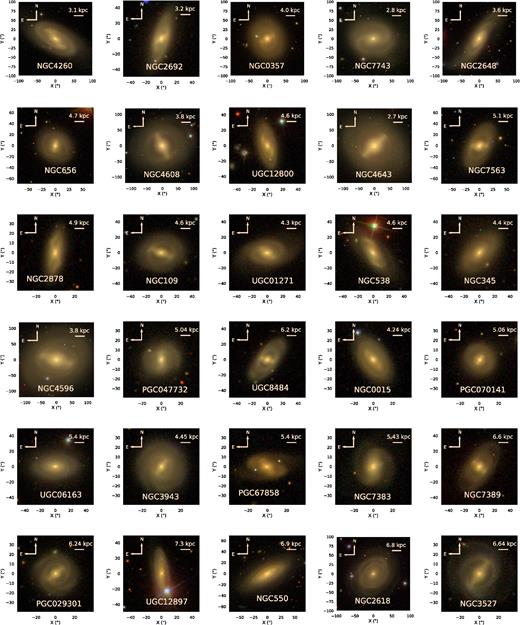
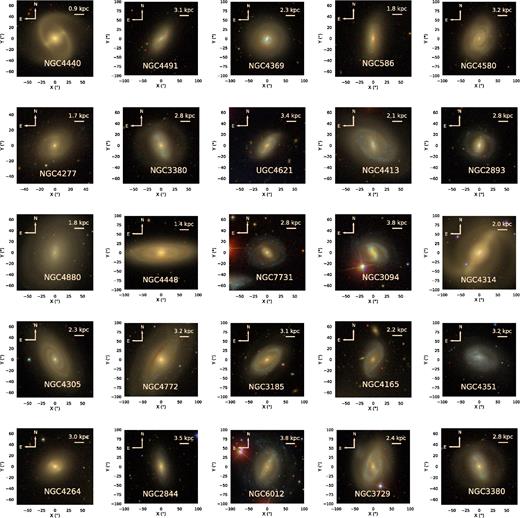
SDSS cutout gri images of the 30 galaxies in the higher mass passive spiral sample.
The mass, z and T-type-matched comparison sample of all spiral galaxies and their properties. The left most column denotes the passive spiral galaxy, followed by its four comparisons matched most closely in mass, z and T-type from the sample of Bonne et al. (2015). The horizontal line separates thet five low-mass passive spiral galaxies and their comparison galaxies from their higher mass counterparts.
| Passive | Comparison | RA | Dec. | z1 | D2 | Mass3 | T-type4 | |${N}_{\textrm{group}}^{5}$| | Galaxy5 | Bar?6 | Ansa6 |
|---|---|---|---|---|---|---|---|---|---|---|---|
| spiral | galaxy | (J2000) | (J2000) | (Mpc) | (M⊙) | environment | bar? | ||||
| NGC 4440 | PGC 41376 | 187.7381 | 11.4836 | 0.0060 | 25.63 | 7.12 × 10⁸ | 1 | 197 | Satellite | Yes | No |
| PGC 40396 | 186.1508 | 39.3830 | 0.0045 | 19.14 | 3.86× 10⁹ | 1 | 1 | Isolated | No | – | |
| PGC 5679 | 22.9035 | −6.8937 | 0.0050 | 21.23 | 3.80× 10⁹ | 1 | 8 | Satellite | No | – | |
| PGC 42174 | 189.4517 | 5.3684 | 0.0061 | 17.50* | 4.93 × 10⁹ | 1 | 1 | Isolated | No | – | |
| NGC 4277 | PGC 32287 | 162.0507 | 28.6018 | 0.0079 | 33.90 | 5.86 × 10⁹ | 1 | 5 | Satellite | No | – |
| PGC 24829 | 132.5492 | 35.0764 | 0.0095 | 43.35* | 4.92× 10⁹ | 1 | 1 | Isolated | No | – | |
| PGC 40705 | 186.6344 | 12.6108 | 0.0059 | 22.47* | 7.10 × 10⁸ | 1 | 197 | Satellite | Yes | No | |
| PGC 26979 | 142.5707 | 29.5400 | 0.0077 | 33.20 | 2.93 × 10⁹ | 1 | 1 | Isolated | Yes | No | |
| NGC 4880 | PGC 40988 | 187.0643 | 28.6203 | 0.0027 | 11.73 | 6.33 × 10⁹ | 1 | 15 | Satellite | No | – |
| PGC 72128 | 355.3712 | 3.7400 | 0.0078 | 33.59 | 7.86 × 10⁹ | 1 | 2 | BGG | Yes | No | |
| PGC 30445 | 155.8775 | 19.8650 | 0.0052 | 23.57* | 1.46 × 10¹⁰ | 1 | 11 | Satellite | No | – | |
| PGC 29009 | 150.3580 | 15.7700 | 0.0106 | 35.50* | 8.36 × 10⁹ | 1 | 1 | Isolated | Yes | No | |
| NGC 4305 | PGC 43798 | 193.3716 | 2.1683 | 0.0061 | 43.57* | 9.67 × 10⁹ | 1 | 7 | Satellite | No | – |
| PGC 30059 | 154.4107 | 21.6882 | 0.0060 | 27.54* | 8.23 × 10⁹ | 1 | 11 | Satellite | Yes | No | |
| PGC 38885 | 183.0492 | 13.2464 | 0.0062 | 57.27* | 3.28 × 10⁹ | 1 | 9 | Satellite | No | – | |
| PGC 40306 | 186.0065 | 12.2050 | 0.0063 | 29.33* | 5.02 × 10⁹ | 1 | 197 | Satellite | No | – | |
| NGC 4264 | PGC 26501 | 140.4501 | 40.1512 | 0.0068 | 43.75* | 5.50 × 10⁹ | 1 | 1 | Isolated | No | – |
| PGC 56334 | 238.5581 | 14.6012 | 0.0073 | 19.99* | 7.56 × 10⁹ | 1 | 1 | Isolated | Yes | No | |
| PGC 55480 | 233.6350 | 15.1938 | 0.0082 | 22.77* | 8.30 × 10⁹ | 1 | 3 | BGG | No | – | |
| PGC 35711 | 173.4556 | 53.1255 | 0.0047 | 22.69* | 8.27 × 10⁹ | 1 | 65 | Satellite | No | – | |
| NGC 4260 | PGC 43254 | 192.0955 | 8.4872 | 0.0060 | 28.24* | 1.95 × 10¹⁰ | 1 | 1 | Isolated | No | – |
| PGC 41383 | 187.7489 | 8.0779 | 0.0062 | 26.62 | 1.56 × 10¹⁰ | 1 | 197 | Satellite | No | – | |
| PGC 38031 | 180.6761 | 1.9768 | 0.0010 | 28.43* | 1.98 × 10¹⁰ | 1 | 1 | Isolated | No | – | |
| PGC 36158 | 174.9271 | 31.9094 | 0.0114 | 46.73* | 1.96 × 10¹⁰ | 1 | 2 | BGG | No | – | |
| NGC 2692 | PGC 49431 | 208.6214 | 54.3307 | 0.0167 | 72.25 | 2.12 × 10¹⁰ | 1 | 1 | Isolated | Yes | No |
| PGC 70348 | 345.8153 | 8.8737 | 0.0142 | 49.72* | 2.01 × 10¹⁰ | 1 | 3 | Satellite | No | – | |
| PGC 34883 | 170.5614 | 20.2085 | 0.0173 | 74.64 | 2.11 × 10¹⁰ | 1 | 5 | Satellite | No | – | |
| PGC 72639 | 357.8615 | 20.5862 | 0.0158 | 46.93* | 2.14 × 10¹⁰ | 1 | 1 | Isolated | No | – | |
| NGC 357 | PGC 29855 | 153.5629 | 3.4661 | 0.0041 | 14.62* | 2.21 × 10¹⁰ | 1 | 3 | Satellite | No | – |
| PGC 36907 | 177.2668 | 59.4327 | 0.0121 | 52.13 | 2.17 × 10¹⁰ | 1 | 7 | Satellite | Yes | No | |
| PGC 33371 | 165.7967 | 27.9725 | 0.0075 | 17.87* | 1.84 × 10¹⁰ | 1 | 2 | BGG | Yes | No | |
| PGC 54110 | 227.3815 | 54.5064 | 0.0122 | 65.03* | 2.04 × 10¹⁰ | 1 | 2 | BGG | Yes | Yes | |
| NGC 7743 | PGC 35440 | 172.5311 | 9.2766 | 0.0038 | 19.79* | 1.59× 10¹⁰ | 1 | 2 | BGG | No | – |
| PGC 39724 | 184.9611 | 29.6147 | 0.0036 | 20.67* | 1.56 × 10¹⁰ | 1 | 15 | Satellite | No | – | |
| PGC 6993 | 28.3054 | 4.1958 | 0.0045 | 19.13 | 1.49 × 10¹⁰ | 1 | 1 | Isolated | Yes | No | |
| PGC 3563 | 14.9171 | 15.3310 | 0.0164 | 71.59* | 2.22 × 10¹⁰ | 1 | 1 | Isolated | Yes | No | |
| NGC 2648 | PGC 70098 | 344.3314 | −1.0490 | 0.0086 | 36.77 | 2.63 × 10¹⁰ | 1 | 1 | Isolated | Yes | No |
| PGC 49604 | 209.2333 | 29.1643 | 0.0101 | 42.86* | 2.59 × 10¹⁰ | 1 | 1 | Isolated | Yes | Yes | |
| PGC 28631 | 148.8900 | 16.4328 | 0.0152 | 56.68* | 2.42 × 10¹⁰ | 1 | 2 | Satellite | No | – | |
| PGC 70118 | 344.5018 | 6.0698 | 0.0141 | 60.98 | 2.49 × 10¹⁰ | 1 | 1 | Isolated | Yes | Yes | |
| NGC 656 | PGC 6982 | 28.2487 | 12.7085 | 0.0135 | 57.97* | 2.33 × 10¹⁰ | 1 | 10 | Satellite | No | – |
| PGC 37497 | 179.0299 | 55.3907 | 0.0208 | 90.32 | 2.60 × 10¹⁰ | 1 | 1 | Isolated | No | – | |
| PGC 23855 | 127.5105 | 21.4885 | 0.0172 | 58.57* | 2.36 × 10¹⁰ | 1 | 3 | Satellite | No | – | |
| PGC 55993 | 236.5682 | 2.4155 | 0.0140 | 39.97* | 2.84 × 10¹⁰ | 1 | 2 | BGG | No | – | |
| NGC 4608 | PGC 43451 | 192.6109 | 25.5008 | 0.0047 | 20.99* | 3.00 × 10¹⁰ | 1 | 3 | BGG | No | – |
| PGC 26008 | 138.3983 | 12.4408 | 0.0185 | 82.43* | 2.86 × 10¹⁰ | 1 | 1 | Isolated | No | – | |
| PGC 31701 | 159.8827 | 5.1075 | 0.0301 | 131.54 | 2.84 × 10¹⁰ | 1 | 1 | Isolated | No | – | |
| PGC 32472 | 162.5900 | 41.4640 | 0.0258 | 112.22 | 3.14 × 10¹⁰ | 1 | 1 | Isolated | No | – | |
| UGC 12800 | PGC 29631 | 152.6664 | 20.0702 | 0.0154 | 60.16* | 3.04 × 10¹⁰ | 1 | 1 | Isolated | No | – |
| PGC 22962 | 122.8462 | 3.6331 | 0.0153 | 66.11 | 2.95 × 10¹⁰ | 1 | 1 | Isolated | Yes | No | |
| PGC 35594 | 173.0900 | 0.8040 | 0.0230 | 99.85 | 3.04 × 10¹⁰ | 1 | 3 | BGG | No | – | |
| PGC 27926 | 146.2379 | 16.7074 | 0.0226 | 97.96 | 3.07 × 10¹⁰ | 1 | 1 | Isolated | Yes | Yes | |
| NGC 4643 | PGC 43074 | 191.5646 | 8.3484 | 0.0243 | 100.43* | 3.73 × 10¹⁰ | 1 | 1 | Isolated | Yes | Yes |
| PGC 45757 | 197.7571 | 29.5783 | 0.0265 | 113.35* | 3.68 × 10¹⁰ | 1 | 2 | Satellite | Yes | No | |
| PGC 45542 | 197.1137 | 28.3206 | 0.0242 | 104.97 | 2.68 × 10¹⁰ | 1 | 136 | Satellite | Yes | Yes | |
| PGC 69449 | 340.0711 | 8.0537 | 0.0229 | 99.59 | 2.62 × 10¹⁰ | 1 | 4 | BGG | Yes | No | |
| NGC 7563 | PGC 49563 | 209.0694 | 47.2356 | 0.0075 | 26.05* | 3.28 × 10¹⁰ | 1 | 1 | Isolated | No | – |
| PGC 70455 | 346.4512 | 3.5451 | 0.0145 | 39.77* | 3.47 × 10¹⁰ | 1 | 3 | BGG | No | – | |
| PGC 49598 | 209.2126 | 37.797 | 0.0120 | 51.59 | 2.30 × 10¹⁰ | 1 | 9 | Satellite | Yes | Yes | |
| PGC 7322 | 29.2408 | −5.4029 | 0.0149 | 64.19 | 3.45 × 10¹⁰ | 1 | 1 | Isolated | Yes | Yes | |
| NGC 2878 | PGC 38288 | 181.3663 | 20.3088 | 0.0271 | 117.99 | 3.29 × 10¹⁰ | 2 | 30 | Satellite | No | – |
| PGC 38338 | 181.4588 | 20.4770 | 0.0252 | 109.54 | 3.29 × 10¹⁰ | 2 | 30 | Satellite | No | – | |
| PGC 26606 | 140.8979 | 24.7616 | 0.0275 | 109.38* | 4.25 × 10¹⁰ | 2 | 4 | BGG | No | – | |
| PGC 26665 | 141.1621 | 56.1296 | 0.0264 | 114.88 | 2.45 × 10¹⁰ | 2 | 1 | Isolated | Yes | Yes | |
| NGC 109 | PGC 52261 | 219.3423 | 36.5678 | 0.0159 | 50.71* | 3.38 × 10¹⁰ | 1 | 7 | Satellite | Yes | No |
| PGC 25225 | 134.7103 | 6.2931 | 0.0153 | 65.80 | 3.41 × 10¹⁰ | 1 | 1 | Isolated | Yes | No | |
| PGC 6633 | 27.1378 | 12.6138 | 0.0165 | 71.28 | 3.52 × 10¹⁰ | 1 | 10 | Satellite | Yes | No | |
| PGC 70819 | 348.7644 | 18.9734 | 0.0151 | 64.94 | 3.26 × 10¹⁰ | 1 | 4 | Satellite | No | – | |
| UGC 1271 | PGC 23630 | 126.3003 | 20.3348 | 0.0168 | 70.20* | 2.80 × 10¹⁰ | 1 | 21 | Satellite | Yes | No |
| PGC 50986 | 214.0995 | 39.5023 | 0.0212 | 92.02 | 3.67 × 10¹⁰ | 1 | 1 | Isolated | Yes | Yes | |
| PGC 24230 | 129.3608 | 40.0355 | 0.0253 | 109.84 | 3.63 × 10¹⁰ | 1 | 4 | Satellite | No | – | |
| PGC 46633 | 200.3463 | 0.3426 | 0.0212 | 63.84* | 3.17 × 10¹⁰ | 1 | 1 | Isolated | No | – | |
| NGC 538 | PGC 44557 | 194.7871 | 37.3103 | 0.0177 | 76.48 | 3.60 × 10¹⁰ | 2 | 2 | Satellite | No | – |
| PGC 38634 | 182.3871 | 17.0142 | 0.0251 | 109.08 | 3.57 × 10¹⁰ | 2 | 4 | Satellite | Yes | No | |
| PGC 33040 | 164.6870 | 59.5107 | 0.0230 | 101.42* | 3.56 × 10¹⁰ | 2 | 1 | Isolated | No | – | |
| PGC 24152 | 128.9521 | 1.7217 | 0.0161 | 53.20* | 2.91 × 10¹⁰ | 2 | 3 | BGG | No | – | |
| NGC 345 | PGC 4906 | 20.3193 | −0.5445 | 0.0157 | 67.85 | 5.07 × 10¹⁰ | 1 | 1 | Isolated | Yes | Yes |
| PGC 47180 | 201.9456 | 17.7789 | 0.0245 | 106.49 | 4.07 × 10¹⁰ | 1 | 1 | Isolated | Yes | No | |
| PGC 23441 | 125.3526 | 19.1477 | 0.0284 | 126.28* | 4.07 × 10¹⁰ | 1 | 1 | Isolated | No | – | |
| PGC 698 | 2.4725 | 25.9238 | 0.0132 | 55.18* | 3.93 × 10¹⁰ | 1 | 2 | BGG | No | – | |
| NGC 4596 | PGC 23993 | 128.3242 | 41.2595 | 0.0243 | 105.57 | 4.18 × 10¹⁰ | 1 | 8 | Satellite | No | – |
| PGC 40490 | 186.3254 | 4.9251 | 0.0064 | 21.73* | 3.75 × 10¹⁰ | 1 | 39 | Satellite | No | – | |
| PGC 42743 | 190.7249 | 20.9897 | 0.0244 | 115.34* | 4.22 × 10¹⁰ | 1 | 1 | Isolated | Yes | Yes | |
| PGC 3486 | 14.5992 | −8.4078 | 0.0128 | 55.19 | 4.46 × 10¹⁰ | 1 | 2 | BGG | No | – | |
| PGC 047732 | PGC 42137 | 189.3377 | 28.2081 | 0.0281 | 124.29* | 4.21 × 10¹⁰ | 2 | 2 | BGG | No | – |
| PGC 71258 | 350.6911 | 29.1379 | 0.0172 | 89.79* | 4.26 × 10¹⁰ | 2 | 5 | Satellite | No | – | |
| PGC 51439 | 216.0316 | 34.8589 | 0.0148 | 63.81 | 4.36 × 10¹⁰ | 2 | 1 | Isolated | No | – | |
| PGC 28984 | 150.2631 | 36.6186 | 0.0240 | 104.24 | 3.93 × 10¹⁰ | 2 | 1 | Isolated | No | – | |
| UGC 8484 | PGC 38271 | 181.3114 | 38.2355 | 0.0257 | 111.76 | 4.47 × 10¹⁰ | 3 | 1 | Isolated | No | – |
| PGC 38441 | 181.7644 | 18.5317 | 0.0268 | 107.39* | 4.00 × 10¹⁰ | 3 | 1 | Isolated | No | – | |
| PGC 53817 | 226.1691 | 12.6335 | 0.0307 | 114.35* | 4.51 × 10¹⁰ | 3 | 1 | Isolated | No | – | |
| PGC 51283 | 215.3047 | 29.9936 | 0.0325 | 123.30* | 4.43 × 10¹⁰ | 3 | 1 | Isolated | No | – | |
| NGC 15 | PGC 366 | 1.3079 | 6.7720 | 0.0189 | 94.16* | 4.21 × 10¹⁰ | 1 | 3 | Satellite | No | – |
| PGC 55243 | 232.4375 | 42.9187 | 0.0194 | 59.56* | 4.59 × 10¹⁰ | 1 | 5 | BGG | Yes | No | |
| PGC 49244 | 208.0347 | 14.1163 | 0.0253 | 91.88* | 4.53 × 10¹⁰ | 1 | 5 | Satellite | No | – | |
| PGC 28452 | 148.1235 | 2.1544 | 0.0197 | 63.54* | 4.30 × 10¹⁰ | 1 | 1 | Isolated | No | – | |
| PGC 070141 | PGC 36436 | 175.8523 | 19.7498 | 0.0231 | 100.09 | 5.07 × 10¹⁰ | 1 | 61 | Satellite | No | – |
| PGC 69780 | 342.2421 | 7.2190 | 0.0226 | 98.01 | 4.87 × 10¹⁰ | 1 | 1 | Isolated | Yes | No | |
| PGC 33012 | 164.6050 | 24.2264 | 0.0241 | 107.39* | 4.77 × 10¹⁰ | 1 | 2 | BGG | No | – | |
| PGC 40768 | 186.7311 | 37.9089 | 0.0247 | 107.19 | 4.70 × 10¹⁰ | 1 | 1 | Isolated | Yes | Yes | |
| UGC 6163 | PGC 44144 | 194.1160 | 26.9875 | 0.0240 | 104.27 | 5.16 × 10¹⁰ | 1 | 136 | Satellite | Yes | No |
| PGC 50042 | 210.7543 | 34.7579 | 0.0145 | 63.04* | 4.95 × 10¹⁰ | 1 | 6 | Satellite | No | – | |
| PGC 40783 | 186.7478 | 22.6395 | 0.0254 | 110.75 | 4.97 × 10¹⁰ | 1 | 1 | Isolated | Yes | Yes | |
| PGC 47953 | 203.9511 | 2.9989 | 0.0243 | 105.44 | 5.10 × 10¹⁰ | 1 | 4 | Satellite | No | – | |
| NGC 3943 | PGC 33126 | 164.9711 | 50.0153 | 0.0276 | 120.22 | 4.97 × 10¹⁰ | 2 | 4 | Satellite | Yes | No |
| PGC 45358 | 196.5720 | 29.0631 | 0.0260 | 110.37* | 5.18 × 10¹⁰ | 2 | 136 | Satellite | No | – | |
| PGC 55601 | 234.1757 | 43.5394 | 0.0198 | 85.74 | 4.88 × 10¹⁰ | 2 | 7 | Satellite | Yes | No | |
| PGC 50750 | 213.1589 | 39.3102 | 0.0271 | 117.96 | 5.25 × 10¹⁰ | 2 | 1 | Isolated | No | – | |
| PGC 067858 | PGC 27666 | 145.3192 | 35.8822 | 0.0251 | 103.41* | 5.16 × 10¹⁰ | 3 | 5 | BGG | No | – |
| PGC 70877 | 349.0029 | 25.5567 | 0.0251 | 109.19 | 4.72 × 10¹⁰ | 3 | 9 | Satellite | No | – | |
| PGC 7259 | 29.0908 | −4.4676 | 0.0161 | 64.43* | 5.05 × 10¹⁰ | 3 | 1 | Isolated | No | – | |
| PGC 51108 | 214.6165 | 12.8830 | 0.0271 | 119.32* | 4.98 × 10¹⁰ | 3 | 1 | Isolated | Yes | No | |
| NGC 7383 | PGC 22445 | 120.0874 | 26.6135 | 0.0284 | 120.31* | 5.15 × 10¹⁰ | 1 | 4 | BGG | Yes | No |
| PGC 40192 | 185.7985 | 6.0722 | 0.0267 | 116.05 | 5.20 × 10¹⁰ | 1 | 2 | BGG | Yes | No | |
| PGC 47961 | 203.9583 | 34.9988 | 0.0270 | 117.57 | 5.08 × 10¹⁰ | 1 | 16 | Satellite | No | – | |
| PGC 31572 | 159.4078 | 37.4557 | 0.0251 | 109.19 | 5.96 × 10¹⁰ | 1 | 3 | Satellite | No | – | |
| NGC 7389 | PGC 38227 | 181.1808 | 31.1772 | 0.0274 | 119.51 | 5.70 × 10¹⁰ | 3 | 2 | BGG | No | – |
| PGC 31729 | 159.9914 | 24.0913 | 0.0236 | 90.48* | 5.66 × 10¹⁰ | 3 | 1 | Isolated | No | – | |
| PGC 70250 | 345.2045 | 26.7409 | 0.0244 | 92.37* | 5.99 × 10¹⁰ | 3 | 9 | Satellite | Yes | No | |
| PGC 37264 | 178.3347 | 20.7516 | 0.0234 | 102.41* | 5.77 × 10¹⁰ | 3 | 18 | Satellite | Yes | No | |
| PGC 029301 | PGC 2331 | 9.7477 | −9.0027 | 0.0185 | 80.01 | 6.27 × 10¹⁰ | 5 | 2 | BGG | No | – |
| PGC 26059 | 138.6555 | 8.1172 | 0.0335 | 146.35 | 6.89 × 10¹⁰ | 5 | 1 | Isolated | No | – | |
| PGC 43504 | 192.7480 | 47.6715 | 0.0313 | 105.40* | 6.13 × 10¹⁰ | 5 | 4 | BGG | No | – | |
| PGC 32078 | 161.2155 | 6.5969 | 0.0307 | 90.68* | 6.52 × 10¹⁰ | 5 | 1 | Isolated | No | – | |
| UGC 12897 | PGC 54861 | 230.5327 | 13.9282 | 0.0320 | 140.05 | 7.52 × 10¹⁰ | 2 | 1 | Isolated | No | – |
| PGC 69172 | 338.5282 | 5.5703 | 0.0132 | 51.52* | 7.13 × 10¹⁰ | 2 | 1 | Isolated | No | – | |
| PGC 51167 | 214.8191 | 26.2986 | 0.0390 | 171.31 | 6.80 × 10¹⁰ | 2 | 4 | Satellite | No | – | |
| PGC 49280 | 208.1112 | 14.4909 | 0.0433 | 190.92 | 6.99 × 10¹⁰ | 2 | 3 | BGG | No | – | |
| NGC 550 | PGC 5628 | 22.6696 | −1.9944 | 0.0180 | 77.93 | 6.99 × 10¹⁰ | 1 | 43 | Satellite | Yes | No |
| PGC 47131 | 201.8202 | 32.0307 | 0.0265 | 154.12* | 7.82 × 10¹⁰ | 1 | 7 | Satellite | Yes | No | |
| PGC 25875 | 137.6652 | 50.3798 | 0.0184 | 79.39 | 6.78 × 10¹⁰ | 1 | 3 | Satellite | Yes | Yes | |
| PGC 2279 | 9.5516 | 2.7286 | 0.0156 | 90.98* | 8.42 × 10¹⁰ | 1 | 16 | Satellite | No | – | |
| NGC 2618 | PGC 354 | 1.2760 | 6.9201 | 0.0184 | 79.25* | 8.47 × 10¹⁰ | 2 | 3 | BGG | No | – |
| PGC 41024 | 187.1235 | 17.0850 | 0.0061 | 20.45* | 8.43 × 10¹⁰ | 2 | 197 | Satellite | No | – | |
| PGC 53508 | 224.6501 | 44.8836 | 0.0374 | 164.15 | 8.45 × 10¹⁰ | 2 | 1 | Isolated | No | – | |
| PGC 916 | 3.4491 | −4.4751 | 0.0346 | 151.44 | 7.80 × 10¹⁰ | 2 | 1 | Isolated | Yes | No | |
| NGC 3527 | PGC 32872 | 164.0645 | 9.7544 | 0.0362 | 158.84 | 8.81 × 10¹⁰ | 1 | 17 | Satellite | No | – |
| PGC 55817 | 235.4758 | 28.1341 | 0.0347 | 125.28* | 8.77 × 10¹⁰ | 1 | 10 | Satellite | Yes | No | |
| PGC 52171 | 218.9405 | 24.7258 | 0.0381 | 167.05 | 8.96 × 10¹⁰ | 1 | 2 | BGG | No | – | |
| PGC 36348 | 175.5989 | 10.2641 | 0.0246 | 143.18* | 8.40 × 10¹⁰ | 1 | 9 | Satellite | No | – |
Notes.1From Bonne et al. (2015)
2*denotes redshift independent distances from NED, collated by Bonne et al. (2015), otherwise these are flow-corrected distances, calculated by Bonne et al. (2015).
3From NASA Sloan Atlas
5Environmental properties from Tully (2015).
6From visual inspection of SDSS images by the authors.
