


Abstract
We present the results of an extensive observational campaign on the nearby Type Ibn SN 2015G, including data from radio through ultraviolet wavelengths. SN 2015G was asymmetric, showing late-time nebular lines redshifted by ∼1000 km s−1. It shared many features with the prototypical SN Ibn 2006jc, including extremely strong He i emission lines and a late-time blue pseudo-continuum. The young SN 2015G showed narrow P-Cygni profiles of He i, but never in its evolution did it show any signature of hydrogen – arguing for a dense, ionized and hydrogen-free circumstellar medium moving outward with a velocity of ∼1000 km s−1 and created by relatively recent mass-loss from the progenitor star. Ultraviolet through infrared observations show that the fading SN 2015G (which was probably discovered some 20 d post-peak) had a spectral energy distribution that was well described by a simple, single-component blackbody. Archival HST images provide upper limits on the luminosity of SN 2015G's progenitor, while non-detections of any luminous radio afterglow and optical non-detections of outbursts over the past two decades provide constraints upon its mass-loss history.
1 INTRODUCTION
A basic understanding of core-collapse supernovae (SNe) as luminous displays marking the collapse of a massive stellar core has been in place for at least half a century (e.g. Colgate & White 1966; Arnett 1971). Remarkably, new observations continue to find extreme examples of the process, some of which test the boundaries of our understanding.
For example, binarity within massive-star populations appears to produce complex and only partially understood diversity in supernova (SN) properties via pre-explosion mass exchange and mass-loss, likely leading to the population of stripped-envelope SNe (Types IIb/Ib/Ic; e.g. Podsiadlowski, Joss & Hsu 1992; Smith et al. 2011; Sana et al. 2012; Shivvers et al. 2017). Evidence is mounting from observations of interacting (Type IIn) SNe that their progenitors undergo extreme episodes of mass-loss shortly before core collapse, creating dense circumstellar material (CSM; see review by Smith 2014), but exactly what mechanism is powering these death throes remains unclear. In some cases, enhanced (eruptive) mass-loss occurs only a few years to decades before core collapse, which may point to instabilities in late nuclear burning phases triggering mass-loss or binary interaction (e.g. Quataert & Shiode 2012; Mauerhan et al. 2013; Margutti et al. 2014; Smith & Arnett 2014).
Connecting the stripped-envelope and interacting SN populations are the rare Type Ibn SNe (e.g. Matheson et al. 2000; Foley et al. 2007; Pastorello et al. 2008a). These core-collapse SNe exhibit the narrow spectral emission lines characteristic of an ionized CSM and other key indications of dense CSM (e.g. Chugai 2009); however, spectra of SNe Ibn show little or no hydrogen emission and instead are dominated by strong helium emission lines (most notably He i λλ5876, 6678 and 7065). Weak-hydrogen examples also exist as intermediate Type IIn/Ibn SNe (e.g. Pastorello et al. 2008b; Smith et al. 2012; Pastorello et al. 2015a), and there are a few known examples of hydrogen-weak explosions (Type Ib SNe) which then interacted with shells of hydrogen-rich material lost by the progenitor tens to thousands of years before core collapse (e.g. SNe 2001em and 2014C; Chugai & Chevalier 2006; Milisavljevic et al. 2015; Margutti et al. 2017).
Only about 25 SNe Ibn are known at this time, and the properties of this subclass are just beginning to be mapped out (e.g. Sanders et al. 2013; Pastorello et al. 2016; Shivvers et al. 2016; Hosseinzadeh et al. 2017). SN 2015G, which exploded in the outskirts of NGC 6951 at a distance of 23.2 Mpc, is one of the nearest known SN Ibn to date; as such, it has allowed us the opportunity to study a member of this rare subclass in detail. NGC 6951 has also hosted two other SNe in the past few decades: SN IIn 1999el (Di Carlo et al. 2002) and SN Ia 2000E (Vinkó et al. 2001; Valentini et al. 2003). In this paper, we present the results of an extensive observational campaign on SN 2015G, from radio wavelengths to the ultraviolet (UV) and spanning nearly a year of follow-up observations. In Section 2, we present our observations, in Section 3 we put those data into context and calculate the implied physical properties of the system and in Section 4, we summarize and conclude.
2 OBSERVATIONS
SN 2015G was discovered by Kunihiro Shima at 15.5 mag (unfiltered) on 2015-03-23.778 (we use ut dates and times throughout this article) and spectroscopically classified as a SN Ibn, similar to SN 2006jc, 3 d afterward (Yusa et al. 2015; Foley et al. 2015). We initiated a photometric and spectroscopic follow-up effort for SN 2015G as soon as its nature as a nearby example of the rare Type Ibn subclass was understood. From the ground, this campaign included a regular cadence of imaging through BVRI filters, a detailed spectroscopic follow-up campaign at both low and moderate resolution, two epochs of near-IR imaging (J, H and Ks filters) and three epochs of radio-wavelength observations. We also obtained multiple epochs of space-based UV imaging with Swift and with the Hubble Space Telescope (HST), three epochs of HST UV spectroscopy and two epochs of HST optical imaging. Though some of these observations produced only non-detections, the combination of detections and upper limits forms an extensive data set on SN 2015G.
Unfortunately, we did not catch SN 2015G before it reached peak brightness – comparisons between the early unfiltered amateur photometry and ours (beginning 4 d later) indicate that the SN was already on the decline at the time of discovery. Because the peak was unobserved, throughout this paper we refer to the time since the discovery date as the phase of SN 2015G.
2.1 Ultraviolet through infrared imaging
Filtered BVRI and unfiltered observations of SN 2015G were obtained with the 0.76 m Katzman Automatic Imaging Telescope (KAIT; Filippenko et al. 2001) at Lick Observatory nearly nightly from days 4 through 37. As the SN faded below KAIT's detection threshold, we began a campaign with the Direct Imaging Camera on the Lick 1 m Nickel telescope. We maintained a regular observing cadence until day 155, at which point SN 2015G faded below our Nickel detection threshold in both the B and V passbands.
Our images were reduced using a custom pipeline, as discussed by Ganeshalingam et al. (2010). Host-galaxy template subtractions were performed with additional images obtained on 2016 July 12 (day 477), after the SN had faded below the detection threshold of our telescopes. Point spread -function (PSF) photometry was performed with the daophot package (Stetson 1987) in the idl Astronomy User's Library.1 Nearby reference stars in our images were calibrated to the APASS2 catalogue, which we transform to the Landolt system3 and then to the KAIT4 natural systems using the colour terms and equations as calculated by Ganeshalingam et al. (2010), Ganeshalingam, Li & Filippenko (2013). As the Nickel camera has aged, our best-fitting colour terms for the above transformation have changed; we correct the data published here with updated Nickel colour terms recalculated in 2016 (CB = 0.041, CV = 0.082, CR = 0.092, CI = −0.043).
Table 1 presents our photometry of SN 2015G within the natural photometric systems of KAIT4/Nickel. Because our observations show a significant gap in the bluer passbands, after the SN dropped below the sensitivity limits for KAIT in those passbands but before we began our campaign with the larger Nickel telescope, we do not convert these data into a standard photometric system. Ganeshalingam et al. (2010) and Ganeshalingam et al. (2013) provide the colour terms and equations required to perform this conversion, but doing so at all phases would require interpolating the evolution in the bluer passbands, so we provide only the natural photometry and leave any conversion (required for detailed comparisons with observations from other instruments) to future work.
Table of photometric observations.
| Date (ut) | MJD | Phase (d) | Magnitude | Passband | Telescope |
|---|---|---|---|---|---|
| 2015-03-27.51 | 57108.51 | 3.74 | 17.07 ± 0.07 | B | KAIT |
| 2015-03-27.51 | 57108.51 | 3.74 | 16.61 ± 0.04 | V | KAIT |
| 2015-03-27.51 | 57108.51 | 3.74 | 16.20 ± 0.03 | R | KAIT |
| 2015-03-27.51 | 57108.51 | 3.74 | 15.81 ± 0.04 | I | KAIT |
| 2015-03-28.53 | 57109.53 | 4.75 | 17.17 ± 0.08 | B | KAIT |
| 2015-03-28.53 | 57109.53 | 4.75 | 16.71 ± 0.04 | V | KAIT |
| 2015-03-28.53 | 57109.53 | 4.75 | 16.30 ± 0.03 | R | KAIT |
| 2015-03-28.53 | 57109.53 | 4.75 | 15.86 ± 0.04 | I | KAIT |
| 2015-03-29.54 | 57110.54 | 5.76 | 17.25 ± 0.15 | B | KAIT |
| 2015-03-29.54 | 57110.54 | 5.76 | 16.77 ± 0.08 | V | KAIT |
| 2015-03-29.54 | 57110.54 | 5.77 | 16.40 ± 0.05 | R | KAIT |
| 2015-03-29.54 | 57110.54 | 5.77 | 15.94 ± 0.08 | I | KAIT |
| 2015-03-30.52 | 57111.52 | 6.74 | 17.63 ± 0.02 | B | Nickel |
| 2015-03-30.52 | 57111.52 | 6.74 | 16.94 ± 0.01 | V | Nickel |
| 2015-03-30.53 | 57111.53 | 6.75 | 16.44 ± 0.01 | R | Nickel |
| 2015-03-30.53 | 57111.53 | 6.75 | 15.99 ± 0.01 | I | Nickel |
| 2015-03-31.53 | 57112.53 | 7.76 | 17.63 ± 0.21 | B | KAIT |
| 2015-03-31.54 | 57112.54 | 7.76 | 17.10 ± 0.07 | V | KAIT |
| 2015-03-31.54 | 57112.54 | 7.76 | 16.61 ± 0.05 | R | KAIT |
| 2015-03-31.54 | 57112.54 | 7.76 | 16.09 ± 0.06 | I | KAIT |
Truncated; full table available digitally.
Infrared (IR) imaging through the J, H and Ks filters was obtained 18 and 35 d after discovery with the Wisconsin–Indiana–Yale–NOAO (WIYN) 3.5 m telescope using the WIYN High-Resolution Infrared Camera (WHIRC; Meixner et al. 2008). SN 2015G was clearly detected in all three bands at both epochs. The raw images were processed using the methods described by Weyant et al. (2014) to construct the combined stacked images for each visit. We used source extractor to obtain aperture photometry, and we calculate photometric zero-points for these data by cross-matching field stars with the Two Micron All Sky Survey catalogue (2MASS; Skrutskie et al. 2006). We do not correct for any colour differences between the WIYN+WHIRC and 2MASS systems.
The Ultraviolet/Optical Telescope (UVOT; Roming et al. 2005) mounted on the Swift satellite (Gehrels et al. 2004) was used to observe the field of SN 2015G regularly from day 12 through day 30. Photometric reduction for these data was performed with the pipeline for the Swift Optical Ultraviolet Supernova Archive (SOUSA; Brown et al. 2014). For each of these images, a 5 arcsec aperture is used to measure the counts for the coincidence loss correction, and a 3 or 5 arcsec source aperture (depending on the uncertainty from above) was used for the photometry after subtracting off the galaxy count rate in a template image. We apply aperture corrections (based on the average PSF in the Swift CALDB), zero-point corrections, and time-dependent sensitivity loss corrections to place the magnitudes on the UVOT photometric system as described by Poole et al. (2008) and Breeveld et al. (2011). Most of these observations produced non-detections of SN 2015G, which prove useful in constraining the luminosity of SN 2015G at UV wavelengths.
The HST and its Wide Field Camera 3 (WFC3) was used to obtain optical images of SN 2015G through the F555W band on day 20 and the F555W and F814W bands on day 247, as part of programs GO-14149 (PI: A. Filippenko) and GO-13683 (PI: S. Van Dyk).4 We also examined pre-explosion HST observations of the SN 2015G explosion site obtained in 2001 through the F555W and F814W filters with the Wide-Field Planetary Camera 2 (WFPC2) as part of the campaign to monitor SN 1999el (GO-8602 with PI: A. Filippenko; see Li et al. 2002). All of these images were obtained from the HST Archive after standard pipeline processing. We performed photometry on these images using dolphot (Dolphin 2000). The dolphot parameters FitSky and RAper were set to 3 and 8 (respectively), appropriate for crowded galactic environments, and we set InterpPSFlib=1, implemented with the tinytim PSF library (Krist, Hook & Stoehr 2011).
The above data are presented in Table 1 and shown in Fig. 1. Values in the table are given as observed, without applying any dust reddening corrections. Note that the error bars for our photometry are statistical only, not accounting for systematic errors accrued (for example) during host-galaxy template subtraction; this may account for the larger than expected dispersion among some of the data points. Additional UV-wavelength non-detections were obtained with Swift; we list only those relevant for this work.
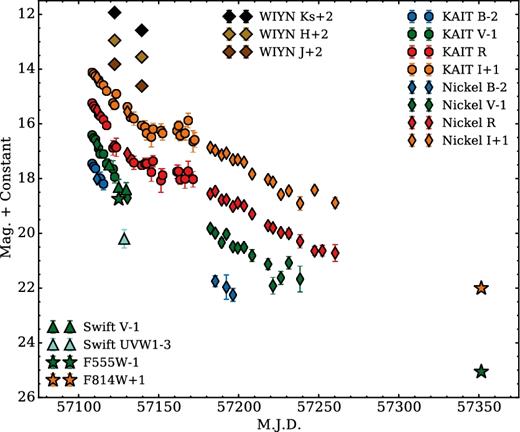
Our photometry of SN 2015G, from UV through IR wavelengths. All data are shown after correcting for extinction arising from dust within the Milky Way Galaxy and the SN host galaxy (see Section 3.1).
2.2 Radio
We obtained three epochs of observations on SN 2015G using the Janksy Very Large Array (VLA), in 2015 April, May and July, all of which were non-detections producing upper limits on the radio flux from the SN.
All data were taken in the standard continuum-observing mode with a bandwidth of 16 × 64 × 2 MHz. The VLA underwent a few configuration changes at various stages during these observations. During the data reductions, we split the data into two side bands of approximately 1 GHz each, centred on 4.8 and 7.1 GHz. We used the radio source 3C286 for flux calibration, and calibrator J2022+6136 for phase referencing. Data were reduced using standard packages within the Astronomical Image Processing System. No radio emission was detected from SN 2015G in any of these observations, resulting in the deep flux limits summarized in Table 2.
Table of radio observations.
| Date | MJD | Phase | Frequency | 3σ rms | VLA |
|---|---|---|---|---|---|
| (ut) | (d) | (GHz) | (μJy) | configuration | |
| 2015-04-04.42 | 57116.42 | 11.64 | 4.8 | <36.6 | B |
| 2015-04-04.42 | 57116.42 | 11.64 | 7.1 | <34.8 | B |
| 2015-05-14.37 | 57156.37 | 51.59 | 4.8 | <32.1 | BnA |
| 2015-05-14.37 | 57156.37 | 51.59 | 7.1 | <37.8 | BnA |
| 2015-07-25.19 | 57228.19 | 123.41 | 4.8 | <40.5 | A |
| 2015-97-25.19 | 57228.19 | 123.41 | 7.1 | <29.8 | A |
2.3 Ultraviolet and optical spectra
Regular optical spectra of SN 2015G were obtained with the Kast Double Spectrograph mounted on the 3 m Shane telescope (Miller & Stone 1993) at Lick Observatory, starting day 3 (see Foley et al. 2015) and continuing until the SN was too faint for Kast. A single observation was taken with Kast in the spectropolarimetric mode, on day 4; the details of our spectropolarimetric observing techniques are described by Mauerhan et al. (2015) and Shivvers et al. (2016). During the same time period we obtained additional spectra with the Boller & Chivens Spectrograph mounted on the 2.3 m Bok Telescope and the Spectrograph for the Rapid Acquisition of Transients (SPRAT; Piascik et al. 2014) mounted on the 2.0 m Liverpool Telescope. With these telescopes, we were able to maintain a cadence between observations of 1 week or less for the first 2 months of SN 2015G's evolution.
Several additional optical spectra were obtained after the SN had significantly faded using the DEep Imaging Multi-Object Spectrograph (DEIMOS; Faber et al. 2003) and the Low-Resolution Imaging Spectrometer (LRIS; Oke et al. 1995; Rockosi et al. 2010) mounted on the Keck 10 m telescopes, the Multi-Object Double Spectrograph (MODS; Byard & O'Brien 2000) mounted on the 8.4 m Large Binocular Telescope (LBT) and the Bluechannel spectrograph on the 6.5 m Multiple Mirror Telescope (MMT), extending our spectroscopic sequence out until 16 September, some 6 months after SN 2015G was discovered.
All ground-based spectra were observed at the parallactic angle to minimize slit losses from atmospheric refraction (Filippenko 1982). We reduced and calibrated our Keck and Lick observations following the procedures detailed by Silverman et al. (2012), utilizing iraf5 routines and custom python and idl codes.6 For all Arizona facility telescopes (Bok, LBT, MMT), we performed standard reductions in iraf. We use the standard reductions of SPRAT data as provided by the Liverpool automated pipeline. All data were flux calibrated via spectrophotometric standards observed through an airmass similar to that of SN 2015G, each night. We performed the spectropolarimetric reduction in the manner described by Mauerhan et al. (2015, and references therein), producing the reduced polarimetric parameters of q and u (Stokes parameters), P (debiased polarization) and θ (sky position angle).
As part of program GO-13797, we obtained three epochs of HST/Space Telescope Imaging Spectrograph (STIS) spectroscopy of SN 2015G (on 2015 April 4, 11 and 20) covering UV through near-IR wavelengths. We use the reduced spectra as provided by the Space Telescope Science Data Analysis System pipeline.
Table 3 lists our spectra, and Fig. 2 illustrates the spectral evolution of SN 2015G. All spectra will be made available for download through WISeREP7 (Yaron & Gal-Yam 2012), the Open Supernova Catalog8 (Guillochon et al. 2017) and the UC Berkeley Supernova Database9 ( Silverman et al. 2012).
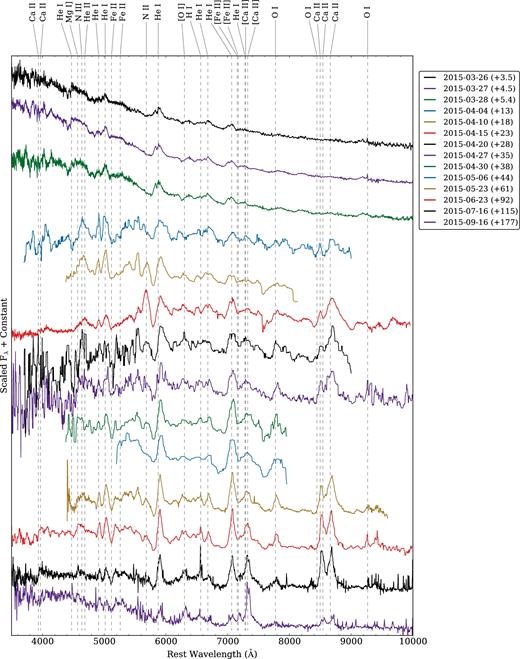
Subset of the observed spectral series, showing only the higher SNR spectra for clarity. Our complete spectral data set is listed in Table 3. Data have been corrected for dust absorption along the line of sight and are presented in the host galaxy's rest frame, and in the legend we state both the ut date of observation and the days since discovery. For some of the later epochs, we plot coadditions of multiple spectra to increase the SNR, and we label these coadditions with the mean date. Spectra at phases >10 d have been smoothed via a moving window median or convolution with a Gaussian kernel. All line labels are plotted at the rest wavelength of the line (v = 0 km s−1).
Journal of spectroscopic observations.
| Date | MJD | Phase | Tel./Inst. | Wavelength | Resolution |
|---|---|---|---|---|---|
| (ut) | (d) | (Å) | (Å) | ||
| 2015-03-26.51 | 57107.51 | 2.73 | Shane/Kast | 3450–10 860 | 10 |
| 2015-03-27.50 | 57108.50 | 3.72 | Bok/B&C | 6190–7350 | 2 |
| 2015-03-27.44 | 57108.44 | 3.66 | Bok/B&C | 4400–8170 | 10 |
| 2015-03-27.50 | 57108.50 | 3.72 | Shane/Kast | 3450–10 880 | 10 |
| 2015-03-28.46 | 57109.46 | 4.68 | Shane/Kast | 3460–10 850 | 10 |
| 2015-03-28.48 | 57109.48 | 4.70 | Shane/Kast | 3450–7960 | 6 |
| 2015-03-28.50 | 57109.50 | 4.72 | Shane/Kast (SpecPol) | 4550–9940 | 10 |
| 2015-04-04.64 | 57116.64 | 11.86 | HST/STIS/MAMA | 1570–10 230 | 10 |
| 2015-04-10.49 | 57122.49 | 17.71 | Bok/B&C | 5700–6870 | 2 |
| 2015-04-10.43 | 57122.43 | 17.65 | Bok/B&C | 4400–8170 | 10 |
| 2015-04-10.21 | 57122.21 | 17.43 | Liverpool/SPRAT | 4010–7950 | 18 |
| 2015-04-11.50 | 57123.50 | 18.72 | HST/STIS/MAMA | 1570–10 230 | 10 |
| 2015-04-12.16 | 57124.16 | 19.38 | Liverpool/SPRAT | 4010–7950 | 18 |
| 2015-04-15.44 | 57127.44 | 22.66 | LBT/MODS | 3500–10 000 | 7 |
| 2015-04-16.49 | 57128.49 | 23.71 | Shane/Kast | 3450–10 860 | 10 |
| 2015-04-18.19 | 57130.19 | 25.41 | Liverpool/SPRAT | 4010–7950 | 18 |
| 2015-04-19.52 | 57131.52 | 26.74 | Shane/Kast | 5000–10 000 | 10 |
| 2015-04-20.31 | 57132.31 | 27.53 | HST/STIS/MAMA | 1570–10 230 | 10 |
| 2015-04-27.43 | 57139.43 | 34.65 | Shane/Kast | 3500–10 500 | 10 |
| 2015-04-28.43 | 57140.43 | 35.65 | Bok/B&C | 4400–8060 | 10 |
| 2015-04-28.09 | 57140.09 | 35.31 | Liverpool/SPRAT | 4000–7950 | 18 |
| 2015-04-30.38 | 57142.38 | 37.60 | MMT/Blue Channel | 5710–7000 | 2 |
| 2015-04-30.12 | 57142.12 | 37.34 | Liverpool/SPRAT | 4020–7990 | 18 |
| 2015-05-02.15 | 57144.15 | 39.37 | Liverpool/SPRAT | 4020–7990 | 18 |
| 2015-05-06.12 | 57148.12 | 43.34 | Liverpool/SPRAT | 4020–7990 | 18 |
| 2015-05-09.09 | 57151.09 | 46.31 | Liverpool/SPRAT | 4020–7990 | 18 |
| 2015-05-11.18 | 57153.18 | 48.40 | Liverpool/SPRAT | 4020–7990 | 18 |
| 2015-05-14.17 | 57156.17 | 51.39 | Liverpool/SPRAT | 4000–7960 | 18 |
| 2015-05-20.56 | 57162.56 | 57.78 | Keck-2/DEIMOS | 4410–9640 | 4 |
| 2015-05-26.48 | 57168.48 | 63.70 | Shane/Kast | 3460–10 880 | 10 |
| 2015-06-22.43 | 57195.43 | 90.65 | Shane/Kast | 3440–10 860 | 10 |
| 2015-06-23.47 | 57196.47 | 91.69 | Shane/Kast | 3450–10 850 | 10 |
| 2015-06-24.46 | 57197.46 | 92.68 | Shane/Kast | 3440–10 860 | 10 |
| 2015-07-16.53 | 57219.53 | 114.75 | Keck-1/LRIS | 3100–10 330 | 7 |
| 2015-07-20.37 | 57223.37 | 118.59 | Shane/Kast | 3430–10 820 | 10 |
| 2015-08-12.32 | 57246.32 | 141.54 | Shane/Kast | 3420–10 830 | 10 |
| 2015-09-16.38 | 57281.38 | 176.60 | Keck-1/LRIS | 3560–10 320 | 7 |
3 ANALYSIS
We analyse all data in the rest frame of the host galaxy NGC 6951, adopting z = 0.00475 ± 0.000005 (Haynes et al. 1998) and a distance of μ = 31.83 (23.2 Mpc) – the median of 17 distances to NGC 6951 as reported in the NASA Extragalactic Database (NED10). Note that there is a large spread in distance estimates for NGC 6951 reported in NED, ranging from 33.0 down to 16.2 Mpc (determined via SN Ia and Tully–Fisher methods, respectively; Vinkó et al. 2001; Sorce et al. 2014). Before our analysis, we correct for absorption arising from dust both within our Milky Way Galaxy and within NGC 6951.
3.1 Line-of-sight extinction
SN 2015G lies behind a moderate amount of dust extinction arising from the intestellar medium (ISM) within the Milky Way (MW): E(B − V)MW = 0.3189 mag (Schlafly & Finkbeiner 2011). In our spectra that exhibit sufficient signal-to-noise ratio (SNR) and resolution, we observe an Na i D absorption doublet from gas within the MW, as well as Na i D from gas within the host galaxy NGC 6951. These absorption features fall on the blue edge of SN 2015G's He i λ5876 emission line (see Fig. 3).
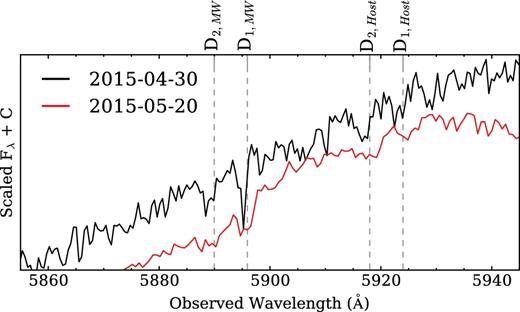
Na i D absorption lines observed in two of our higher resolution spectra of SN 2015G, with the wavelengths of the doublet indicated in the Milky Way rest frame and in the rest frame of the host, NGC 6951.
We use these sodium doublets to estimate the extinction towards SN 2015G arising within the host galaxy. We measure the equivalent widths of the (separately resolved) D1 and D2 lines in both the MMT spectrum from May 30 and the Keck spectrum from June 20, averaging multiple measurements from both spectra. We obtain 0.20 ± 0.06 and 0.37 ± 0.02 Å for D1 and D2, respectively. Assuming the dust and gas properties within NGC 6951 are well approximated by their properties within the MW (RV = 3.1), we use the relations of Poznanski, Prochaska & Bloom (2012) to infer E(B − V) = 0.053 ± 0.028 mag (using the D1 line) and E(B − V) = 0.076 ± 0.028 mag (using the D2 line).
Given these measures, we estimate that NGC 6951 contributes E(B − V) ≈ 0.065 mag, for a total line-of-sight dust reddening of E(B − V) ≈ 0.384 mag. Our major results are not dependent upon the exact level of dust reddening, and we caution that our calculation of the internal host galaxy's reddening is only an estimate; the line-of-sight Na i D and dust within the hosts of some previous SNe have been observed to be dissimilar from those of the MW (e.g. Phillips et al. 2013; Shivvers et al. 2016).
3.2 SN 2015G's spectral evolution
Fig. 2 illustrates the spectral evolution of SN 2015G. Hosseinzadeh et al. (2017) present four other spectra, providing additional coverage of the SN evolution between days 18 and 40. The early-time spectra of SN 2015G show the signatures observed in many young and intermediate-age SNe Ibn (e.g. Foley et al. 2007; Pastorello et al. 2008a; Hosseinzadeh et al. 2017). They have a strong continuum and relatively narrow P-Cygni helium lines (absorption minima blueshifted by ∼1000 km s−1) atop broader emission. By our third epoch of spectroscopy (+5 d), the broader emission lines formed a blueshifted absorption component, transforming into a P-Cygni line profile with absorption minima blueshifted by ∼8000 km s−1. These broader P-Cygni lines persisted throughout the photospheric phase and into the nebular phase, at which point the continuum had faded and the P-Cygni absorption components had disappeared, leaving behind the emission lines of helium and calcium which dominate our spectra out to the last observations.
SN 2015G's spectral features undergo a remarkable wavelength evolution over the course of our campaign, implying a similarly remarkable change in the velocity of the material contributing most to those features. Fig. 4 shows this evolution for two He i lines (including He i λ5876, though the Na i D doublet may also affect this region), for the forbidden doublet of [Ca ii] λλ7291, 7324 (which only becomes apparent starting ∼100 d, but is prominent at late phases), and for the Ca ii λλ8498, 8542, 8662 near-IR triplet.
![Evolution of He i, [Ca ii] and Ca ii lines in velocity space. All late-time lines are strongly offset redward from 0 km s−1, most clearly the Ca ii. Note that we calculate velocities in both calcium panels relative to the blue-most line in each blend. Also note that the Na i D doublet may affect the He i λ5876 profile – we have marked the position of this doublet in the left-most panel with dotted grey lines. Our best-fitting line profiles of calcium features in the last spectrum are shown overlying that spectrum on the bottom, with the profile components shown below in grey.](https://oup.silverchair-cdn.com/oup/backfile/Content_public/Journal/mnras/471/4/10.1093_mnras_stx1885/1/m_stx1885fig4.jpeg?Expires=1716406916&Signature=CjBgnVexx7Pl3mHlSyEPEpC0KnSWA18eRJTAEf2rN9bbcF3Vusxw1Q1cawNEljFyhWT6M4HdX5wOHe1kxLLYTvFh0Z7EbrD4OPPBFkSC~qYFWoFDUDCQDMj5AUd2hLz4Cfc3dK3tzwhAB-uuxpCBNtSGGbpINnHNXf-7m1zqDu1DxQEm2EQeKjJZdRJ2ssHexZ3uAN67wTXyKSBR9QbtdxeZQ1hj1iZAa58MbiU-ZGn1N3SbHQ9CtdzlXYR~W962s6aK92cGnduWbebwopnNQYObTF0zzUTIEDpJ-cmk5lanzX2OgXCX53tbsn7EUVs7QIGNPPCQJvokddmxOnf9Hw__&Key-Pair-Id=APKAIE5G5CRDK6RD3PGA)
Evolution of He i, [Ca ii] and Ca ii lines in velocity space. All late-time lines are strongly offset redward from 0 km s−1, most clearly the Ca ii. Note that we calculate velocities in both calcium panels relative to the blue-most line in each blend. Also note that the Na i D doublet may affect the He i λ5876 profile – we have marked the position of this doublet in the left-most panel with dotted grey lines. Our best-fitting line profiles of calcium features in the last spectrum are shown overlying that spectrum on the bottom, with the profile components shown below in grey.
In the He i features, we see early P-Cygni absorption around −1000 km s−1 sitting atop broader emission lines with widths of ∼5000 km s−1. Both the narrow and broad profiles at first show emission components centred near velocity v = 0 km s−1. By ∼10 d, the major lines at wavelengths λ ≲ 6500 Å (where the continuum is strongest) show broad, blueshifted P-Cygni absorption, as is normal in SN spectra. By ∼20 d time the narrow P-Cygni features have faded from our spectra.
The SN then progresses towards the nebular phase and the continuum drops away below the emission lines. As it does so, the peaks of those emission lines clearly trend redward through our final observation. We model the near-IR calcium triplet in our last spectrum (+177 d) to measure its implied Doppler velocity. Our model consists of three Gaussian profiles separated by the triplet's intrinsic spacings and forced to have the same width, and we fit it to the data via Monte Carlo Markov Chain (MCMC) maximum-likelihood methods. Our best-fitting profile is shown at the bottom right of Fig. 4, and we find a velocity offset of ∼1000 km s−1 receding (relative to the host-galaxy rest frame) and a full width at half-maximum intensity (FWHM) of ∼1400 km s−1 (for each component line in the triplet). The forbidden calcium doublet can also be fit quite well by a doublet profile with an offset velocity forced to match that of the near-IR triplet, though we were required to allow the two components of the doublet to exhibit different FWHMs; perhaps the He i λ7281 line and the [O ii] λ7320 blend contribute some flux to the feature.
3.3 Comparisons with other SNe
Fig. 5 shows spectra of SN 2015G compared to those of a few other SNe Ibn and normal SNe Ib, with early-time spectra plotted on the left, late-time spectra on the right, and those taken at intermediate ages in the middle. We ran our +5 d spectrum of SN 2015G through the SuperNova Identification code (SNID; Blondin & Tonry 2007) with the updated template sets of Silverman et al. (2012) and Liu & Modjaz (2014). Note that none of these template sets includes SN Ibn spectra, but SNID identified the +27 d SN Ib 2007C spectrum as a reasonable match. Broad features arising from many of the same ions are apparent in both SNe, though of course the SN 2007C spectrum (which is reasonably characteristic of normal SN Ib spectra at photospheric phases) does not exhibit the strong blue continuum and narrow emission features of SNe Ibn. The presence of a similar set of broad features between these two SNe suggests that SN 2015G could have been a relatively normal SN Ib if its dense CSM were not present.
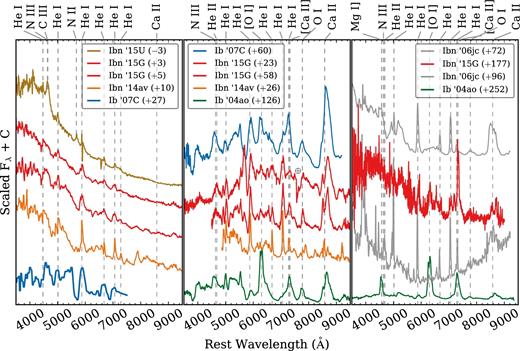
The spectra of SN 2015G at early, middling and nebular phases (left-hand, middle and right-hand panel, respectively). We compare to spectra of SNe Ibn 2006jc, 2014av and 2015U (Foley et al. 2007; Smith, Foley & Filippenko 2008; Pastorello et al. 2016; Shivvers et al. 2016) to the SN Ib 2007C SNID template presented by Liu & Modjaz (2014) along with previously unpublished spectra of the event, and to previously unpublished spectra of SN Ib 2004ao. For each SN, spectra are presented in the SN rest frame and have been corrected for dust reddening along the line of sight. The phases of the spectra are given in days after discovery for SNe 2004ao, 2006jc and 2015G, and days after optical peak for SNe 2007C, 2014av and 2015U. All line labels are plotted at the rest wavelength of the line (v = 0 km s−1).
The pre-maximum spectrum of SN 2015U showed emission lines of N ii λλ5680, 5686 and N iii λλ4634, 4642/C iii λ4647 (Pastorello et al. 2015c; Shivvers et al. 2016). Neither of these is apparent in our early spectra of SN 2015G. However, probable N ii λλ5680, 5686 and N iii λλ4634, 4642 emission features do become prominent by day 23 (see Fig. 2).
During its transition from the photospheric phase to the nebular (see the middle panel of Fig. 5), SN 2015G followed an evolution not so dissimilar from that of normal SNe Ib, as the previously dominant continuum faded away to leave only the nebular emission lines behind. However, the ‘broad’ nebular features of SN 2015G are less broad than those shown by normal SNe Ib throughout, and the strong He i emission lines of SN 2015G do not appear in normal SN Ib spectra. A similar spectral evolution, starting with a strong blue continuum topped by narrow features and ending with the nebular emission features commonly observed in normal SNe Ib, has been seen in several SNe Ibn (e.g. SN 2010al and ASASSN-15ed, both of which share many similarities with SN 2015G; Pastorello et al. 2015a,b).
This strong He i emission is usually interpreted as a result of ongoing interaction between the outer layers of the ejecta and a helium-rich CSM (e.g. Matheson et al. 2000). Because the excitation energy of He i is so large, thermal excitation in the freely expanding and cooling SN ejecta cannot account for features like these. Instead, the ongoing shock between the ejecta and the helium-rich CSM is usually invoked to explain the strong helium lines in SNe Ibn. Normal SNe Ib, which show strong He i absorption lines at peak but no nebular He i emission lines, are often argued to arise via a different process: ‘mixed’ SNe (e.g. Lucy 1991). In this scenario, radioactive nickel is mixed well out into the helium envelope and the γ-rays from the decay process are therefore able to excite the helium non-thermally.
Hosseinzadeh et al. (2017) propose the existence of two spectroscopic subclasses of SNe Ibn: those that show narrow (v ≈ 1000 km s−1) He i P-Cygni features within ∼20 d of peak and those that do not. They group SNe 2015G and 2015U into the first class and SN 2006jc into the second. SN 2014av (also shown in Fig. 5) they label as uncertain. The spectra presented here show that the similarities between SNe 2015G and 2006jc are manyfold and robust while also confirming that SN 2015G did show narrow P-Cygni He i lines at early phases.
This adds evidence to the argument that either SNe Ibn exhibit a continuum of spectral properties between the two extremes of the Hosseinzadeh et al. (2017) subclasses, or that the issue of interest is not the presence or absence of narrow P-Cygni lines but instead their longevity or our viewing angle. Perhaps all SNe Ibn show these features but they quickly disappear from the spectra of SN 2006jc-like events, as those authors speculate, or perhaps SNe Ibn often exhibit strong asymmetries (in their CSM distributions or in their explosions) and the narrow lines are only apparent from certain perspectives.
SN 2015G exhibited much stronger calcium (both allowed and forbidden) than did SN 2014av, though comparisons to SN 2006jc indicate that the strength of these calcium features are quite variable among different SNe Ibn. As the SNe Ibn shown in Fig. 5 enter the nebular phase, their [O i] λλ6300, 6364 emission lines are weak compared to those of normal SNe Ib. The [O i] line strengths of SN 2015G are between those of the very oxygen-weak SN 2006jc and the oxygen-strong (normal) Type Ib SN 2004ao, at both mid-nebular and fully nebular phases.
As SN 2015G aged a blue continuum became apparent, similar to those observed in the Type Ibn SNe 1999cq and 2006jc (Matheson et al. 2000; Foley et al. 2007) and the transitional IIn/Ibn SN 2011hw (Smith et al. 2012), and visible in the right-hand panel of Fig. 5. The late-time blue continua of SNe 1999cq and 2006jc were attributed to a forest of blended Fe ii lines; we believe the same process to be at work in the SN 2015G system. The density of features at these wavelengths makes individual lines difficult to isolate, but we identify clear Fe ii features by comparing our April 15 spectrum to synthetic models calculated with SYN++ (Fisher 2000; Thomas, Nugent & Meza 2011). We are unable to converge upon a SYN++ model that reproduces all of the major spectral features, most especially the strong He i emission, but our best-fitting model does argue for significant near-UV line blanketing from iron as well as multiple overlapping absorption features in the blue, the two most obvious and isolated of which are indicated in Fig. 2.
This blue pseudo-continuum arose later in SN 2015G's evolution than it did for SN 2006jc. Though the peak dates of both SNe passed by unobserved, the relative strengths of the Ca ii and [Ca ii] lines, as well as the O i and [O i] features, provide another indicator of the age. As the SN aged, forbidden emission lines became prominent while those lines arising from allowed transitions faded. The right-most panel of Fig. 5 shows that the blue pseudo-continuum of SN 2006jc formed while the near-IR triplet of Ca ii was strong, but the blue pseudo-continuum of SN 2015G did not become apparent until the near-IR triplet had faded and [Ca ii] emission had become dominant (see also Fig. 2). This enhanced blue continuum is generally understood to arise via non-thermal excitation of iron via an ongoing shock as ejecta collide with CSM (e.g. Foley et al. 2007), and normal SNe Ib do not show it.
SN 2006jc, at extremely late phases, developed a red/near-IR continuum as dust formed in the shocked shell of material created by the SN ejecta's collision with the CSM (Smith et al. 2008; Sakon et al. 2009). This red continuum is apparent in the +96 d spectrum of SN 2006jc; our spectra of SN 2015G show that no such late-time red continuum formed in SN 2015G during our 6 months of spectroscopic follow-up observations.
Interestingly, Smith et al. (2008) identified transient He ii λ4686 and N iii λλ4634, 4642 emission with the rise of the red hot dust continuum of SN 2006jc, tying these phenomena to observations of the colliding winds in η Carinae (Smith 2010). The middle and right-hand panels of Fig. 5 show that the same transient emission feature of ionized helium and nitrogen was temporarily present in SN 2015G but at a much earlier phase, and it does not appear to be associated with the formation of dust in this event. Perhaps dust was able to form behind the shock in the SN 2006jc system, but not in SN 2015G, because the interaction occurred in SN 2006jc only after the equilibrium temperature had dropped substantially. The spectra of SN 2015G showing He ii and N iii emission still exhibit a best-fitting blackbody temperature of ∼4000 K – likely too hot to allow any dust formation in the system at that phase.
Fig. 6 shows the light curve of SN 2015G compared to template light curves for SNe Ib/c and Ibn (Li et al. 2011; Drout et al. 2011; Hosseinzadeh et al. 2017) and to the light curves of SNe Ibn 2006jc and 2015U (Foley et al. 2007; Shivvers et al. 2016). The date of maximum brightness is unknown for both SNe 2006jc and 2015G; for this comparison we infer the dates of maximum for these two SNe by comparing their observed light curves to the template of Hosseinzadeh et al. (2017) while respecting the limits imposed by what constraints we have on their explosion dates. We estimate that SN 2006jc was discovered some 6 d after peak and SN 2015G was discovered 20 d after peak.
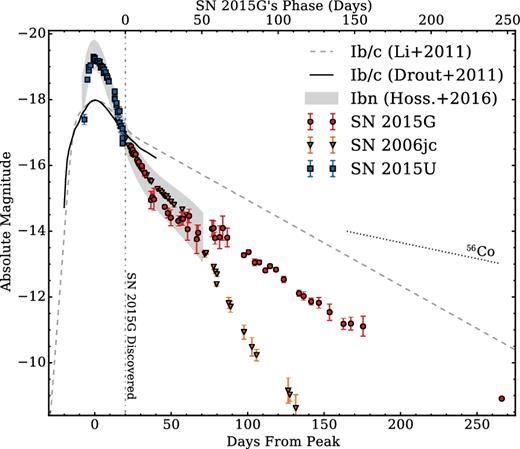
Absolute R-band light curve of SN 2015G, compared with absolute R light curves of SNe Ibn 2006jc (Foley et al. 2007; Maund et al. 2016) and 2015U (Shivvers et al. 2016). We compare to the template light curves of Li et al. (2011, dashed line), Drout et al. (2011, solid line) and Hosseinzadeh et al. (2017, shaded region). We offset the SNe 2006jc and 2015G light curves so as to best match with the SN Ibn template, and we show the phase of SN 2015G relative to its discovery date on the top axis with the inferred phase relative to optical peak on the bottom axis. We also show the 56Co → 56Fe decline rate for comparison.
The photometric evolution of SN 2015G is similar to that of other SNe Ibn (e.g. Pastorello et al. 2016; Hosseinzadeh et al. 2017). The optical light curves decline roughly linearly and slightly more rapidly than the 56Co → 56Fe decline rate, as do those of normal SNe Ib. There is some indication of a flattening in the R and I passbands around MJD 57170 (∼70 d after discovery), most clearly shown in Fig. 1. Unfortunately, SN 2015G was, at this time, fading below our KAIT detection threshold, and our monitoring campaign using larger telescopes had not yet begun; the data from these epochs are very noisy, and it is difficult to determine whether this apparent flattening is genuine. If real, it could be attributed to a short-lived luminosity enhancement from ongoing CSM interaction, but our continuing light curves do not show any evidence for similar episodes at later times.
Note, in Fig. 6, the steepening of SN 2006jc's R-band light curve around 75 d, likely caused by obscuration from a newly formed dust shell (Smith et al. 2008). Observations of the SN Ibn ASASSN-15ed suggest that it also became obscured by a forming dust shell ∼2 months after peak (Pastorello et al. 2015b). In good agreement with our spectra, the light curve of SN 2015G shows no evidence for a forming dust shell at least out to ∼8 months after discovery. Few SNe Ibn have been monitored out to such late phases, so it is difficult to know how common the formation of a dust shell may be, but, like SN 2015G, SNe Ibn tend to be subluminous at late phases compared to normal stripped-envelope SNe (Hosseinzadeh et al. 2017). If the luminosity of SNe Ibn on the post-peak decline is driven by radioactive decay, as is the case for normal stripped-envelope SNe, this implies that a significantly smaller amount of 56Ni is present in the ejecta of SNe Ibn than in those of normal SNe Ib/Ic.
3.4 Spectropolarimetry
Our spectropolarimetric observation of the young SN 2015G is shown in Fig. 7. SN 2015G shows strong continuum polarization (P ≈ 2.7 per cent), with some small but apparently significant variations across the strong He i line features.
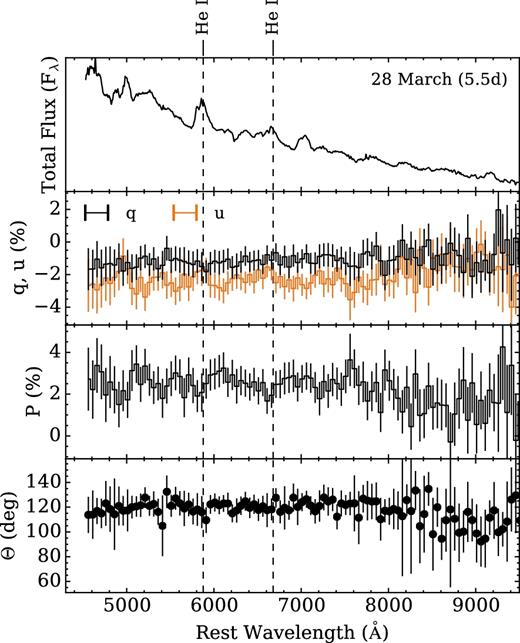
A single epoch of spectropolarimetry obtained 5.5 d after the discovery of SN 2015G. The top panel illustrates the total-flux spectrum smoothed with a 50 Å Gaussian kernel, while the middle panels show the Stokes parameters (q, u) and total polarization (P) binned to 50 Å, and the bottom panel gives the measured position angle, also binned to 50 Å.
It is possible that the continuum polarization level is substantially affected or perhaps even dominated by ISP along the line of sight. The host galaxy's contribution to interstellar dust absorption is relatively low and the SN appears to be in a rather remote environment, so we do not expect the host ISP to be dominant. None the less, the maximum polarization from the host could be up to 0.6 per cent (following Serkowski, Mathewson & Ford 1975), with an entirely unknown position angle. The larger MW dust absorption towards SN 2015G indicates that our Galaxy's ISP contribution could be as high as 2.9 per cent (Serkowski et al. 1975). Indeed, SN 2015G is at a low Galactic latitude of 14.8°, and substantial Galactic cirrus is present in this region of the sky.
The MW ISP can be estimated by measuring the polarization of stars that (1) are along the line of sight towards the SN (ideally within 1°); (2) are suspected to have negligible intrinsic polarization (ideally spectral types A5 through F5; Leonard et al. 2002) and (3) lie at sufficient distances such that all ISM along the line of sight and within a scaleheight of 150 pc above the Galactic disc is sampled. For the line of sight near SN 2015G this minimum required probe distance is 675 pc. Unfortunately, there are no stars in the literature of known spectral type with polarization measurements satisfying all of these criteria. Loosening these constraints to allow stars of any spectral types within 5°, we identify two stars in the catalogue of Heiles (2000) – HD 197911 (B5 V; 1043 pc) and HD 198781 (B0.5 V; 712 pc) – which exhibit an average (1σ) polarization and position angle of 1.36 per cent (0.03 per cent) and 150° (16°). This position angle value is consistent with that measured for SN 2015G, while the level of polarization is about half that of the SN. However, we are reluctant to trust these values as accurate measures of the ISP because at least one of those stars (HD 197911) has been associated with a dusty interstellar bow shock that is likely to scatter the star's light and exhibit its own polarization (Peri, Benaglia & Isequilla 2015). The existence of a star at that distance (well beyond the 675 pc limit we imposed above) with shocked ISM in its vicinity suggests that the scattering and polarizing effect of the ISM could extend to distances larger than expected in this region of the sky, and may be highly spatially variable.
To improve our census of the ISP, we obtained new Lick/Kast observations (on 2017 March 3) of two additional probe stars of known spectral types that have smaller angular separations, <2°: BD 661309 (A5 V) exhibits PV = 0.22 (0.01) per cent and θV = 54.7° (1.0°) and HD 197344 (B8 V) exhibits PV = 0.22 (0.01) per cent and θV = 64.6° (1.2°). These stars have spectroscopic parallaxes that indicate distances of 525 and 575 pc, respectively – close to, but slightly below, the minimum suggested distance to effectively probe the bulk of intervening ISM. None the less, the measured values are very low, which indicates that either the ISP is small near the SN's line of sight or that there is substantial ISP originating from greater distances than we are currently able to probe.
In conclusion, the complexity of the ISM in this region of the sky and the lack of excellent probe stars has proven problematic for our efforts to obtain a reliable estimate of the ISP towards SN 2015G. However, we note that none of the ISP estimates we have considered come close in strength to the very strong ∼2.7 per cent measured for the SN. It appears that, if the SN is not intrinsically polarized, then the ISP vector components of the MW and the host must be constructively interfering (i.e. have similar position angles, or at least be in similar quadrant of the q − u plane) to give us such a strong polarization measure. For this reason, it seems plausible that the intrinsic polarization of the SN is significant and therefore that the electron-scattering photosphere of the explosion is substantially aspherical, consistent with the other proxies for explosion asymmetry we consider in this paper. Without better constraints on the ISP, however, it is difficult to quantify the degree of asphericity.
3.5 The ultraviolet spectra
Fig. 8 shows the full STIS UV+optical spectrum from day 13, rebinned and median-averaged in wavelength bins ∼50 Å wide to increase the SNR and reduce the effects of cosmic rays. Continuum emission is detected from ∼2300 Å out to ∼1 μm, overlain by the broad and narrow P-Cygni features described above. We find one emission line in the near-UV, labelled Mg ii λλ2796, 2803 in Fig. 8. This feature is also observed in our spectrum from April 11, but not in the spectrum from April 20 (at which point the continuum has faded below detectability at these wavelengths as well). Between the first two spectra it evolves from a wavelength of 2764 ± 2 to 2784 ± 6 Å (uncertainty estimated via MCMC fits of two Gaussian profiles separated by the spacing of this doublet, 7.16 Å). Assuming our line identification is correct, and that both lines of the doublet contribute equally to the line flux, this implies velocity blueshifts for this feature of about 3800 and 1600 km s−1 on April 4 and 11 (respectively), so the slowdown is ∼300 km s−1 d−1. No other narrow emission lines in our data set on SN 2015G show this sort of behaviour and we note that it is peculiar. However, the SNR is low in our UV spectra and, though inspection of the raw two-dimensional frames shows them to be clean with no obvious artefacts, we are hesitant to infer too much from this putative Mg ii line.
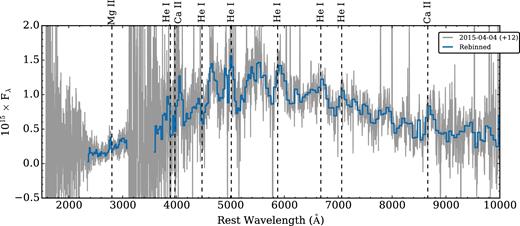
The UV through near-IR spectrum of SN 2015G, as observed by HST. Data have been corrected for dust absorption along the line of sight and are presented in the host galaxy's rest frame. The full spectrum is shown in grey and a rebinned spectrum with bins ∼50 Å wide is shown in blue.
3.6 The spectral energy distribution
Our observations of SN 2015G cover radio through UV wavelengths, and we are able to reconstruct a broad-wavelength spectral energy distribution (SED) at several phases. Fig. 9 shows the UV through IR SED of SN 2015G as observed at 5 epochs between 12 d and 35 d after discovery. For the two phases at which we have IR photometry, we interpolate the optical light curves to the time of the IR observations using a Gaussian process regression. At the earlier epoch, the Swift satellite observed the location of SN 2015G nearly concurrently (within a few hours), and we plot the 3σ upper limits from the resulting UV non-detections. For the later epoch, we plot the last UV non-detection from Swift, which was observed 5 d before the listed phase (when the optical+IR images were taken).
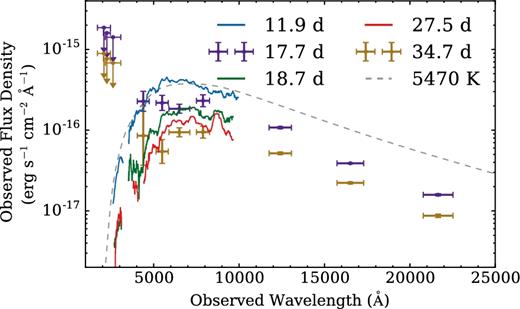
UV through IR observations of SN 2015G, including three UV-optical spectra observed by HST, which have been trimmed and smoothed with a wide (∼500 Å) median box filter to illustrate the overall SED, alongside two epochs of UV–IR photometry. All data are shown in the observer frame, with no corrections for extinction applied. For comparison, a blackbody at 5470 K is shown in dashed grey, redshifted into the observer's frame and obscured by the dust populations described in Section 3.1. Phase (d) or TBB (K) are given in the legend.
Our HST spectra strongly constrain the wavelength of peak flux, and we show a best-fitting model blackbody spectrum in Fig. 9, for comparison. Fitting a redshifted and dust-reddened blackbody (assuming the dust properties presented in Section 3.1) to the first HST spectrum, we find that the SED of SN 2015G is approximated quite well by a single-component blackbody with a temperature of TBB ≈ 5470 ± 250 K. Our uncertainties about the dust reddening arising within the host galaxy likely dominate our temperature errors, so we estimate the above error bars on TBB by ranging E(B − V)host from 0.0 mag to twice our best-guess value of 0.065 mag and refitting. For Fig. 9, we have converted our photometric observations into flux units using PySynphot and the published filter curves for each instrument, assuming a 5470 K blackbody spectrum.
Between 12 and 35 d after discovery, the SED qualitatively behaves like a cooling blackbody, fading in both temperature and luminosity. Our IR photometry argues for a steeper Rayleigh–Jeans tail than do our fits to the UV/optical peak, but (given our uncertainties about the degree and wavelength dependence of the dust obscuration towards SN 2015G) we are hesitant to assign much significance to that discrepancy. We estimate the bolometric energy output of SN 2015G and the implied blackbody radius at 11.9 d after discovery, based upon our blackbody fit to the HST spectrum: L ≈ 1042 erg s−1 and R ≈ 1015 cm.
3.7 Limits on radio luminosity
Radio emission from SNe predominantly arises via the synchrotron mechanism as the forward shock ploughs through the CSM. The narrow emission features in our early-time optical spectra provide clear evidence for a dense CSM near the progenitor at the time of core collapse. However, the density profile of the CSM at larger radii is quite uncertain, so the radio flux expected from the SN at intermediate and late phases is similarly uncertain. Though our attempts to observe radio emission SN 2015G yielded only upper limits, they do provide some interesting constraints on the extended CSM surrounding the SN.
We argue elsewhere in this paper that the dense CSM that made SN 2015G a SN Ibn was likely not created by wind-like mass-loss from the progenitor, but rather was built up through one or more extreme mass-loss events ≲1 yr before core collapse. However, we find it plausible (in the absence of evidence to the contrary) to assume a history of more stable wind-like mass-loss from the progenitor at earlier times before core collapse, as is normal for the progenitors of stripped-envelope SNe (e.g. Chevalier 1998; Kamble et al. 2014, 2016).
Our mid-phase spectra show broad lines with absorption edges falling at blueshifts of ∼8000 km s−1 (see Fig. 4), placing a lower limit on the velocity of the forward shock (vshock ≳ 8000 km s−1), while the narrow P-Cygni features in our early-time spectra have characteristic velocities of 1000 km s−1. We construct a simple model of the SN 2015G system by assuming a history of mass-loss with vwind ≈ 1000 km s−1 and adopting vshock = 10 000 km s−1. We further estimate that the SN took ∼5 d to rise to maximum brightness, yielding a best-guess explosion date of 2015-02-27 (MJD 57080). SN 2015G's rise time is effectively unconstrained; we motivate our choice by noting that other SNe Ibn for which the rise has been observed exhibit values of ∼5 d (Pastorello et al. 2016; Hosseinzadeh et al. 2017). This value is, however, quite uncertain, and SN 2015G may have taken significantly longer to rise to peak (see e.g. the 16 d rise shown by SN 2010al; Pastorello et al. 2015a).
Our naive blackbody model from Section 3.6 showed that our data are described rather well by a cooling blackbody of R ≈ 1015 cm. If we take this value to be the outer extent of the low-radii dense CSM, the forward shock would have taken ∼10 d to traverse this inner CSM and emerge into the hypothesized larger radii, lower density CSM. If this scenario is correct, our radio observations at 36, 76 and 148 d after explosion should therefore probe ongoing CSM interaction between the fastest-moving ejecta and material lost from the star around 1, 2 and 4 yr before explosion, respectively.
Following Kamble et al. (2014) and Kamble et al. (2016), we adopt the models of Chevalier (1998) to describe the radio flux from SN 2015G at the observed epochs, assuming that the radial density profile of the CSM goes as ρ ∝ r−2 at large radii. We parametrize the energy distribution of the shocked electrons as a power law in the electron Lorentz factor with index p, |$n_{\text{e}}(\gamma _{\text{e}}) \propto \gamma _{\text{e}}^{-p}$|; we assume that the fractional energy densities in the relativistic electrons and in the magnetic field are equivalent (i.e. the shocked material is in equipartition), εe = εB; and we assume that εe = 0.1. These models include both the effects of synchrotron self-absorption and free–free absorption from the CSM.
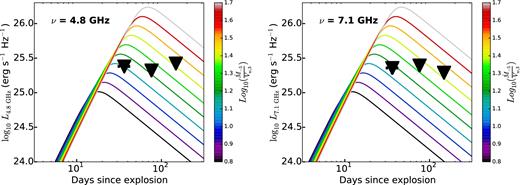
Our 3σ non-detections of SN 2015G at 4.8 and 7.1 GHz, plotted against modelled light curves assuming a range of values for the wind parameter. These models were constructed assuming vshock = 10 000 km s−1 and vwind = 1000 km s−1. We adopt an explosion date of MJD 57080, and we show horizontal error bars of ±5 d to illustrate our uncertainty about the exact date of explosion (the plotted data points are often wider than those error bars).
Radio emission from SNe Ibn is still uncharted territory, and it is difficult to know whether the assumptions (and therefore the models) outlined above are fully appropriate. Similar assumptions have been shown to be reasonable for stripped-envelope SNe with detected radio light curves, but the diversity of radio signatures found for these events is remarkable, especially among the SNe with evidence for unsteady pre-explosion mass-loss from their progenitor. See, for example, PTF 11qcj, a radio-bright SN Ic that may have had a SN 2006jc-like outburst from its progenitor ∼2 yr before core collapse (Corsi et al. 2014), or SN 2014C, a SN Ib that began to interact with an H-rich dense shell a year after explosion and showed extreme variability in its radio light curve (Margutti et al. 2017).
Our radio flux limits and the resultant CSM density limits shown in Fig. 10 are surprising, given the strong signatures of a dense CSM at low radii – SNe Ib/c with radio detections generally have peak luminosities in the range 1026–1028 erg s−1 Hz−1 at these frequencies (e.g. Soderberg 2007). If the CSM around SN 2015G had a structured density profile at large radii, perhaps with shells of material created by episodes of eruptive mass-loss rather than the steady wind-driven profile we model above, the radio emission powered by ongoing interaction could be entirely obscured via free–free absorption within the CSM exterior to the shock. Type IIn SNe in very dense environments, for example, sometimes exhibit radio light curves with rise times of ∼1000 d because of this effect (e.g. Chandra et al. 2012, 2015). These SNe sustain the optical signatures of ongoing interaction, however, while SN 2015G's narrow spectral features disappear and its interaction-powered optical brightness fades away – differences which argue that the radial profile of the CSM surrounding SN 2015G must be quite dissimilar from the (relatively) smooth density profiles inferred for the SNe IIn above. A further worry is that our models do not account for any CSM clumpiness or global asymmetry, though our optical observations argue that the SN 2015G system is strongly asymmetric. Without clear detections and lacking a true radio light curve, many uncertainties remain.
3.8 Progenitor constraints
SN 2015G is one of the nearest known SNe Ibn, and as such it provides us with a unique opportunity to study the progenitor star and local environment of a member of this rare subclass. A preliminary search for the progenitor in the HST/WFPC2 images from 2001 was presented by Maoz & Poznanski (2015). They established the SN position in these archival pre-SN data using a ground-based I-band image and did not detect a progenitor candidate there. Neglecting any extinction within the host galaxy, they estimate upper limits on the luminosity of a progenitor at MI > −6.4 mag and MV > −7.1 mag.
We initially used our HST Target of Opportunity (ToO) WFC3 images from GO-13683 to provide a better position for the SN in the 2001 WFPC2 F555W data. However, since the individual frame times for the ToO observations were only 10 s each (for a total of 240 s) and we observed in subarray mode, there were only seven stars in common between the two image data sets. Consequently, we could only register the images with a 1σ uncertainty of 0.61 WF pixel (the SN site is on the WF2 chip of the WFPC2 array). We therefore registered the pre-SN images to the much deeper WFC3 full-array data from GO-14149 (total exposure times of 780 s in F555W, 710 s in F814W). We found 30 star-like objects in common between the images and were able to achieve an astrometric registration that was somewhat better, with a 1σ uncertainty of 0.38 WF pixel. We note that the positions for the SN in the pre-SN data estimated from the two different WFC3 image sets agree to 0.49 pixel. We also do not see a progenitor candidate at this position, nor does dolphot detect any object there. In Fig. 11, we present the HST/WFC3 image of SN 2015G from 2015 November, a close-up view of the SN and its local environment, and a close-up view of the progenitor non-detection from 2001 (all in the F814W band).
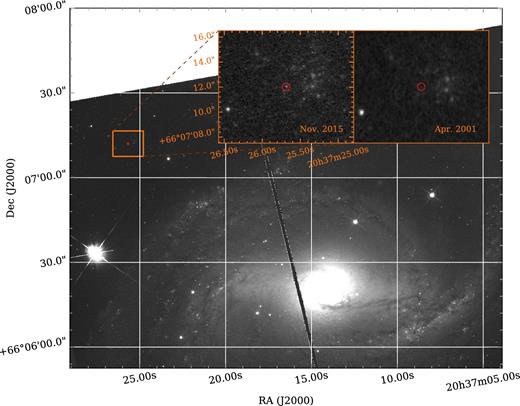
HST image of SN 2015G taken ∼8 months after discovery and a pre-explosion image of the SN site from 2001, both observed through the F814W filter. The main frame shows the large offset between SN 2015G and its host, while the two inset frames display close-up views of the fading SN (left) and the pre-explosion progenitor non-detection (right). We indicate the location of the SN using a red circle with a radius of 0.3 arcsec (larger than our 3σ uncertainty in the SN location).
As Fig. 11 shows, SN 2015G exploded far from the bulk of the stellar mass in NGC 6951 and far from the major star-forming regions. As noted by Maoz & Poznanski (2015), however, there is a small but conspicuous clump of bright and blue stars near that location. The centre of this clump is ∼2 arcsec west of SN 2015G, a distance of ∼200 pc. Most of the stars in the clump are within ∼100 pc of the centre – if SN 2015G's progenitor formed as a part of this clump, it appears to have travelled an appreciable distance from its birthplace. Alternatively, the progenitor may have formed within a smaller stellar subgroup, possibly at a different time.
Our final spectrum of SN 2015G was observed with this cluster along the slit, and a narrow H i line arising from this small star-forming region was detected. The redshift as measured from this emission line is in good agreement with the published redshift of the host galaxy, with an observed wavelength of 6592.33 ± 0.06 Å (as measured via maximum-likelihood MCMC fitting, assuming a Gaussian line profile). This implies a redshift of 0.00450, or a line-of-sight velocity within 100 km s−1 of that of NGC 6951.
We attempted artificial-star tests with dolphot on the images from 2001, injecting an artificial star at the exact SN position, and found the following non-detection upper limits: F555W ≳ 26.7 mag and F814W ≳ 25.4 mag. These are consistent with the formal 3σ source detections by dolphot at the SN's location, and they translate into absolute upper limits of MF555W ≳ −6.4 mag and MF814W ≳ −7.1 mag. These limits are essentially the same as those found by Maoz & Poznanski (2015), though their assumptions of the distance and reddening to the SN differed from ours.
Assuming the progenitor of SN 2015G was a single supergiant, and that it exploded at the terminus of its evolutionary track as something other than a hydrogen-rich supergiant, we compared our detection upper limits with the MESA Isochrones and Stellar Tracks (MIST; Paxton et al. 2011, 2013, 2015; Choi et al. 2016) at solar and slightly subsolar ([Fe/H] = −0.25) metallicities, adjusted for the distance and reddening to SN 2015G as described above. We find the following limits on the zero-age main-sequence mass by comparison with our F555W limit (the more constraining of the two): M0 ≲ 18 M⊙ (solar) and M0 ≲ 20 M⊙ (subsolar). These limits effectively rule out a single massive (M0 ≳ 30 M⊙) Wolf–Rayet star progenitor (assuming that the luminosity at the time of collapse is similar to the luminosities observed for Wolf–Rayet stars in the MW). Comparisons, instead, with the interacting binary models of Kim, Yoon & Koo (2015) show that some configurations are disallowed by our upper limits but a variety of possible binary models remain viable. Note that HST images of the field were obtained in 1994 through the F218W and F547M filters, but they do not provide deeper constraints.
Maund et al. (2016) have recently reported the likely detection of a binary companion to the progenitor of SN 2006jc in HST images obtained 4 yr after the SN explosion. The pre-explosion upper limits we find for the progenitor system of SN 2015G are marginally consistent with a similarly luminous source, depending upon the assumed properties of the extinction along the line of sight within the host galaxy.
We also considered the stellar environment of SN 2015G to constrain the properties of the progenitor. We analysed objects within a 43-pixel (∼200 pc) radius of the SN detected by dolphot in the WFC3 F555W and F814W images from GO-14149 that had a dolphot object type of ‘1’ (i.e. star-like). The resulting colour–magnitude diagram is shown in Fig. 12. We again compared the stellar photometry to the MIST tracks and found that, assuming that the population of stars in this region are coeval and that the SN progenitor itself was not rejuvenated in its evolution as a result of binary interaction, the highest initial mass the progenitor star could have had was ∼18 M⊙, consistent with the upper limits calculated from our progenitor non-detection.
![Colour–magnitude diagram of star-like objects (open squares) detected by dolphot within a 43-pixel (∼200 pc) radius of SN 2015G's position in HST/WFC3 images obtained in 2015 by program GO-14149. The SN itself is shown as a filled square. For comparison, we plot MIST stellar evolutionary tracks at slightly subsolar ([Fe/H] = −0.25) metallicity and initial masses of 10, 15 and 18 M⊙, adjusted to the assumed distance and reddening of SN 2015G.](https://oup.silverchair-cdn.com/oup/backfile/Content_public/Journal/mnras/471/4/10.1093_mnras_stx1885/1/m_stx1885fig12.jpeg?Expires=1716406916&Signature=Cvc-xpYQZhQEvMbaQ5vi1Z8daT~yVsjad2KkK2-qbDuhONTSQOImBQKnGNb5jQtJoAAwpc-RZ8aYac4-jN46I4uYvbnkr2QgYAU8IKwdJhOGm6lXn~xrKLFSVhrvL5V5sL0ktiQv-Fdr9JfTdPVFgC-haRjhmDdUJih9V-sBJfakQqR-ODycCswhfiTxwppkCjnNKDCMEkDMsnJHuImJjzI4QGfPdCH1kfVKmU6XKJcPRJaodc4fsZS1gDZ7hMXhyX53oSaLDxbASU9uIwqwX-KbkNsufiE5ErG~Tl7BXF7tNa~WLk9e5cn4KDbyIWfiMn5wpiD9Ouy19IF8Q1mzAw__&Key-Pair-Id=APKAIE5G5CRDK6RD3PGA)
Colour–magnitude diagram of star-like objects (open squares) detected by dolphot within a 43-pixel (∼200 pc) radius of SN 2015G's position in HST/WFC3 images obtained in 2015 by program GO-14149. The SN itself is shown as a filled square. For comparison, we plot MIST stellar evolutionary tracks at slightly subsolar ([Fe/H] = −0.25) metallicity and initial masses of 10, 15 and 18 M⊙, adjusted to the assumed distance and reddening of SN 2015G.
Comparing our Fig. 11 to fig. 1 of Maund et al. (2016), we note the remarkable similarity between SN 2006jc's local environment and that of SN 2015G: both SNe exploded in sparse areas of their hosts near clumps of young, massive stars but offset from them by ≳100 pc. The Type IIn SN 2009ip was also quite isolated (Smith, Andrews & Mauerhan 2016), and Smith & Tombleson (2015) show that luminous blue variables (LBVs) in the MW, often proposed to be Galactic analogues for the progenitors of strongly interacting SNe, are as well. They interpret the isolation of LBVs as evidence that they are mass gainers in binary pairs which get rejuvenated by mass exchange and receive a kick when their (more massive) companion explodes, allowing them to travel far from their birth sites before their own deaths (note that these results are under some debate; e.g. Humphreys et al. 2016).
The presence of a dense CSM surrounding SN 2015G suggests a recent history of extreme mass-loss from, and therefore variability of, the progenitor star. An LBV-like bright outburst from SN Ibn 2006jc's progenitor was observed some 2 yr before the SN itself (Mr ≈ −14.1 mag; Nakano et al. 2006; Foley et al. 2007; Pastorello et al. 2007). There have also been a few SN IIn progenitors detected in outburst in the years prior to core collapse (e.g. Fraser et al. 2013; Mauerhan et al. 2013; Pastorello et al. 2013; Margutti et al. 2014; Smith 2014; Ofek et al. 2014; Elias-Rosa et al. 2016; Thöne et al. 2017), though similar outbursts have, in other cases, been ruled out (e.g. Bilinski et al. 2015). KAIT has been monitoring NGC 6951 for almost 20 yr and we searched this extensive data set for evidence of pre-explosion variability.
Examining 1248 unfiltered images taken between 1998 and 2015 with detectability thresholds deeper than 17.0 mag, we find no detections at the SN location and no evidence for previous outbursts of the progenitor brighter than −13.3 ± 0.5 mag (median and standard deviation of the detection thresholds among all images). Fig. 13 plots our 1σ non-detections and the observed light curve of SN 2015G, with the luminosity of SN 2006jc's pre-explosion outburst indicated for comparison. (The HST non-detections described above provide additional extremely strong constraints in 2001 May, off the bottom of the scale of Fig. 13.) The SN field was inaccessible to our telescopes for several months every year, so there are significant gaps; the orange bars along the bottom of Fig. 13 mark every night on which more than 1 month had passed since the previous upper limit. Approximately 45 per cent of the nights between 1998 October and the SN discovery in 2015 March fall into such a gap.
Our 1σ pre-explosion non-detections from KAIT unfiltered images. The R-band light curve of SN 2015G is shown at the far right. Timespans for which no upper limit had been obtained for at least 1 month are marked in orange along the bottom, and a dashed line indicates the absolute magnitude of SN 2006jc's pre-explosion outburst (Foley et al. 2007).
Though these observations rule out any long-lasting luminous outbursts in the last 20 yr, the outburst from SN 2006jc's progenitor was observed to fade rapidly after discovery (∼0.16 mag d−1 over the 9 d it was detected, Pastorello et al. 2007); thus, our non-detections argue neither for nor strongly against a SN 2006jc-like outburst from SN 2015G's progenitor (Nakano et al. 2006; Pastorello et al. 2007).
3.9 A rough schematic of the SN 2015G system
Based upon the above observations, we interpret SN 2015G to be a Type Ib SN explosion modified by additional luminosity arising via the collision between explosive ejecta and dense CSM, with the collision between SN ejecta and the CSM converting the kinetic energy of the ejecta into radiative luminosity (e.g. Chugai & Danziger 1994; Chevalier & Fransson 1994; Chevalier & Irwin 2011).
The luminous yet rapidly fading light-curve peak settles into a slower decline rate, while either ongoing (weaker) interaction or a (relatively small amount of) radioactive material powers the luminosity of the late-time light-curve tail. Our spectroscopic monitoring of SN 2015G began after shock breakout and peak luminosity, and the early-time spectra of the event show a cooling blue continuum topped by relatively broad emission lines (arising from the ejecta and perhaps the shocked and accelerated CSM) and narrow P-Cygni lines (arising from the unshocked and extended CSM at larger radii). The spectral lines at early phases are centred at a velocity of 0 km s−1, and therefore the CSM in which these early lines formed likely exhibited a range of velocity vectors more or less symmetrically distributed around the progenitor.
These narrow P-Cygni features disappeared from our spectra ∼10 d after the discovery of SN 2015G, or ∼35 d after our roughly estimated explosion date. Coupled with our radio non-detections (the first of which was observed 36 d post-explosion), this argues that the dense CSM was predominantly located at small radii and was therefore likely lost from the surface of the progenitor in the last year or so before core collapse.
As the light curve settles into its late-time decline rate, the broader features transition from pure emission into a P-Cygni profile, likely arising from some mixture of the swept-up CSM and the ejecta. The light curve then continues to decline steadily as the continuum, and therefore the absorption features, fade away. As the ejecta and accelerated CSM continue to expand and the density drops, forbidden emission lines become prominent. The evolution of all emission lines redward argues that the line flux at late times arises predominantly within receding material, unlike the early emission-line flux.
Whether ongoing weak CSM interaction or a relatively small amount of 56Ni powers the late-time light curves of SNe Ibn is still a difficult question. SN 2015G's late-time decline at redder wavelengths (the I and F814W passbands) appears to be very similar to that at bluer wavelengths (V and F555W), arguing that the blue pseudo-continuum and the (mostly red) emission lines are powered by the same process. The blue pseudo-continuum is generally understood to be powered via CSM interaction, and so this argues that the line emission also arises from CSM interaction.
In contrast, the linear decline of the late-time light curve and the homogeneity of light-curve shapes among SNe Ibn argue for the radioactively powered interpretation. If SN Ibn light curves are interaction-powered on the tail, the diversity of late-time light-curve properties should reflect the diversity of CSM configurations around the progenitors; it would be surprising if these CSM configurations (and therefore the progenitor pre-explosion mass-loss histories) were so similar across different SNe (e.g. Pastorello et al. 2008a; Hosseinzadeh et al. 2017). The light curves of SNe IIn (which assuredly are powered largely by interaction) are very heterogeneous, as expected (e.g. Kiewe et al. 2012), though comparisons with hydrogen-rich SNe must be made with caution; the lack of hydrogen in SNe Ibn may force the continuum opacity significantly lower. Note that the late-time luminosities of SNe Ibn are low compared to those of normal SNe Ib/Ic – if they are radioactively powered at late times, it seems they must produce a relatively small amount of 56Ni.
The systemic redshift of the Ca ii and He i lines implies a severe (and peculiar) asymmetry of the system, likely due to an asymmetry of the CSM with which SN 2015G's ejecta are interacting at these phases (assuming these lines are interaction-powered). However, we do observe some polarization intrinsic to SN 2015G at early times, and a less-than-spherical explosion itself may also be playing a role. Not only are asymmetric geometries often invoked to understand the observed properties of core-collapse SNe (e.g. Mazzali et al. 2005; Maeda et al. 2008; Modjaz et al. 2008; Taubenberger et al. 2009; Milisavljevic et al. 2010), but both the analysis of some SN remnants and the results of modern two- and three-dimensional modelling efforts of the core-collapse mechanism itself argue that asymmetric (sometimes unipolar) explosions are possible and may even be common.
The Puppis A SN remnant (Petre, Becker & Winkler 1996), for example, shows a compact neutron-star remnant with a systemic velocity of some 1000 km s−1 along a vector opposite that of the bulk ejecta velocity, arguing that the neutron star received a substantive kick from the core-collapse event and that the ejecta received a similar kick in the opposite direction. Explosion asymmetries of lesser degree have also been observed (e.g. the so-called Bochum event of SN 1987A; Phillips & Heathcote 1989). From the modelling side, several teams have shown that low-order spherical harmonics of the exploding core may well manifest themselves in large-scale asymmetries of the explosion (e.g. Suwa et al. 2010; Hanke et al. 2012; Couch & Ott 2014; Couch & O'Connor 2014).
4 CONCLUSION
SN 2015G, which exploded in NGC 6951 at a distance of 23.2 Mpc, is one of the nearest known SNe Ibn. Though it was discovered after peak brightness, we have been able to accrue a remarkable data set on this event, making it one of the best-studied SNe of this rare type and highlighting both strong similarities with and differences from the archetypical SN Ibn 2006jc.
Hosseinzadeh et al. (2017) argue for two spectroscopically defined subclasses of SNe Ibn, but our observations of SN 2015G show that it exhibited properties of both proposed subclasses. Rather than two physically distinct subclasses, perhaps a continuum of CSM properties surrounding the SN produces a continuum of spectroscopic properties; this question should be investigated further as more SNe Ibn are identified and studied.
Archival HST images of the resolved SN explosion site argue against a single massive WR-like progenitor for SN 2015G. Given the recent likely detection of a binary companion to SN 2006jc's progenitor, the isolation of SN 2015G's explosion site and the well-determined position of the SN in multiple HST images makes SN 2015G an excellent candidate for a similar study in the future.
The data presented here argue that extreme mass-loss from the progenitor of SN 2015G occurred soon (∼1 yr) before core collapse, and that the SN 2015G system was asymmetric. Asymmetries in stripped-envelope SNe are common, but the degree of asymmetry shown by the late-time spectra of SN 2015G has not been observed in a SN Ibn before now. A dedicated effort to obtain more high-resolution spectra and better late-time coverage of SNe Ibn is called for to understand whether severe asymmetry is characteristic of SNe Ibn or a unique trait of the SN 2015G system.
Acknowledgements
We thank K. Shen, C. Harris and J. Schwab for helpful discussions. We thank our referee, A. Pastorello, for his productive comments, which have improved this paper. A.V.F.’s supernova group at UC Berkeley is supported by US National Science Foundation (NSF) grant AST-1211916, Gary & Cynthia Bengier, the Richard & Rhoda Goldman Fund, the Christopher R. Redlich Fund, the TABASGO Foundation and the Miller Institute for Basic Research in Science (UC Berkeley). His work was conducted in part at the Aspen Center for Physics, which is supported by NSF grant PHY-1607611; he thanks the Center for its hospitality during the neutron stars workshop in June and July 2017. Support for HST programs GO-13683, GO-13797, GO-14149, AR-14295 and GO-14668 was provided by the National Aeronautics and Space Administration (NASA) through grants from the Space Telescope Science Institute, which is operated by the Association of Universities for Research in Astronomy (AURA), Inc., under NASA contract NAS5-26555. The UCSC group is supported in part by NSF grant AST-1518052 and from fellowships from the Alfred P. Sloan Foundation and the David and Lucile Packard Foundation to RJF.
Some of the data presented herein were obtained at the W. M. Keck Observatory, which is operated as a scientific partnership among the California Institute of Technology, the University of California and NASA; the observatory was made possible by the generous financial support of the W. M. Keck Foundation. KAIT and its ongoing operation were made possible by donations from Sun Microsystems, Inc., the Hewlett-Packard Company, AutoScope Corporation, Lick Observatory, the NSF, the University of California, the Sylvia and Jim Katzman Foundation and the TABASGO Foundation. Research at Lick Observatory is partially supported by a generous gift from Google. We are grateful to the staffs of Lick, Keck and the other observatories where we obtained data for their excellent assistance.
This work made use of Swift/UVOT data reduced by P. J. Brown for the Swift Optical/Ultraviolet Supernova Archive (SOUSA. SOUSA is supported by NASA’s Astrophysics Data Analysis Program through grant NNX13AF35G. This research has made use of data and/or software provided by the High Energy Astrophysics Science Archive Research Center (HEASARC), which is a service of the Astrophysics Science Division at NASA/GSFC and the High Energy Astrophysics Division of the Smithsonian Astrophysical Observatory. This research has made use of the NASA/IPAC Extragalactic Database (NED) which is operated by the Jet Propulsion Laboratory, California Institute of Technology, under contract with NASA.
Another epoch of imaging was attempted on 2016 October 15 as part of GO-14668 (PI: A. Filippenko), but unfortunately the observations were set up such that the pointing was towards the centre of NGC 6951 and, owing to the orientation of the image array, the SN site itself was missed.
iraf is distributed by the National Optical Astronomy Observatory, which is operated by AURA, Inc., under a cooperative agreement with the NSF.
wiserep.weizmann.ac.il
sne.space
heracles.astro.berkeley.edu/sndb
ned.ipac.caltech.edu/
REFERENCES
SUPPORTING INFORMATION
Supplementary data are available at MNRAS online.
Table 1. Table of photometric observations.
Please note: Oxford University Press is not responsible for the content or functionality of any supporting materials supplied by the authors. Any queries (other than missing material) should be directed to the corresponding author for the article.
