


Abstract
We use cosmological simulations to study a characteristic evolution pattern of high-redshift galaxies. Early, stream-fed, highly perturbed, gas-rich discs undergo phases of dissipative contraction into compact, star-forming systems (‘blue’ nuggets) at z ∼ 4–2. The peak of gas compaction marks the onset of central gas depletion and inside-out quenching into compact ellipticals (red nuggets) by z ∼ 2. These are sometimes surrounded by gas rings or grow extended dry stellar envelopes. The compaction occurs at a roughly constant specific star formation rate (SFR), and the quenching occurs at a constant stellar surface density within the inner kpc (Σ1). Massive galaxies quench earlier, faster, and at a higher Σ1 than lower mass galaxies, which compactify and attempt to quench more than once. This evolution pattern is consistent with the way galaxies populate the SFR-size–mass space, and with gradients and scatter across the main sequence. The compaction is triggered by an intense inflow episode, involving (mostly minor) mergers, counter-rotating streams or recycled gas, and is commonly associated with violent disc instability. The contraction is dissipative, with the inflow rate >SFR, and the maximum Σ1 anticorrelated with the initial spin parameter. The central quenching is triggered by the high SFR and stellar/supernova feedback (maybe also active galactic nucleus feedback) due to the high central gas density, while the central inflow weakens as the disc vanishes. Suppression of fresh gas supply by a hot halo allows the long-term maintenance of quenching once above a threshold halo mass, inducing the quenching downsizing.
INTRODUCTION
Observations indicate that a significant fraction of the massive galaxies at redshifts z = 2–3 are compact ellipticals with suppressed star formation rates (SFR), for which we adopt the nickname ‘red nuggets’1 (Daddi et al. 2005; Trujillo et al. 2006a,b; van Dokkum et al. 2008, 2014; Damjanov et al. 2009; Newman et al. 2010; van Dokkum et al. 2010; Damjanov et al. 2011; Bruce et al. 2012; Whitaker et al. 2012). While the massive star-forming discs of stellar mass ∼1011 M⊙ extend to effective radii of several kpc (Genzel et al. 2006, 2008; Elmegreen et al. 2007), the quenched spheroids of a similar mass have effective radii of the order of 1 kpc (Carollo et al. 2013; van der Wel et al. 2014).
The sizes of extended discs are roughly consistent with the theoretical expectations based on gas infall through dark matter haloes into rotating discs while conserving angular momentum (AM; Fall & Efstathiou 1980; Mo, Mao & White 1998; Bullock et al. 2001; Fall & Romanowsky 2013; Danovich et al. 2014). Since stellar systems tend to conserve energy and AM, further contraction to form the compact nuggets would require further loss of energy and AM, which cannot be easily achieved by stellar systems. Thus, the formation of nuggets is likely to be a dissipative process, namely associated with gas inflow into the central regions of the galaxies. We refer to this as a ‘wet’ process. Gas inflow is naturally expected at high redshift, since the gas fraction in discs is high at these early times (Daddi et al. 2010; Tacconi et al. 2010, 2013).
Indeed, there are indicative observational identifications of the progenitors of the red nuggets in the form of ‘blue nuggets’, which are compact, star-forming galaxies (SFG).2 Their masses, kinematics and abundances are consistent with those of the red nuggets (Barro et al. 2013, 2014a,b; Bruce et al. 2014; Nelson et al. 2014; Williams et al. 2014a,b). Compact galaxies, both star-forming and quenched, have been detected in cosmological hydrodynamic simulations (e.g. Ceverino et al. 2014a; Wellons et al. 2015) and semi-analytic simulations (Brennan et al. 2015). The observed abundances of blue nuggets depend on their lifetimes, which could be rather short, depending on the galaxy properties and on the actual quenching mechanism (see below).
We thus envision a generic pattern of evolution for high-redshift galaxies through several characteristic phases. First, the early formation of a gas-rich, star-forming, highly perturbed disc, subject to intense inflows involving multiple (mostly minor) wet mergers, and developing violent disc instability (VDI). Secondly, the dissipative, quick compaction of the gas disc into a compact, star-forming blue nugget. Thirdly, immediately following the compaction, is the rather fast quenching of star formation into a compact red nugget. Finally, the gradual growth and expansion of the elliptical galaxy by dry mergers, and/or the development of a new gas disc or ring surrounding the red nugget. The origins of the compaction and the subsequent quenching are the theoretical challenges addressed in this paper.
In the early disc phase, streams from the cosmic web, consisting of smooth gas and merging galaxies, continuously feed galactic discs (Birnboim & Dekel 2003; Kereš et al. 2005; Dekel & Birnboim 2006; Ocvirk, Pichon & Teyssier 2008; Dekel et al. 2009; Kereš et al. 2009; Danovich et al. 2012, 2014). The detailed thermal history of the streams in the inner halo (Ceverino, Dekel & Bournaud 2010; Nelson et al. 2013) does not make a difference, as long as the discs are fed with cold gas at the levels consistent with the observed high SFR and gas fraction. The high gas fraction and the high density of the Universe at these high redshifts, combined with constant triggering by minor mergers, induce and maintain VDI, which is characterized by turbulence and perturbations in the form of large transient features and giant clumps (Noguchi 1998; Immeli et al. 2004a,b; Genzel et al. 2006, 2008; Bournaud, Elmegreen & Elmegreen 2007; Agertz, Teyssier & Moore 2009; Dekel, Sari & Ceverino 2009; Ceverino et al. 2010; Ceverino et al. 2012; Mandelker et al. 2014).
The onset of wet compaction is the first open issue we wish to address here. We can identify several potential reasons for the compaction. Gas-rich mergers tend to drive gas into the galaxy centre (e.g. Barnes & Hernquist 1991; Baugh, Cole & Frenk 1996; Mihos & Hernquist 1996; Hopkins et al. 2006; Wellons et al. 2015). Counter-rotating streams, low-AM-recycled gas, and tidal compression could also generate shrinkage (see Section 7.1). Finally, intense gas inflow within the disc is naturally driven by VDI (Noguchi 1999; Gammie 2001; Dekel et al. 2009; Burkert et al. 2010; Krumholz & Burkert 2010; Bournaud et al. 2011b; Cacciato, Dekel & Genel 2012; Elmegreen, Zhang & Hunter 2012; Forbes, Krumholz & Burkert 2012; Dekel et al. 2013; Forbes et al. 2014). The time-scale for VDI-driven inflow has been estimated in several different ways (e.g. Dekel et al. 2009, 2013) to be tinf ∼ δ−2td, where δ is the fraction of ‘cold’ mass (mostly gas and young stars) within the disc radius with respect to the total mass (including the bulge and dark matter), and td is the typical dynamical crossing time of the disc. It appears that at high redshift more gas is driven into the bulge by processes that do not involve major mergers (of a stellar mass ratio larger than 1:3), both based on observations (e.g. Genzel et al. 2006, 2008; Bournaud et al. 2008; Kaviraj et al. 2013b) and on theory including simulations (e.g. Neistein & Dekel 2008; Bournaud & Elmegreen 2009; Dekel et al. 2009, 2013; Cattaneo et al. 2013). Semi-analytic models that try to include VDI-driven inflows confirm that it is a major source of spheroid growth (Porter et al. 2014a,b). In fact, our developing understanding is that minor mergers, counter-rotation, recycling and tidal compression stimulate the VDI, and they actually work in concert (Inoue et al., in preparation).
The way in which compaction leads to quenching is the second open question to be addressed in this paper. As discussed in DB14, the internal, bulge quenching, associated with the compaction, may involve gas starvation by rapid consumption into stars, the associated gas loss via outflows driven by stellar feedback (e.g. Dekel & Silk 1986; Murray, Quataert & Thompson 2005) or active galactic nucleus (AGN) feedback (e.g. Ciotti & Ostriker 2007; Cattaneo et al. 2009, for a review), and possibly a slowdown of gas supply to the centre (Feldmann & Mayer 2014). A massive stellar bulge could also suppress star formation by shutting off disc instability (by increasing the Toomre Q parameter to above unity), either by the gravitational effect on the rotation curve (morphological quenching, Martig et al. 2009, 2013; Genzel et al. 2014a), by the reduced gas surface density in the disc, or by high feedback-driven velocity dispersion. These processes typically operate in a fast mode that may be the dominant trigger for quenching at high redshift.
However, observations indicate that compactness is a necessary, but not sufficient, condition for quenching (Cheung et al. 2012; Barro et al. 2013; Fang et al. 2013; Woo et al. 2013, 2014). Obviously, a long-term suppression of external gas supply is required for maintaining quenching. This happens naturally once the halo mass grows above a threshold mass of the order of 1011.5–12.5 M⊙, either via virial shock heating (Birnboim & Dekel 2003; Kereš et al. 2005, 2009; Dekel & Birnboim 2006), by gravitational infall heating (Dekel & Birnboim 2008; Khochfar & Ostriker 2008), or by AGN feedback coupled to the hot halo gas (Dekel & Birnboim 2006; Cattaneo et al. 2009; Fabian 2012). These external processes typically operate in a slow, maintenance mode that is expected to be dominant at low redshift or at the late stages of quenching, and their interplay with the internal bulge-driven quenching is yet to be investigated.
In this paper, we address the processes of compaction and quenching using high-resolution, zoom-in, hydro-cosmological, adaptive mesh refinement (AMR) simulations of galaxies in the redshift range z = 7–1. The suite of galaxies analysed here were simulated at a maximum resolution of ∼25 pc including supernova and radiative stellar feedback. At z ∼ 2, the halo masses are in the range Mv ∼ 1011–12 M⊙ and the stellar masses are in the range Ms ∼ 109.1–10.8 M⊙.
This paper is organized as follows. In Section 2, we describe the simulations. In Section 3, we address the wetness of bulge formation by measuring the fraction of bulge stars that were formed in situ in the bulge, namely after dissipative gas contraction. In Section 5, we study the evolution of the properties of the whole sample of simulated galaxies, and address in particular the mass and time dependence of the quenching events. In Section 6, we extend the analysis to the dependence of quenching on halo mass. In Section 7, we discuss the possible origins of the compaction and quenching processes. In Section 8, we summarize our conclusions and discuss them.
SIMULATIONS
Simulation method and subgrid physics
We use zoom-in hydro-cosmological simulations of 26 moderately massive galaxies with an AMR maximum resolution that varies between 17.5 and 35 pc, all evolved to z = 2 and most reaching z = 1. They utilize the Adaptive Refinement Tree (art) code (Kravtsov, Klypin & Khokhlov 1997; Ceverino & Klypin 2009), which accurately follows the evolution of a gravitating N-body system and the Eulerian gas dynamics using an adaptive mesh. Beyond gravity and hydrodynamics, the code incorporates at the subgrid level many of the physical processes relevant for galaxy formation. These include gas cooling by atomic hydrogen and helium as well as by metals and molecular hydrogen, photoionization heating by the UV background with partial self-shielding, star formation, stellar mass-loss, metal enrichment of the interstellar medium (ISM), and stellar feedback. Supernovae and stellar winds are implemented by local injection of thermal energy as in Ceverino & Klypin (2009), Ceverino et al. (2010, 2012). Radiative stellar feedback is implemented with no significant infrared trapping (in the spirit of Dekel & Krumholz 2013), as described in Ceverino et al. (2014b).
A few relevant details concerning the subgrid physics are as follows. Cooling and heating rates are tabulated for a given gas density, temperature, metallicity, and UV background based on the cloudy code (version 96b4; Ferland et al. 1998), assuming a slab of thickness 1 kpc. A uniform UV background based on the redshift-dependent Haardt & Madau (1996) model is assumed, except at gas densities higher than 0.1 cm−3, where a substantially suppressed UV background is used (5.9 × 1026 erg s−1 cm−2 Hz−1) in order to mimic the partial self-shielding of dense gas. This allows the dense gas to cool down to temperatures of ∼300 K. The assumed equation of state is that of an ideal mono-atomic gas. Artificial fragmentation on the cell size is prevented by introducing a pressure floor, which ensures that the Jeans scale is resolved by at least seven cells (see Ceverino et al. 2010).
Star formation is assumed to occur at densities above a threshold of 1 cm−3 and at temperatures below 104 K. More than 90 per cent of the stars form at temperatures well below 103 K, and more than half the stars form at 300 K in cells where the gas density is higher than 10 cm−3. The code implements a stochastic star formation model that yields a star formation efficiency per free-fall time of ∼2 per cent.3 At the given resolution, this efficiency roughly mimics the empirical Kennicutt–Schmidt law (Kennicutt 1998). The current version of the codes uses the stellar initial mass function (IMF) of Chabrier (2005).4
The code incorporates a thermal stellar feedback model, in which the combined energy from stellar winds and supernova explosions is released as a constant heating rate over 40 Myr following star formation, the typical age of the lightest star that explodes as a Type-II, core-collapse supernova. The heating rate due to feedback may or may not overcome the cooling rate, depending on the gas conditions in the star-forming regions (Dekel & Silk 1986; Ceverino & Klypin 2009). We note that no artificial shutdown of cooling is implemented in these simulations. On the other hand, we include the effect of runaway stars by applying a velocity kick of ∼10 km s−1 to 30 per cent of the newly formed stellar particles. The code also includes the later effects of Type-Ia supernova and stellar mass-loss, and it follows the metal enrichment of the ISM. Radiation pressure is incorporated through the addition of a non-thermal pressure term to the total gas pressure in regions where ionizing photons from massive stars are produced and may be trapped. This ionizing radiation injects momentum in the cells neighbouring massive star particles younger than 5 Myr, and whose column density exceeds 1021 cm−2, isotropically pressurizing the star-forming regions (as described also in Agertz et al. 2013, appendix B). More details are provided in Ceverino et al. (2014b).
The initial conditions for the high-resolution, zoom-in, hydrodynamical simulations that are used in this paper are based on dark matter haloes that were drawn from dissipationless N-body simulations at lower resolution in three large comoving cosmological boxes. The assumed cosmology is the standard Λ cold dark matter model with the WMAP5 values of the cosmological parameters, namely Ωm = 0.27, ΩΛ = 0.73, Ωb = 0.045, h = 0.7, and σ8 = 0.82 (Komatsu et al. 2009). Each halo was selected to have a given virial mass at z = 1. The only other selection criterion was that they show no ongoing major merger at z = 1. This eliminates less than 10 per cent of the haloes which tend to be in a dense environment at z ∼ 1, and it induces only a minor selection effect at higher redshifts. The target virial masses at z = 1 were selected to be in the range Mv = 2 × 10¹¹–2 × 10¹² M⊙, about a median of 4.6 × 10¹¹ M⊙. If left in isolation, the median mass at z = 0 was intended to be ∼1012 M⊙, namely comparable to the Milky Way. In practice, the actual mass range is broader, with some of the haloes merging into more massive haloes that eventually host groups at z = 0.
The initial conditions corresponding to each of the selected haloes were filled with gas and refined to a much higher resolution on an adaptive mesh within a zoom-in Lagrangian volume that encompasses the mass within twice the virial radius at z = 0.5–1, which is roughly a sphere of comoving radius 1 Mpc. This was embedded in a comoving cosmological box of side that ranges from 10 to 40 h−1 Mpc. Each galaxy has been evolved with the full hydro art and subgrid physics on an adaptive comoving mesh refined in the dense regions to cells of minimum size between 17.5 and 35 pc in physical units at all times.5 This maximum resolution is valid in particular throughout the cold discs and dense clumps, allowing cooling to ∼300 K and maximum gas densities of ∼103 cm−3. The force resolution is two grid cells, as required for computing the gradient of the gravitational potential. The dark matter particle mass is 8.3 × 10⁴ M⊙, and the particles representing stars have a minimum mass of 103 M⊙. Each AMR cell is split into eight cells once it contains a mass in stars and dark matter higher than 2.6 × 10⁵ M⊙, equivalent to three dark matter particles, or once it contains a gas mass higher than 1.5 × 10⁶ M⊙. This quasi-Lagrangian strategy ends at the highest level of refinement that marks the minimum cell size at each redshift.
The sample of galaxies: physical quantities
We start the analysis at the cosmological time corresponding to expansion factor a = 0.125 (redshift z = 7). At earlier times, the fixed resolution scale typically corresponds to a larger fraction of the galaxy size, which may bias some of the quantities that we wish to study here. Most galaxies reach a = 0.50 (z = 1). The output of each simulation is analysed at output times separated by a constant interval in a, Δa = 0.01 (which at z = 2 corresponds to about 100 Myr).
Global properties of the galaxies in our sample are listed in Table 1. This includes the total virial mass Mv and virial radius Rv, the galaxy stellar mass Ms, and the effective, half-mass radius Re, both at z = 2 and at the last available time for each simulation. The latest time of analysis for each galaxy in terms of the expansion factor, afin, and redshift, zfin, is provided. The virial mass Mv is the total mass within a sphere of radius Rv that encompasses an overdensity of Δ(z) = (18π2 − 82ΩΛ(z) − 39ΩΛ(z)2)/Ωm(z), where ΩΛ(z) and Ωm(z) are the cosmological parameters at z. (Bryan & Norman 1998; Dekel & Birnboim 2006, Appendix A1).
The suite of 26 simulated galaxies. The galaxy name Vxx is short for VELA_V2_xx. Quoted are the total mass, Mv, the stellar mass, Ms, the virial radius Rv, and the effective stellar (half-mass) radius Re both at z = 2 and at the final simulation snapshot, afin = (1 + zfin)−1.
| Galaxy | Mv | Ms | Rv | Re | Mv | Ms | Rv | Re | afin | zfin |
|---|---|---|---|---|---|---|---|---|---|---|
| 1012 M⊙ | 1010 M⊙ | kpc | kpc | 1012 M⊙ | 1010 M⊙ | kpc | kpc | |||
| (z = 2) | (z = 2) | (z = 2) | (z = 2) | (zfin) | (zfin) | (zfin) | (zfin) | |||
| V01 | 0.16 | 0.22 | 58.25 | 1.06 | 0.48 | 1.51 | 123.75 | 2.18 | 0.50 | 1.00 |
| V02 | 0.13 | 0.19 | 54.50 | 2.19 | 0.39 | 0.92 | 115.25 | 2.09 | 0.50 | 1.00 |
| V03 | 0.14 | 0.43 | 55.50 | 1.70 | 0.32 | 1.00 | 108.00 | 1.91 | 0.50 | 1.00 |
| V06 | 0.55 | 2.16 | 88.25 | 1.06 | 0.75 | 2.57 | 108.75 | 1.13 | 0.37 | 1.70 |
| V07 | 0.90 | 5.67 | 104.25 | 2.78 | 1.51 | 7.06 | 183.00 | 3.37 | 0.50 | 1.00 |
| V08 | 0.28 | 0.35 | 70.50 | 0.76 | 1.20 | 3.37 | 167.25 | 3.40 | 0.50 | 1.00 |
| V09 | 0.27 | 1.06 | 70.50 | 1.82 | 0.80 | 4.18 | 121.25 | 1.47 | 0.40 | 1.50 |
| V10 | 0.13 | 0.64 | 55.25 | 0.53 | 0.73 | 2.38 | 142.25 | 0.79 | 0.50 | 1.00 |
| V11 | 0.27 | 0.91 | 69.50 | 2.98 | 0.38 | 1.55 | 105.75 | 3.12 | 0.46 | 1.17 |
| V12 | 0.27 | 2.03 | 69.50 | 1.22 | 0.28 | 2.22 | 93.00 | 1.32 | 0.44 | 1.27 |
| V13 | 0.31 | 0.69 | 72.50 | 3.21 | 0.56 | 2.08 | 108.50 | 4.25 | 0.40 | 1.50 |
| V14 | 0.36 | 1.30 | 76.50 | 0.35 | 0.28 | 2.78 | 86.25 | 0.70 | 0.41 | 1.44 |
| V15 | 0.12 | 0.56 | 53.25 | 1.31 | 0.35 | 1.04 | 111.50 | 1.95 | 0.50 | 1.00 |
| V20 | 0.53 | 3.70 | 87.50 | 1.81 | 1.06 | 6.87 | 146.25 | 3.74 | 0.44 | 1.27 |
| V21 | 0.62 | 4.10 | 92.25 | 1.76 | 0.86 | 5.74 | 151.50 | 3.53 | 0.50 | 1.00 |
| V22 | 0.49 | 4.45 | 85.50 | 1.32 | 0.62 | 4.51 | 136.00 | 1.92 | 0.50 | 1.00 |
| V23 | 0.15 | 0.83 | 57.00 | 1.38 | 0.47 | 2.51 | 123.00 | 1.98 | 0.50 | 1.00 |
| V24 | 0.28 | 0.92 | 70.25 | 1.79 | 0.36 | 2.15 | 108.25 | 1.73 | 0.48 | 1.08 |
| V25 | 0.22 | 0.73 | 65.00 | 0.82 | 0.32 | 1.39 | 108.00 | 1.11 | 0.50 | 1.00 |
| V26 | 0.36 | 1.60 | 76.75 | 0.76 | 0.42 | 2.14 | 120.00 | 1.97 | 0.50 | 1.00 |
| V27 | 0.33 | 0.80 | 75.50 | 2.45 | 0.35 | 1.86 | 114.50 | 3.99 | 0.50 | 1.00 |
| V29 | 0.52 | 2.34 | 89.25 | 1.96 | 0.90 | 3.33 | 152.50 | 2.78 | 0.50 | 1.00 |
| V30 | 0.31 | 1.66 | 73.25 | 1.56 | 0.32 | 1.67 | 76.25 | 1.64 | 0.34 | 1.94 |
| V32 | 0.59 | 2.68 | 90.50 | 2.60 | 0.59 | 2.68 | 90.50 | 2.60 | 0.33 | 2.03 |
| V33 | 0.83 | 4.80 | 101.25 | 1.22 | 1.46 | 8.91 | 143.75 | 1.63 | 0.39 | 1.56 |
| V34 | 0.52 | 1.61 | 86.50 | 1.90 | 0.62 | 1.90 | 97.00 | 2.06 | 0.35 | 1.86 |
The stellar mass of the galaxy, Ms, is the instantaneous mass in stars (after the appropriate mass-loss), measured within a sphere of radius 10 kpc about the galaxy centre. The effective radius Re is the three-dimensional half-mass radius corresponding to this Ms. Compactness is measured in terms of the stellar surface density within the effective radius or within the inner 1 kpc, Σe, and Σ1, respectively. In practice, for either r = Re or r = 1 kpc, we measure Σr = Ms(r)/(πr2), where Ms(r) is the stellar mass within a three-dimensional sphere of radius r, while observationally it is measured in two-dimensional projection along a given line of sight, using the two-dimensional half-mass radius. The surface density measured using the three-dimensional quantities turns out to be only a 10–20 per cent underestimate of the surface density observed in two dimensions for r = Re. The value of Σ1 is thus a 10–20 per cent underestimate when Re ∼ 1 kpc, and it is a better approximation when Re is significantly smaller than 1 kpc.
The SFR is measured within spheres of radius 10 kpc or 1 kpc, as the initial stellar mass (before mass-loss) in stars younger then Δt divided by Δt, for Δt = 60 Myr.6 In practice, in order to reduce fluctuations due to a ∼5 Myr discreteness in stellar birth times in the simulation, we average the SFR as deduced using different Δt values equally spaced (0.2 Myr) in the range Δt = 40–80 Myr. The specific SFR in the corresponding volume is simply sSFR = SFR/Ms.
Limitations of the current simulations
These simulations are state-of-the-art in terms of the high-resolution AMR hydrodynamics and the treatment of key physical processes at the subgrid level. In particular, they properly trace the cosmological streams that feed galaxies at high redshift, including mergers and smooth flows, and they resolve the VDI that governs the high-z disc evolution and the bulge formation (Ceverino et al. 2010, 2012; Ceverino et al. 2014a; Mandelker et al. 2014). AMR codes more accurately trace some of the high-resolution hydrodynamical processes involved in galaxy formation than SPH codes that use the traditional density formulation (e.g. Agertz et al. 2007; Bauer & Springel 2012; Scannapieco et al. 2012). They are comparable in accuracy to codes using modern formulations of smoothed particle hydrodynamics (SPH; Hopkins 2014; Schaye et al. 2015) or a moving unstructured grid (Bauer & Springel 2012), but implementations of the latter in a cosmological context have not yet reached the resolution currently achieved with AMR codes (a few hundreds of parsecs in resolution versus a few tens of parsecs in AMR).
Like other simulations, the simulations used in this paper are not yet doing the most accurate possible job in treating the star formation and feedback processes. For example, while the code now assumes an SFR efficiency per free-fall time that is more realistic than in earlier versions, it does not yet follow in detail the formation of molecules and the effect of metallicity on SFR (Krumholz & Dekel 2012). Furthermore, the resolution does not allow the capture of the Sedov–Taylor adiabatic phase of supernova feedback. The radiative stellar feedback assumed no infrared trapping, in the spirit of the low trapping advocated by Dekel & Krumholz (2013) based on Krumholz & Thompson (2013). On the other hand, other works assume more significant trapping (Krumholz & Dekel 2010; Murray, Quataert & Thompson 2010; Hopkins et al. 2012), which makes the assumed strength of the radiative stellar feedback still somewhat ad hoc. Finally, AGN feedback, and feedback associated with cosmic rays and magnetic fields, are not yet incorporated. As shown in Ceverino et al. (2014b), the SFR, gas fractions, outflow rates, and stellar to halo mass fractions are all in the ballpark of the estimates deduced from observations, providing a better match to observations than earlier versions of the art simulations, but this match is still only at the semi-quantitative level, with an accuracy at the level of a factor ∼2.
As a result of this non-perfect match, the dramatic events in the evolution of galaxies that concern us here may occur somewhat earlier than in the real Universe. In particular, we will see that compaction and onset of quenching occurs in some of our galaxies at very high redshifts, possibly too early. On the other hand, with some of the feedback mechanisms not yet incorporated (e.g. resolved supernova feedback and AGN feedback), full quenching to very low sSFR values is not fully materialized in many cases by the end of the simulation at z ∼ 1. We adopt the hypothesis that these inaccuracies are not of a qualitative nature, and assume that the simulations are accurate enough for acquiring a basic qualitative understanding of the phenomena of compaction and quenching and the processes that drive them. Indeed, comparisons of our simulation results to observations are very encouraging (Tacchella et al., in preparation).
Given that the quenching is not always complete in our simulations, partly because the quenching efficiency may be insufficient for complete, long-term quenching, we consider a partial reduction in sSFR as an indication of potentially complete quenching. For example, we identify quenching when the sSFR drops by an order of magnitude from its maximum value, or when it drops below a certain fixed value. In all such cases, we find that the decline rate of sSFR is faster than the overall decline rate of the ridge of the star-forming main sequence (MS) as defined below in equation (7), indicating that this is indeed a quenching process in progress. A companion paper will address in more detail the SFR and quenching with respect to the evolving MS (Tacchella et al., in preparation).
Additional analysis of the same suite of simulations, especially the properties of giant clumps in VDI discs, are discussed in Moody et al. (2014) and Snyder et al. (2014).
WET BULGE FORMATION
The in situ star formation in the central bulge is a measure of the wetness of bulge formation, namely gas contraction into the bulge at a rate faster than the SFR along the way (DB14). A large fraction of in situ star formation in the bulge would therefore be evidence for wet compaction and a blue-nugget phase. Given the typically low SFR in galactic spheroids at moderate and late redshifts, a high fraction of in situ SFR in high-z bulges is not at all obvious. We next describe how we identify the bulge stars at a given redshift. Then we trace the birthplaces of these stars, and compute the fraction of the stars that were born in situ in the bulge of the main progenitor. The remaining stars in the bulge either formed in the disc and migrated inwards to the bulge or formed ex-situ in other galaxies that have merged with the main galaxy.
Kinematic decomposition
A decomposition of the stellar component in every snapshot of each galaxy into disc and spheroid has been carried out based on kinematics (as in Ceverino et al. 2014a). We first define the spin axis of the galaxy using the stars within a face-on projected radius of 10 kpc. We then assign each stellar particle a ratio jz/jmax, where jz is the specific AM with respect to the galaxy centre along the spin axis, and jmax = rv is the maximum specific AM the star particle could have with its given energy at its distance r from the centre and with its given speed v. A star on a corotating circular orbit has jz/jmax = 1. Disc stars are selected with a cut of jz/jmax ≥ 0.7, while the remaining stars are assigned to the spheroid. The spheroid is further divided into a bulge and a halo based on the radial distance from the galaxy centre, where the bulge radius is defined as the half-mass radius of the stellar component of the galaxy, Re.
In situ star formation in the bulge
Fig. 1 shows the fraction of bulge stars that have formed in any of three different locations with respect to the main-progenitor galaxy, namely, (a) in the bulge itself (blue), (b) in the disc and migrated into the bulge (green), and (c) in external galaxies and joined the bulge via mergers (red). These fractions are averaged all simulated galaxies, and are shown in bins of redshift in the range z = 5–1. One can see that the fraction of in situ star formation in the bulge is high – it gradually declines from 62 per cent at z ∼ 5 to 44 per cent at z ∼ 1. This is a clear evidence for wet compaction, preferentially at high redshifts.
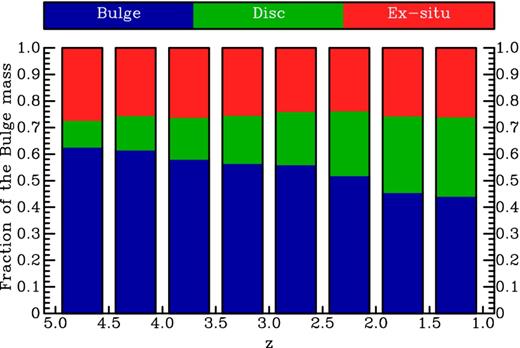
Wet bulge formation. Shown are the fractions of bulge stars at z according to their birth place with respect to the main-progenitor galaxy, averaged over all the simulated galaxies and snapshots in the sample. The bulge stars either formed in situ in the bulge (blue), or formed in the disc and migrated to the bulge (green), or formed ex-situ outside the main-progenitor galaxy and joined the bulge through a merger – major, minor or mini-minor (red). At z ∼ 2–3, more than half the bulge stars have formed in situ in the bulge, indicating a rather wet bulge formation.
We also see in Fig. 1 that the fraction of stars that formed ex-situ to the galaxy and joined the bulge by mergers is varying about 25 per cent. This reflects the slow evolution of accretion rate in a growing galaxy (Dekel et al. 2013), the slow growth of stellar fraction in the total accreted baryons (Oser et al. 2010), and the evolution of SFR in the disc and bulge. We also note in passing that the fraction of bulge stars that formed in the disc and migrated to the bulge, mostly by VDI-driven clump migration (e.g. Noguchi 1998; Bournaud et al. 2007; Dekel et al. 2009), is growing systematically from 10 per cent at z ∼ 5 to 30 per cent at z ∼ 1.
COMPACTION AND QUENCHING: PROTOTYPICAL CASES
Before we present the results for the entire simulated sample, we first study in this section the detailed evolution of eight individual galaxies from our sample. We will show that these galaxies all undergo phases of dissipative contraction followed by quenching attempts or full quenching. In the following section, we will use the entire sample to show that these phases are characteristic of the evolutionary pattern of high-redshift galaxies.
Massive galaxies
Figs 2 and 3 describe the evolution of eight example galaxies from our sample. The first four galaxies shown in Fig. 2 have relatively high stellar masses and they tend to compactify to higher densities and then quench rather efficiently, while the second four, shown in Fig. 3 are of lower masses, lower density at compaction, and more hesitant quenching that is commonly followed by a new compaction phase. The companion Fig. 4 is a cartoon summarizing the main features characterizing the evolution through compaction and quenching phases. Fig. 5 shows the corresponding evolution of the effective radius of these eight examples. Then Fig. 9 displays evolution tracks in the plane of effective radius and stellar mass for 12 galaxies that evolve through a nugget phase (including the eight default examples shown in previous figures).
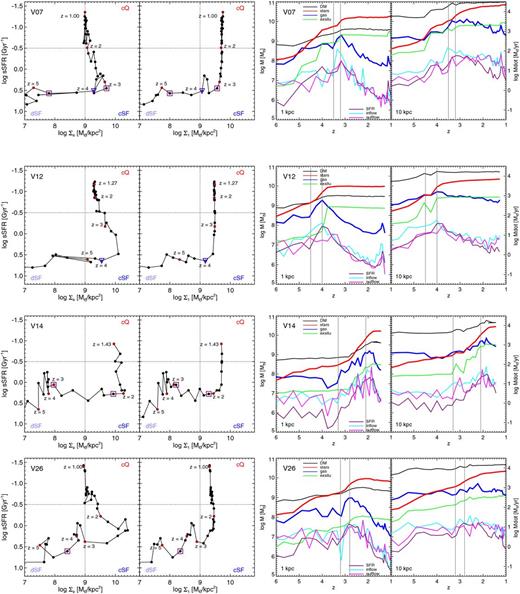
Evolution of four galaxies of relatively high stellar masses that compactify at relatively high redshift to a high central surface density and quench efficiently. Two left-hand panels: evolution tracks in sSFR and compactness as measured by Σe (left) and Σ1 (second from left). The redshifts from z = 5 to z = 1 are marked along the tracks by red symbols. Major mergers are marked by open blue upside-down triangles, and minor mergers by open purple squares. Two right-hand panels: evolution of mass and its rate of change inside a central sphere of radius 1 kpc (second from right) and 10 kpc (right). Shown at the top (scale along the left-hand axis) are the masses in gas (blue), stars (red), and dark matter (black). Also shown is the mass in ex-situ stars, as a merger indicator (green). Shown at the bottom (scale along the right-hand axis) are the rates of change of gas mass due to SFR (purple), gas inflow (cyan), and gas outflow (magenta). Each of these galaxies shows at least one well-defined compaction phase that is immediately followed by gas depletion and quenching. The onset of gas compaction in the central 1 kpc and the point of maximum central gas compaction are marked by vertical lines.
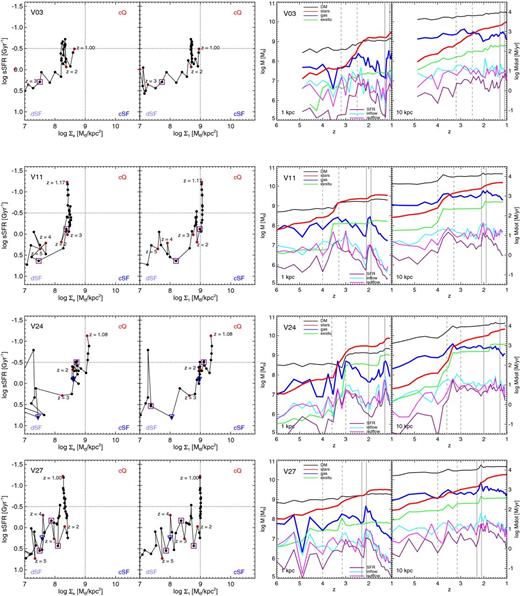
Same as Fig. 2, but for four galaxies of lower masses. The dashed vertical lines mark the onset and peak of earlier compaction events. These galaxies compactify to lower central densities and make more than one quenching attempt.
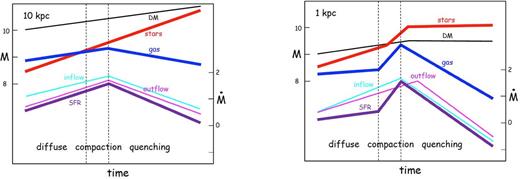
The three successive phases of diffuse galaxies, compaction and quenching in a cartoon based on the examples shown in the right-hand panels of Fig. 2 for the galaxies of high stellar mass (and to some extent also in Fig. 3 for the less massive galaxies). Shown is the characteristic evolution of mass and its rate of change in the central 1 kpc (left) and in the galaxy as a whole (out to 10 kpc, right). After an early phase of gradual mass growth and star formation, there is a well-defined, relatively short phase of wet compaction in the inner 1 kpc, reaching a peak of central gas density and SFR (a blue nugget). In the central kpc, this is immediately followed by a longer phase of gas depletion and quenching of SFR caused by a low rate of inflow to the centre compared to the sum of SFR and outflow rate. The result is a compact quenched galaxy (a red nugget), where the central stellar density remains roughly constant from the blue nugget phase and on. The whole galaxy typically quenches in a slower pace due to residual star formation in an extended gas ring.
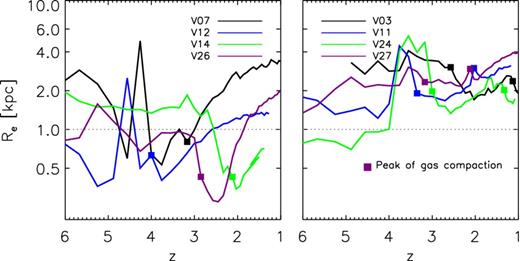
Evolution of the stellar effective radius Re for the eight example galaxies of Fig. 2 (left) and Fig. 3 (right). The effective radius tends to systematically grow in time from below 1 kpc to above it. The peaks of gas compactness are marked (squares) – they tend to be associated with local minima in Re.
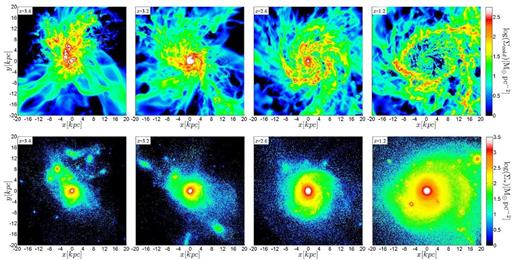
Compaction and quenching in V07. Shown are images of face-on projected density of the cold component made of gas and stars younger than 100 Myr (top) and of the stellar component (bottom), in a cubic box of side 40 kpc. The snapshots from left to right correspond to (a) prior to or during the compaction phase, (b) the blue nugget phase near maximum gas compaction, (c) the ‘green nugget’ phase during the quenching process, and (d) the red nugget phase after quenching. A BN with a dense core of gas and stars develops via dissipative compaction. It leads to gas depletion in the core while an extended ring develops. The dense stellar core remains intact from the BN to the RN phase, while in this case an extended stellar envelope develops around the RN core.
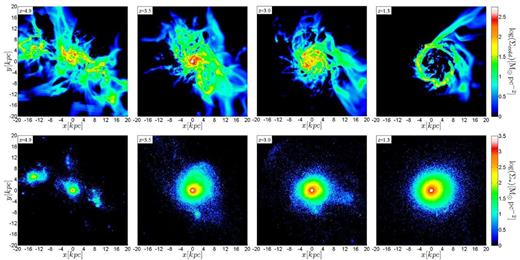
Same as Fig. 6, but for V12. In this case, a post-compaction gas ring develops, while the RN remains naked and similar to the BN.
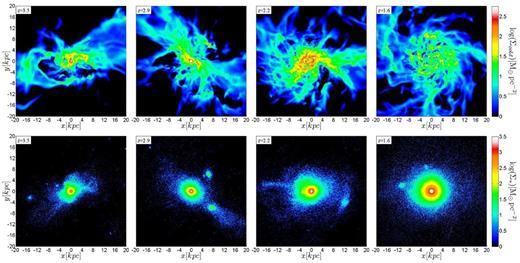
Same as Fig. 6, but for V26. Here, mergers do not play an important role. A late diffuse gas disc develops, and the stellar density profile grows both in amplitude and in extent from the BN to the RN phase.
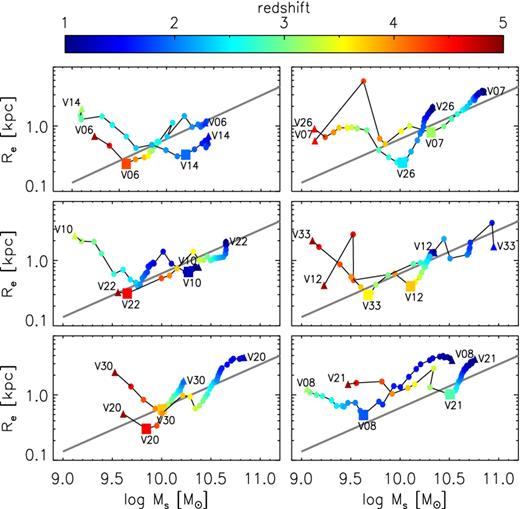
Evolution tracks of galaxies in the mass–radius plane, with respect to the line adopted in Barro et al. (2013) to identify compact galaxies in observations, |$M_{\rm s}/R_{\rm e}^{1.5} \ge 10^{10.3} \,\rm{M}_{\odot }\,{\rm kpc}^{-1.5}$|. Redshift along each track is marked by colour. The beginning and end of each track are marked by triangles and the galaxy name. The points of maximum gas compactness are marked by squares, indicating the peak of the blue-nugget phase. The 12 galaxies shown (out of 26) go through a compact, nugget phase during the given redshift range, consistent with the compactness of observed blue nuggets.
We first focus on Fig. 2, showing the evolution of four massive galaxies that compactify to high densities and quench efficiently. The left-hand panels show the evolution tracks of these galaxies in diagrams of sSFR (increasing from top to bottom) versus central compactness. This diagram is a proxy for diagrams commonly used to present observational results for samples of galaxies in given redshift bins (e.g. Barro et al. 2013). In the left-most panel, compactness is measured by the effective stellar surface density Σe within the effective (half-mass) radius Re. In the second panel from the left, compactness is measured by the stellar surface density within the inner 1 kpc, Σ1. One can see in Fig. 5 that the effective radius is of the order of 1 kpc (to within a factor of 3) in most of our galaxies and most of the times; it tends to grow systematically with cosmological time from below 1 kpc to above it, and it typically fluctuates during compaction events. Therefore, the two left-hand panels of Fig. 2 provide complementary information.
In the selected examples shown in Fig. 2, we see that the evolution tracks have a characteristic L shape in the sSFR–Σ plane. At early times, the galaxy is in a diffuse phase where it forms stars at a low surface density, Σ1 ∼ Σe ∼ 108 M⊙ kpc−2. Then there is a rather quick compaction to a maximum surface density at Σ1,max ∼ 109.7 and Σe,max ∼ 1010 M⊙ kpc−2. At this point there is a sharp onset of quenching, followed by a continuous decline in sSFR by 1–2 orders of magnitude while Σ1 remains high. A similar behaviour is seen both for Σe and Σ1, except that during the quenching phase Σ1 remains rather constant while Σe tends to gradually decline, reflecting the systematic growth of Re.
In all such cases, the decline rate of sSFR is faster than the overall decline rate of the ridge of the star-forming MS as defined below in equation (7), indicating that this is indeed a real quenching process.
In all four galaxies shown in Fig. 2, we identify the appearance of a characteristic pattern, which occurs in the different galaxies at different times, and sometimes more than once in the spanned period of evolution. This pattern is schematically summarized in the cartoon shown in Fig. 4, referring to the evolution of M and |$\dot{M}$| as in the right-hand panels of Fig. 2.
We focus first on the evolution of gas and stellar mass within 1 kpc. There is an early phase where the gas mass is constant or growing very slowly, and where the stellar mass is growing at a slow pace, reflecting continuous star formation in the central 1 kpc (blue and red curves, respectively). The sSFR is therefore constant or rising slowly. Take, for example, V14, where the gas mass in Fig. 2 is ∼ constant until z = 3, and the stellar mass (red) grows slowly during this time. One can see that the SFR (purple) is also approximately constant during this period.
At a certain point in time, one can identify a beginning of a faster growth rate for the gas mass – this is the onset of the gas compaction phase. It is marked by a vertical grey line for each galaxy in the right-hand panels of Figs 2 and 3, where a second line marks the peak of gas compactness. The gas compaction starts at z ≃ 3.5, 4.5, 3.3, 3.2 for V07, V12, V14, V26, respectively. Then, the central gas mass grows quickly by an order of magnitude or more, reaching a peak at a certain time, after which it begins to continuously drop. This occurs at z ≃ 3.2, 4.0, 2.1, 2.8 in V07, V12, V14, V26, respectively. The steep decline in gas mass is associated with a similar decline in SFR, namely this peak marks the onset of the central quenching phase, where the central region is becoming devoid of gas.
The central stellar mass typically shows analogous features that occur following the growth of the central gas mass, with a certain time delay between the two. The stellar compaction typically starts a little later than the gas compaction, and the stellar mass growth during the compaction is typically slower than the gas mass growth. The stellar compaction reaches a maximum density at a slightly later time than the gas density peak, after which the central stellar mass within the inner 1 kpc remains rather constant at an asymptotic value. The qualitative behaviour of the stellar mass compared to the gas mass is naturally expected if the compaction is driven by gas dissipation and given that the gas continuously turns into stars at a high rate, and more so as the system becomes more compact. The evolution of effective radii shown in Fig. 5, where the peaks of gas compactness are marked, indicates a correlation between maxima in core gas density and minima in stellar effective radius, though the correspondence is not always one-to-one.
Before and during compaction, the inflow rate (cyan) tends to be significantly larger than the SFR (purple). This indicates that the compaction is wet, as expected.
One can see in these figures that the overall SFR follows the total gas mass, both in the central 1 kpc and in the whole galaxy. A local relation between gas density and SFR is built into the simulations, and we see that it translates to this global scaling (Elmegreen 1997; Silk 1997; Kennicutt 1998). The peak of gas compaction coincides with a peak in central SFR, and the subsequent decline of gas mass is associated with a similar decline in SFR. During the compaction phase, the sSFR keeps a roughly constant high level. Beyond the SFR peak, reflecting the constancy of the central stellar mass, there is a continuous decline in sSFR, namely quenching.
In the vicinity of the SFR peak, the rates of inflow and outflow from the central region also tend to peak, and from then onwards, throughout the quenching phase, they are all declining and remain comparable to each other. In particular, near the onset of quenching and somewhat after it, there is marginal evidence for certain enhancement of the outflow rate compared to the inflow rate, but no evidence for a dramatic burst of outflow that could serve as the dominant driver of the quenching. The onset of central quenching is due to the tilt of the balance from a state where the inflow to the centre is dominant to a state where the inflow rate is insufficient for balancing the sum of SFR and outflow rate, which naturally leads to depletion.
We note that during compaction the central region makes a drastic transition from being dominated by the dark matter to becoming governed by the self-gravitating baryons. This can be seen by comparing the red and black curves in the second-from-right panels of Figs 2 and 3. The fact that the quenching occurs in the self-gravitating phase may be an important clue for the origin of quenching, to be discussed in Section 7.
The right-most panels of Fig. 2, referring to the whole galaxy within 10 kpc, show that the overall SFR also reaches a peak at the same time as the SFR in the inner 1 kpc, and the whole galaxy is also gradually quenching from the SFR peak onward. However, in this post-compaction phase, the overall SFR quenching rate is slower than the inner quenching, with the gas mass declining even slower, reflecting the development of an extended gaseous ring forming stars around the quenched bulge (see images in Figs 6–8). This implies that the quenching process in the post-compaction phase progresses inside-out (see a detailed analysis in Tacchella et al., in preparation). This is consistent with preliminary observational indications for inside-out quenching based on sSFR profiles of a sample of galaxies at z ∼ 2.2 (Tacchella et al. 2015).
In the left-hand panels of Fig. 2, major mergers (with stellar mass ratios larger than 1: 3) and minor mergers (1: 10 to 1: 3) are indicated by open blue upside-down triangles and open purple squares, respectively. These are based on merger trees described in Tweed et al. (2009) and Tweed et al. (in preparation). Another merger indicator is provided by jumps in the evolution of mass in ex-situ stars, those that formed outside the galaxy, shown in green curves in the right-hand panels, especially within the whole galaxy. The merger times are identified by the two indicators only in a crude way. The role of mergers seems to be different in the different galaxies and at different times. For example, galaxy V07 has a major merger prior to z ∼ 4, which may or may not be associated with the onset of compaction at z ∼ 3.5. It then has a minor merger prior to z ∼ 3, which may be associated with either the compaction or the quenching. In V12, there is no major or minor mergers that could trigger the compaction, but there is a major merger near z ∼ 4, which may be associated with the onset of quenching. Galaxy V14 has a minor merger near z ∼ 3 that could trigger its long-term compaction, and another minor merger just prior to z ∼ 2 that could be associated with the onset of quenching. Finally, V26 does not show evidence for major or minor mergers associated with the compaction or the quenching. It thus seems that the compaction and quenching could be triggered by one of different mechanisms, including major mergers in a fraction of the cases, minor mergers in another fraction, and something else, possibly related to counter-rotating streams or recycled inflows and possibly associated with VDI in a third fraction of the cases. We will return to the role of mergers and VDI in compaction and quenching in Section 7.
Less massive galaxies
Fig. 3 shows the evolution of four galaxies of lower stellar mass that end their compaction and start their final quenching at lower central surface densities, near Σ1 ≃ 109 M⊙ kpc−2. These galaxies do go through events of compaction followed by quenching, similar to the characteristic chain of events seen in the high-Σmax examples shown in Fig. 2. However, in the low-mass, low-Σmax cases these events tend to occur at later redshifts, and the L-shape evolution track is more fluctuative. In particular, the quenching is less decisive: the sSFR fluctuates down and up several times before it eventually quenches beyond the green valley.
An inspection of Fig. 5 indicates that while the massive galaxies that compactify earlier do so to effective radii smaller than 1 kpc, the effective radii of the low-mass galaxies that compactify later tend not to drop to below 1 kpc.
Images and compactness of blue and red nuggets
Figs 6 to 8 show two-dimensional images of the density of the cold component of gas and stars younger than 100 Myr and of the stellar density at four snapshots in the history of three of the massive galaxies, V07, V12, and V26. The cold component of the disc refers to the mass that is directly involved in VDI, which is typically roughly twice the gas mass alone. The cold mass density could serve as a crude proxy for the density measured from Hα or UV observations. The projections are face-on in a cubic box of side 40 kpc. The four snapshots correspond to (a) prior to or during the early stages of compaction, (b) the peak blue-nugget phase near maximum compaction and beginning of quenching, (c) the green-nugget phase during the quenching process, and (d) the red-nugget phase after quenching.
The pre-compaction phase is characterized by a clumpy gas appearance, typically associated with a major merger (V12), minor mergers (V07), and no mergers (V26).
The blue-nugget phase shows a high gas density associated with a high stellar density in the inner 1 kpc, with only low-density gas left at large radii.
The quenching phase is characterized by a massive, centrally condensed stellar bulge, which may gradually grow a more diffuse stellar envelope (V07). The gas is gradually depleted from the central regions while fresh incoming gas may develop an extended unstable gas ring (V07, V12) or a diffuse disc (V26). We should comment that these post-quenching phenomena might be suppressed when stronger feedback is implemented, e.g. when AGN feedback is added.
To what extent do the simulated blue and red nuggets match the compactness of observed nuggets? Barro et al. (2013) defined the locus of compact galaxies in the mass–radius plane by the threshold line (in log–log) |$M_{\rm s}/R_{\rm e}^{1.5} \ge 10^{10.3} \,\rm{M}_{\odot }\,{\rm kpc}^{-1.5}$|. Fig. 9 shows evolution tracks of simulated galaxies in this plane with respect to the observational threshold line. One can see that each of the 12 galaxies shown goes through a compact nugget phase as defined by the observational threshold. Thus, in terms of compactness, a significant fraction of the simulated nuggets are in the ball park of the observed nuggets. In other cases, especially involving low-mass galaxies, a similar wet compaction process leads to a compact SFG that also deserves to be termed a ‘blue nugget’. Thus, the simulated evolution allows us to define the BN phase as the product of a wet-compaction process rather than by an absolute threshold for an instantaneous compactness measure. This should enable us to propose a more physically motivated definition for BNs based on their observed properties.
Kinematics of compacting galaxies
The process of compaction outlined so far is expected to be associated with a drastic change in the morphology and the kinematics of the galaxy. When the galaxy is not resolved observationally, an interesting observable is the line-width, for gas or stars, which may reflect either rotation or velocity dispersion or both. As a proxy for line-width, we compute σlos, the mass-weighted velocity dispersion along a given line of sight, through a cylindrical beam of diameter 8 kpc about the galaxy centre (corresponding to ∼1″). Fig. 10 shows the average and standard deviation of σlos over 64 random directions for the gas and for the stars in the four example massive galaxies examined in Fig. 2. The gas and stellar σlos roughly evolve together. In the early diffuse phase, the galaxies all have low values of σlos ∼ 50 km s−1, slowly increasing with time in V12 and V26. During the compaction phase, σlos rises steeply to peak values of ∼150–200 km s−1. Following the point of maximum gas compactness, the σlos settles to a level of ∼150 km s−1 that remains roughly constant during the quenching phase. This velocity is in the ballpark of the circular velocity in the given potential well, namely the halo virial velocity. The scatter between different lines of sight is rather small prior to compaction, and is only ∼± 25 per cent after the compaction. These results are consistent with the observed linewidths for galaxies in the different distinct phases (van Dokkum, Kriek & Franx 2009; Barro et al. 2014b; Nelson et al. 2014). We note that in the post-compaction phase the linewidth of the stars is on average ∼30 per cent higher than that of the gas, and it can be almost a factor of 2 higher in some cases. This is an indication for rotational support in the gas, with a significantly higher rotation-to-dispersion ratio than for the stars, as explained next.
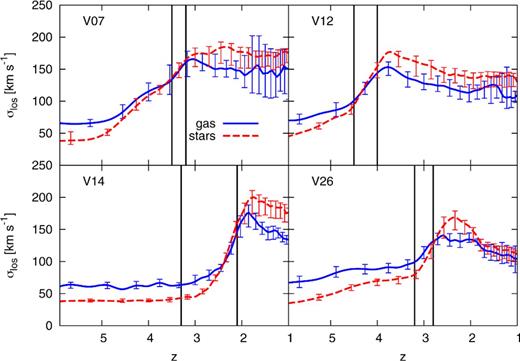
The evolution of line-of-sight velocity dispersion, through a beam of diameter 8 kpc, averaged over random directions with the standard deviation shown, for gas (blue) and for stars (red). Vertical lines mark the onset of gas compaction in the central 1 kpc and the time of maximum gas density inside this volume. The velocity rises steeply during the compaction phase from ∼50 km s−1 to 150–200 km s−1, and then levels off at ∼150 km s−1, roughly the circular velocity of the given potential well.
The line-of-sight velocity dispersion originates both from systematic rotation and three-dimensional velocity dispersion. In the simulations, we can follow separately the evolution of these components of the velocity field, both for gas and for stars, as shown in Fig. 11. The rotation velocity is the tangential velocity component Vϕ in cylindrical coordinates aligned with the galaxy AM vector, mass-weighted averaged over a cylinder of radius 4 kpc and height ±2 kpc. The radial velocity dispersion σr about the average rotation velocity is computed within the same cylindrical volume. We find for the stars that the velocity dispersion dominates over the rotation velocity during the compaction and BN phase, but they become comparable to each other in the subsequent compact state during the quenching phase; the rotation becomes larger for V07 and V12, but the dispersion remains larger in V14 and V26. Thus, for the stars, Vϕ/σr ∼ 1. We recall that the model of DB14 for wet compaction in VDI indeed predicted that the star-forming compact galaxies should develop a high velocity dispersion, Vϕ/σr ≤ 2. On the other hand, the post-compaction gas component is dominated by rotation, with a post-compaction ratio of Vϕ/σr ∼ 2 − 5.
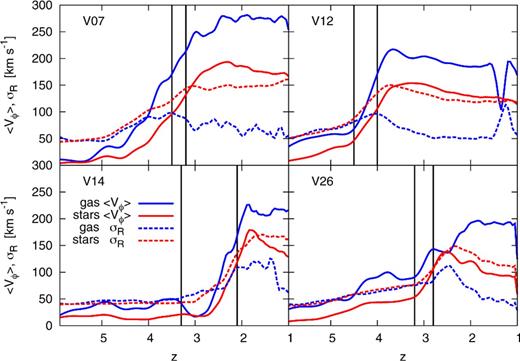
The evolution of rotation velocity and radial velocity dispersion, mass-weighted averaged within the central 4 kpc, for gas and for stars. The velocities were averaged across three consecutive snapshots. Vertical lines mark the onset of gas compaction in the central 1 kpc and the time of maximum gas density inside this volume. In the compact phase, the stellar rotation velocity and velocity dispersion tend to become comparable, while the gas tends to be rotation dominated.
PROPERTIES OF THE EVOLVING SAMPLE
We now turn to the whole sample of galaxies as it evolves in time, and address relevant galaxy properties and correlations between them, which may shed light on the processes of compaction and quenching. This allows comparisons to observations, where one should recall that we are following here an evolving sample, where the masses systematically grow in time, while the observed samples may be selected according to different criteria, e.g. at a fixed mass. The study of the evolving sample also allows comparisons to the model predictions by DB14.
sSFR versus compactness
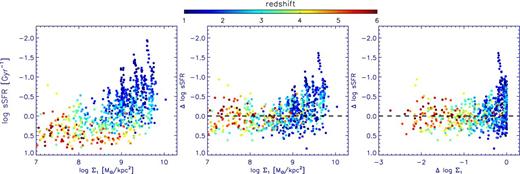
Fig. 12 shows how the galaxies populate the Σ–sSFR diagrams in four redshift bins between z = 6 and z = 1. All the outputted snapshots for all the simulated galaxies are shown. This diagram is a proxy for the similar diagrams commonly used to present observational results (e.g. Barro et al. 2013), where the vertical axis is a measure of sSFR (increasing from top to bottom) and the horizontal axis is a measure of central compactness. Like in Figs 2 and 3, here we refer to two such measures, Σ1 and Σe. We distinguish between diffuse and compact galaxies at Σ = 109 M⊙ kpc−2 and between SFG and quenched galaxies at sSFR = 0.3 Gyr−1, thus dividing each figure into four quadrants. The distribution of our simulated galaxies in the Σ–sSFR plane at the different redshift bins qualitatively resembles the observational results based on the CANDELS survey at z = 1.4–3 (Barro et al. 2013, 2014a,b).
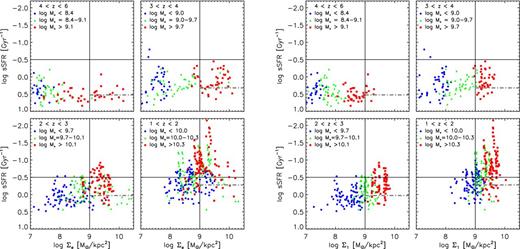
Time evolution of the simulated galaxy sample in the plane of sSFR and compactness. The compactness is measured by the stellar surface density either within the effective radius (Σe, left) or within 1 kpc (Σ1, right). The snapshots are divided into four redshift bins. In each redshift bin, the sample is divided by mass to three subsamples with a third of the galaxies in each (lowest mass blue, highest mass red). The solid lines crudely distinguish between diffuse and compact galaxies (vertical line) and between SFGs and quenched galaxies (horizontal line). The horizontal dot–dashed lines mark the ridge of the MS according to equation (7), evaluated at the median redshift and mass of the massive galaxies in the given redshift bin (the red points). The evolution is from diffuse to compact SFGs (‘blue’ nuggets), and then to compact quenched galaxies (red nuggets). The more massive galaxies evolve earlier.
We see that at z > 4 all the galaxies are SFG, with sSFR ≥ 1 Gyr−1, and most of them are diffuse, namely they populate the lower-left quadrant. Σe is typically larger than Σ1 because Re < 1 kpc. By z = 3, more of the SFGs have undergone compaction, populating the lower-right quadrant, while some galaxies have already started their quenching process to lower sSFR and can be found near the ‘green valley’, which we quite arbitrarily identify with sSFR∼0.3 Gyr−1. The values of Σe reach higher values than Σ1 since Re is still smaller than 1 kpc. At z = 2–3 most of the galaxies in our evolving sample are in the blue-nugget quadrant, star-forming and compact, while several of the compact galaxies have already crossed the green valley in their quenching process.
Finally, at z = 1–2, a large fraction of the galaxies have quenched, most to compact red nuggets. We note that there is no one single value of Σ where quenching occurs – different galaxies in our sample quench at different densities, spanning a range of ∼0.8 dex in Σ1 and ∼1.3 dex in Σe. When using Σ1 as the measure of compactness, the top-left quadrant remains empty, as there is almost no quenching directly from the diffuse stage and no significant de-compaction during the quenching phase. This is not the case for Σe, which at late times, when Re is growing above 1 kpc, refers to a larger and growing volume and therefore to lower and decreasing densities. Recall that the quenching in our simulations may be incomplete because of the potential absence of additional sources of feedback, such as AGN feedback, so galaxies that have reached sSFR values significantly below the green valley, say sSFR <0.16 Gyr−1, may be considered practically quenched.
A universal track of evolution in the sSFR–Σ1 plane. All snapshots of all galaxies, each represented by a point, are put together with the redshift marked by colour. Left: the raw data from Fig. 12. Middle: the sSFR is scaled, showing the deviation from the ridge of the main sequence as defined in equation (7). Right: in addition, the values of Σ1 for each galaxy are scaled to match all other galaxies at the same Σ1,max. The galaxies evolve along a universal L-shape track with a small scatter, first along a horizontal branch corresponding to the star-forming main sequence, and then, after the blue-nugget phase, along a vertical, quenching branch. The scatter about the horizontal branch is ±0.25 dex, and the scatter about the vertical branch is 0.24 dex and 0.08 dex in the middle- and right-hand panels, respectively.
By comparing in Fig. 12, the sSFR of the massive galaxies (marked red) with the ridge of the MS from equation (7) (dashed line), one can see that in the cases that are considered quenched by our fixed sSFR threshold criterion, the decline rate of sSFR is faster than the overall decline rate of the ridge of the MS, indicating that this is indeed a real quenching process (see also Fig. 18 in Section 6.1 below).
The galaxies in each redshift bin of Fig. 12 were divided into three mass bins of equal numbers in each, marked by different colours.7 We immediately notice that the more massive galaxies evolve earlier – they compactify earlier and quench earlier. They start at higher central densities, and compactify to higher Σ1 values at which they start and pursue their decisive quenching process to low sSFR values. The galaxies of lower masses evolve later through a similar pattern, with the main difference being that after compaction they reach smaller maximum Σ1 values, and sometimes attempt to quench at relatively low central densities. In terms of Σe, many of the low-mass galaxies tend to quench into the top-left quadrant of Fig. 12. While these galaxies may not be above the Σ threshold commonly used to define ‘nuggets’, they are not qualitatively different, as they also underwent compaction-triggered quenching.
The evolution of the distributions of galaxies in the quadrants of Fig. 12 is quantified in Figs 14 and 15. Fig. 14 shows in the same redshift bins the probability distributions of (a) Σ1 (left) in the two SFG phases (lower quadrants of Fig. 12), and (b) sSFR (right) in the two compact phases (right quadrants of Fig. 12). The Σ1 distribution gradually evolves to larger densities, from being diffuse-dominated at z > 4 to compact-dominated at z < 3, as observed (Barro et al. 2013, 2014a). The SFGs show a bimodality in Σ1 at z > 3, as predicted by DB14. The reason is that once the pre-compaction galaxy is gas-rich enough, with a gas surface density above a ‘wetness’ threshold, a quick compaction occurs before most of the gas turns into stars and Σ1 becomes higher, evacuating the gap near Σ1 ∼ 108–109 M⊙ kpc−2. We notice, again, that the more massive galaxies compactify earlier and to higher densities. The sSFR distribution shifts to lower values starting at z ∼ 3.
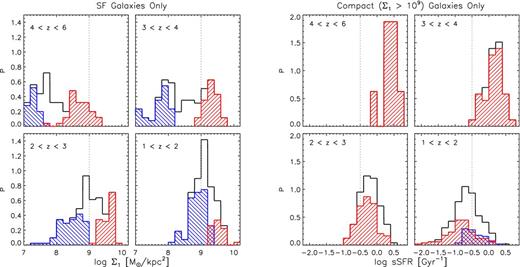
Probability distributions following Fig. 12, at the same redshift bins and mass bins (blue and red corresponding to the lowest and highest thirds by mass, respectively). Left: distribution of Σ1 for star-forming galaxies (sSFR > 0.3 Gyr−1). Right: distribution of sSFR for compact galaxies (Σ1 > 109 M⊙ kpc−2). A bimodality is indicated in the distribution of Σ1 at z ≥ 3. This distribution is gradually shifting in time towards higher Σ1. Galaxies in the higher mass bin compactify earlier, and quench earlier, while galaxies of the lower mass bin compactify only after z ∼ 2. The sSFR distribution of the compact galaxies is shifting towards lower values at z < 3.
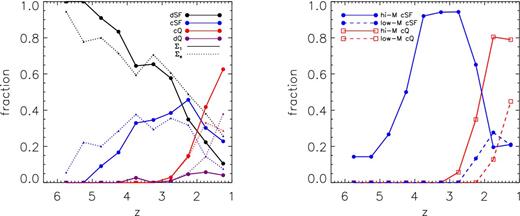
Time evolution of fractions of different components, following Fig. 12. Left: fraction of galaxies in each quadrant, with the compactness defined either by Σ1 (solid) or by Σe (dotted). The fraction of diffuse SFGs (black) is declining in time, at the expense of the gradual growth of the compact fraction (blue plus red). The fraction of compact SFGs (blue) is increasing in the range z = 5–2.5, and the fraction of compact quenched galaxies (red) is increasing after z = 3. The fraction of galaxies that quench to the diffuse quadrant (purple) is negligible when defined by Σ1, but not so with respect to Σe. Right: for each of the high-mass (solid lines) and low-mass (dashed lines) bins, the fractions of compact-SFG and of compact-quenched. The more massive galaxies become compact-SFG earlier and quench earlier.
Fig. 15 summarizes the time evolution of the fractions of galaxies in the different quadrants of Fig. 12. We see in the left-hand panel that the fraction of diffuse SFGs (black) is gradually declining in time. This is compensated by a growth in the fraction of compact galaxies, both star-forming and quenched (blue plus red). The fraction of compact SFGs (blue) is increasing in the range z = 5–2.5 and decreasing after z = 2.5, while the fraction of compact quenched galaxies (red) is negligible prior to z = 3 and is increasing steeply after z = 3. When compactness is measured by Σe, the fraction of compact SFGs is rather flat between z = 4.5 and 2.5, because Re is systematically growing in that period. The fraction of galaxies that quench to the diffuse quadrant (purple) is negligible when defined by Σ1, but not so with respect to Σe. The right-hand panel of Fig. 15 distinguishes between the highest and lowest mass bins. For each mass bin, it shows the evolution of the fractions of compact-SFG and compact-quenched galaxies. It clearly demonstrates that the more massive galaxies become compact-SFG earlier and quench earlier.
Characteristic times
Fig. 16 shows the characteristic times (and corresponding redshifts8) for compaction and quenching for our simulated galaxies. In the left-hand panels, the times are based on the gas density within the central 1 kpc (e.g. the blue line in the second-from-right panels of Figs 2 and 3). The three times refer to (a) the onset of gas compaction, tcom (blue circles), where the gas density growth rate steepens abruptly, (b) the peak of gas density, tmax (green squares), where the gas compaction ends and the quenching starts, and (c) the quenching time tque (red triangles), when the gas density has dropped by a factor of 10 from its maximum value. In the right-hand panels, the times are based on sSFR (e.g. the left-hand panels of Figs 2 and 3). The two times refer to (a) the first crossing of the green valley (green circles), defined at sSFR = 0.3 Gyr−1, and viewed as the first quenching attempt, and (b) the successful quenching (red squares), where the sSFR drops below 0.16 Gyr−1. Two galaxies are omitted from the right-hand panels (V34 and V13) because they have not reached the green valley by their last snapshots (z = 1.86 and z = 1.5). Squares with arrows mark lower limits to the successful quenching time, in cases that have not successfully quenched by the final snapshot of the simulation. Some of the galaxies have several periods of compaction in the redshift range studied, but here we pick only one of these compaction events, tending to identify the one where the central gas density reaches the highest peak value, and favouring the latest compaction event prior to the last snapshot of the simulation (which is typically z = 1).
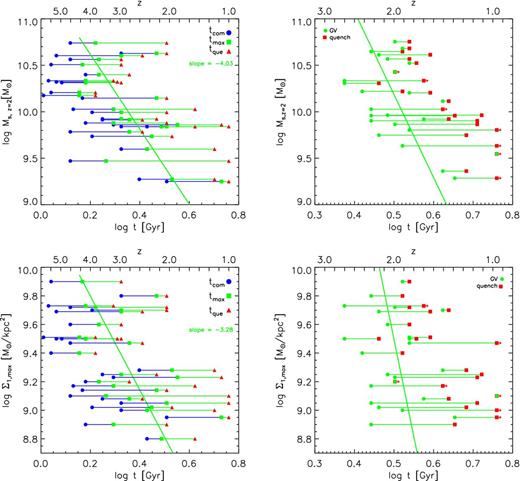
Characteristic times for compaction and quenching within the inner 1 kpc versus the stellar mass at z = 2 (top) and versus maximum stellar surface density (bottom) Left: based on the gas density, the three times refer to (a) the onset of gas compaction, tcom (blue circles), (b) the maximum gas density where the compaction ends and the quenching starts, tmax (green squares), and (c) the quenching time tque (red triangles), when the gas density has dropped by a factor of 10 from its maximum. Right: based on sSFR, the two times refer to (a) the first crossing of the green valley at sSFR = 0.3 Gyr−1, and (b) the successful quenching beyond sSFR = 0.16 Gyr−1. Arrows mark lower limits to the quenching time, in the seven cases that have not successfully quenched by the final snapshot of the simulation.
The onset of compaction occurs in the range t = 1–2.7 Gyr (z = 5.7–2.5). The compaction typically takes 0.5–1 Gyr. The end of compaction and beginning of quenching typically happens in the range t = 1.4–3.5 Gyr (z = 4.4–1.9). The first crossing of the green valley occurs in most cases in the range t = 2.4–4.5 Gyr (z = 2.8–1.5), and successful quenching is achieved after t = 2.8 (z = 2.4) and possibly only after t ∼ 6 Gyr (z ∼ 1). The quenching process can take anywhere between half a Gyr to several Gyrs. As a rule of thumb, the typical duration of the compaction and the quenching events is roughly a constant fraction of the Hubble time, (0.3–0.4) t.
In Fig. 16, the galaxies are ranked along the vertical axis either by their stellar mass at z = 2 (top) or by their maximum central stellar surface density Σ1,max (bottom), which characterizes the central density of that galaxy during the whole quenching process. We see a clear trend of the characteristic times with galaxy mass and with Σ1,max, showing that more massive galaxies evolve earlier and to higher maximum central densities. A similar trend exists with respect to halo mass (not shown here). The most massive galaxies in our sample typically start compaction at t = 1–1.5 Gyr (namely by z = 4), and compactify within less than 0.5 Gyr. They then immediately start quenching, and most of them successfully quench by t = 3.7 (z = 1.8). The least massive in our sample start compaction at t = 1.5–2.7 Gyr (z = 4–2.5), and compactify within 0.5–1 Gyr, sometimes over a longer period. The quenching process of the least massive galaxies can take between 1 and 3 Gyr. This is consistent with the less-massive examples shown in Fig. 3, where the quenching tends to be indecisive. In these galaxies, the sSFR fluctuates down and back up, representing several quenching attempts, each followed by a recurrent compaction and star formation episode. (This will be discussed in the context of halo quenching in Section 6.)
The fact that similar trends are seen as a function of mass and of maximum central density is a manifestation of the strong correlation between the two during the SFG phase (to be discussed in Section 6). Also worth noting in the bottom panels of Fig. 16 is that the quenching does not occur at a very specific value of Σ1 but rather in a range of values, between 109 and 1010 M⊙ kpc−2 for the given sample, though this range can possibly be considered as not very broad. This corresponds to a comparable range of values for Ms at quenching (Section 6).
Pre-compaction spin and sSFR
The model for wet contraction by DB14 suggested an anticorrelation between the compactness of blue nuggets and the pre-compaction spin parameter of their gas disc. The idea is that galaxies with a low initial spin start with a high surface density gas disc, which implies a high wetness parameter. This means that the gas is driven into the centre of the galaxy before it turns into stars, leading to a high central density in these galaxies. This is tested in Fig. 17, which shows, for all of the galaxies in our sample, the pre-compaction spin parameter λ of the cold gas (T < 105K) within the disc radius, against the maximum value of stellar surface density within 1 kpc, Σ1,max. The spin parameter is taken to be the average over the three consecutive output times prior to the onset of gas compaction. The latter is identified visually as the last sharp upturn in the slope of the growth curve for the gas mass inside 1 kpc as a function of time (see Figs 2 and 3), referring to the latest compaction event that leads to the maximum stellar density Σ1,max. Details on how the spin parameter is computed in a given snapshot are provided in Danovich et al. (2014). We indeed see a significant anticorrelation between the two quantities, with a log slope −0.29 and a correlation coefficient R = −0.81. Also shown, marked by colour, is the stellar mass at the time when Σ1,max is obtained. It shows an anticorrelation between λ and Ms, with a similar slope. This is consistent with the tight linear scaling of Σ1 with Ms for all the simulated galaxies at all redshifts, as discussed below in Section 6.1.
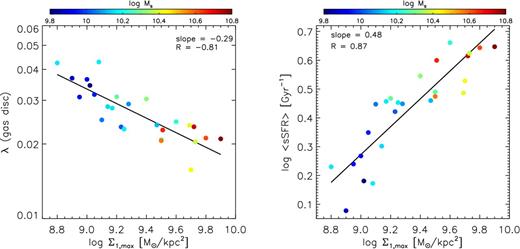
Properties of galaxies in the pre-compaction phase against the maximum value of stellar surface density Σ1,max that is reached after compaction. The colour refers to stellar mass at the time when Σ1,max is reached. Left: the spin parameter λ of the cold gas (T < 105K) within the disc radius. Right: the average sSFR. There is an anticorrelation between λ and Σ1,max and between λ and Ms, and there is a correlation between sSFR and Σ1,max and between sSFR and Ms, as predicted by the model of DB14.
The model of DB14 predicts the mass and redshift dependence of λ and Σ1,max, in their equation 15 (with equations 18 and 22) and equation 29, respectively. From the bottom-left panel of our Fig. 16, with Ms ∝ Σ1, one can deduce a relation between the redshift and stellar mass at Σ1,max, approximately |$1+z \propto M_{\rm s}^{0.22}$|. Inserting this in the equations of DB14, using the scaling relations (their equations 18 and 20) in the high-mass regime (Mv ∼ 1011.5−12.5 M⊙), one obtains at Σ1,max the scaling |$\lambda _{w=1} \propto \Sigma _{{\rm 1,max}}^{-0.54} \propto M_{\rm s}^{-0.67}$|. This is qualitatively consistent with the trends seen in Fig. 17, where the differences in slopes reflects the crudeness of the DB14 toy model and measurement uncertainties in the simulations.
The DB14 model also implies a correlation between the central density at maximum compaction and the pre-quenching sSFR. The idea is that a higher sSFR is associated with a higher gas surface density, which is associated with a higher value of w, and thus a wetter compaction, leading to a higher Σ1,max. For testing this prediction, Fig. 17 displays the average sSFR during the pre-compaction phase (as defined above) versus Σ1,max. It shows a correlation between the two quantities, as expected, with a log slope 0.48 and a correlation coefficient R = 0.87. As already noted based on Fig. 16, the higher values of Σ1,max, and therefore the higher values of sSFR, tend to be associated with compaction at an earlier redshift. This is consistent with having a higher gas density at earlier epochs, both because the Universe was denser and because the gas fraction was systematically higher.
We can thus characterize the evolutionary tracks of galaxies during compaction and quenching by a number of correlated properties: the wetness of the pre-compaction phase, the duration of the shrinkage, the SFR in this phase, the central surface density at the peak of compaction, and the efficiency of the quenching process. The high-mass, high-Σmax, high-sSFR tracks tend to be associated with high-redshift compaction (Figs 12, 14, and 16) and/or with low pre-compaction spin parameter (Fig. 17). The low-mass, low-Σmax, low-sSFR tracks tend to occur at low redshift (Fig. 16) and/or in high-spin galaxies (Fig. 17). These properties of the tracks are also correlated with the rate of evolution along the tracks, where the high-Σmax tracks of massive galaxies represent a fast mode of compaction and quenching, while the lower Σmax tracks of lower mass galaxies represent a slower mode of evolution through similar stages at less compact configurations (Fig. 16).
STELLAR MASS AND HALO MASS
Correlations between stellar and halo mass
In the analysis so far, we have demonstrated correlations between the characteristic evolution of galaxies through compaction and quenching and two galaxy properties – the total stellar mass Ms and the central surface density Σ1, or Σe. We now examine the correlation between these two variables, as well as with a third quantity – the total halo virial mass Mv. The quantities Ms and Σ1 are expected to be strongly correlated in a trivial way as long at Re is smaller than or comparable to 1 kpc, where Σ1 ∼ Ms/π kpc− 2. This is indeed the case for our galaxies at the high-redshift range where the compaction typically occurs. Somewhat larger deviations may be expected for massive galaxies at lower redshifts. On the other hand, Ms and Mv are naturally correlated. So one expects the three variables to be correlated rather tightly. This makes it hard to identify the actual physical source for quenching, and in particular to address the potentially different roles played by the (internal) central density and the (external) halo mass in the quenching process.
Fig. 18 shows evolution tracks in sSFR versus stellar mass and versus halo mass for the eight example galaxies, the four more-massive galaxies of Fig. 2 in the top two rows, and the four less-massive galaxies of Fig. 3 in the bottom two rows. One can see that the characteristic L shape of the evolution tracks in the sSFR–Σ1 plane is translated to tracks of a similar shape in the sSFR–Ms plane and in the sSFR–Mv plane, emphasizing in particular the sharp onset of quenching corresponding to the peak of central gas density and SFR in the blue-nugget phase.
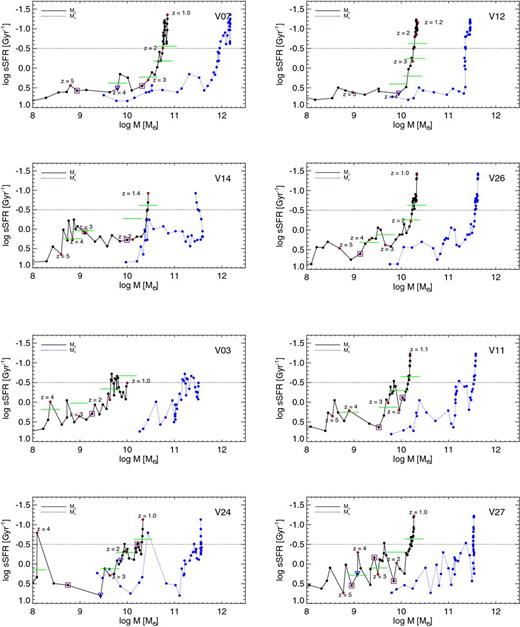
Evolution tracks in sSFR versus stellar mass (black solid lines) and halo mass (blue dotted lines), for the eight examples shown in previous figures, the high-mass examples of Fig. 2 (top four panels) and the low-mass examples of Fig. 3 (bottom four panels). The ridge of the MS is marked by green horizontal bars at z = 5, 4, 3, 2, 1, as evaluated by equation (7) for the mass of the galaxy at that redshift. The positive deviation of the sSFR from the MS ridge is maximal during the blue-nugget phase at the onset of the first quenching attempt. The sSFR of galaxies that are identified as quenched by the fixed sSFR threshold declines faster than the MS ridge, indicating that the galaxy is indeed in the process of quenching.
Recall that the sSFR–Ms plane at a given redshift is where one commonly identifies the basic galaxy bimodality into an MS of SFG and a red-sequence of quenched galaxies. Thus, the tracks shown in Fig. 18 tell how individual galaxies evolve in this plane (shown upside down), while the zero-point of the MS ridge is gradually shifting towards smaller sSFR values at later times according to equation (7). This evolving ridge is marked by green horizontal bars in Fig. 18 at z = 5, 4, 3, 2, 1. One can see that the galaxies tend to lie near the ridge at high redshift. At the blue-nugget phase, near the onset of the first major quenching attempt, the positive deviation of sSFR from the ridge tends to be at a maximum. After quenching across the green valley (sSFR ∼0.3 Gyr−1), the sSFR tends to be below the ridge line, eventually dropping to much lower values of sSFR as the quenching proceeds to the red-nugget phase. We note that the decline rate of sSFR is indeed faster than that of the MS, confirming the interpretation of a quenching process away from the MS ridge and towards the red sequence. In galaxy V27, the galaxy fluctuates above and below the MS ridge several times, in a sequence of compaction-driven SFR episodes followed by quenching attempts, before the final quenching occurs. This demonstrates a tight association of the evolution through compaction and quenching events and the deviation of the sSFR from the MS ridge. It may explain the gradients of galaxy properties across the MS, as well as the small scatter about its ridge (explored in detail in Tacchella et al., in preparation).
The correlation between Σ1, Ms, and Mv are directly addressed in Figs 19 and 20. The left-hand panel of Fig. 19, which shows all snapshots, demonstrates that Σ1 and Ms are strongly correlated about the line Σ1 ∝ Ms, where the upper envelope is defined by Σ1 ≤ Ms/π kpc− 2. The evolution tracks of our eight examples, shown in the right-hand panel of Fig. 19, indicate that these variables grow together in time as the galaxy evolves along the SFG phases. This is true in many cases, also during the compaction phase, as Ms is growing due to the high SFR and the continuing accretion. In some cases, the track steepens as Σ1 is growing faster than Ms. Then, at the end of compaction, the evolution track flattens, as Ms keeps growing while Σ1 becomes rather constant and remains so during the quenching phase. In this phase, the growth of Ms is slow, so the horizontal track segment is short. We note that the tracks of the less massive galaxies (when ranked at a given redshift) tend to flatten off at a lower Ms and a lower Σ1,max, as indicated in Fig. 16.
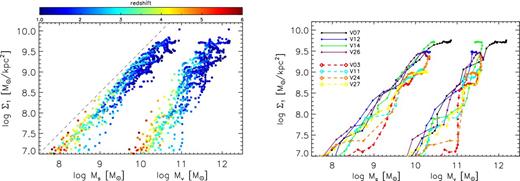
Central stellar surface density versus galaxy stellar mass and halo mass. Left: all snapshots together. Right: evolution tracks of the eight example galaxies shown in previous figures. The central surface density Σ1 is strongly correlated with mass. The galaxies evolve along the correlation line in the SFG phases, and branch out to a short horizontal segment (little mass growth) during the long quenching phase (many densely packed snapshots), at smaller Σ1 for lower mass galaxies.
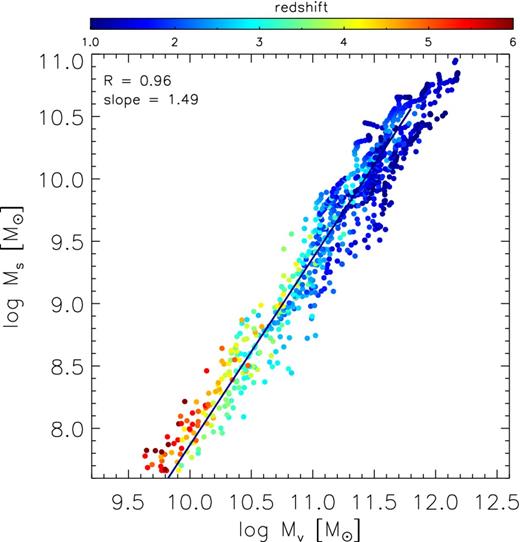
Stellar mass versus halo virial mass for all galaxies and snapshots. Points are coloured by redshift. There is a tight correlation, with the linear regression (for Mv < 1011.8 M⊙) shown, and with the slope and correlation coefficient quoted. The individual galaxy tracks evolve along the line, and then bend over and flatten as the Ms growth is suppressed during the quenching process.
Back to the scatter diagram on the left of Fig. 19, the quenched galaxies naturally populate the upper-right part of the distribution of points. The slope of the Σ1–Ms relation for the quenched galaxies is only somewhat flatter than that of the SFGs, and its zero-point is slowly shifting with time towards larger masses, qualitatively similar to observations (Fang et al. 2013; Tacchella et al. 2015). The SFG show a somewhat steeper relation, with a larger scatter in the lower-left part of the scatter diagram (see also Ceverino et al. 2014a).
The examples of Fig. 18 indicate that the stellar mass and halo mass grow together, as expected. The correlation between stellar mass and halo mass is addressed directly in Fig. 20. In the range of masses spanned by our sample in the high-redshift range, all the way up to Mv = 1011.8 M⊙, the data are well fit by a power law, |$M_{\rm s}\propto M_{\rm v}^{1.5}$|, with a correlation coefficient R = 0.96. This power law is consistent with the correlation deduced from observations through abundance matching (Moster et al. 2010; Behroozi, Wechsler & Conroy 2013). At larger masses, there is a hint for flattening, as expected from virial shock heating in haloes more massive than ∼1011.5–12 M⊙ (Dekel & Birnboim 2006).
Halo quenching
We know from theory that at late times a halo has to be above a threshold mass, in the range 1011.5–12 M⊙, in order to support a stable virial shock and sustain a hot circum-galactic medium (CGM) that can suppress cold gas supply to the galaxy and thus maintain long-term quenching (Dekel & Birnboim 2006). After establishing the role played by central density in triggering the quenching process, we now attempt to identify clues for the role played by a hot halo, through the halo mass, in allowing and maintaining the quenching.
Fig. 21 shows the central density (Σ1) and masses (Ms and Mv) of each galaxy at two times that characterize the quenching process. One time (marked by grey squares) refers to the first crossing of the green valley, defined by sSFR = 0.3 Gyr−1, which is interpreted as a quenching attempt that may or may not proceed to significantly lower values of sSFR. The second time (filled circles) refers to the crossing of sSFR = 0.16 Gyr−1, which is interpreted as successful quenching. For galaxies that have not successfully quenched by the final snapshot (z ∼ 1 in most cases), we interpret the last crossing of the green valley as a lower limit for the mass and central density at the time of possible later quenching (solid circles with arrows). Only two of the 26 galaxies in our sample (V34 and V13) have not crossed the green valley by their last snapshot (z = 1.86 and z = 1.5), and are therefore omitted from this figure. Seventeen galaxies have successfully quenched by the final snapshot, while seven galaxies provide only lower limits to possible quenching.
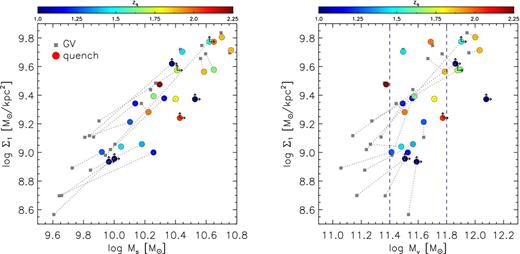
The values at quenching of central surface density, Σ1, versus mass, Ms (left) and Mv (right). The 24 grey squares refer to the first green-valley crossing, where sSFR < 0.3 Gyr−1 for the first time. The 17 circles with no arrows refer to galaxies that successfully quenched, reaching sSFR < 0.16 Gyr−1. The seven circles with arrows refer to galaxies that did not successfully quench by the final snapshot, and thus provide a lower limit to the mass and Σ1 at possible later quenching. The colour marks the redshift at quenching (or an upper limit for it). Each pair of points that belong to the same galaxy is connected by a dashed line. Successful quenching occurs when the halo mass is above a threshold, Mv ≥ 1011.4 M⊙, and about 70 per cent of the galaxies quench when the halo is in the narrow range Mv = 1011.4 − 1011.8 M⊙. At smaller halo masses, the partial quenching attempt triggered by moderate compaction fails. We see no sharp lower limit for Σ1 or Ms at final quenching. Galaxies that quench earlier tend to do it at a higher Σ1, max and a higher Ms, but only at a marginally higher Mv.
The general correlation seen in Fig. 21 between density and mass at quenching is not surprising given that this correlation holds during the evolution of each galaxy, as seen in Figs 19 and 20. We learn from Fig. 21 that quenching attempts (grey squares) may occur for different galaxies at different densities and masses, spanning a relatively broad range, without picking out a special scale. However, successful quenching seems to occur when the parameters span relatively narrow ranges, about 0.9 dex, 0.9 dex, and 0.7 dex for Σ1, Ms, and Mv, respectively. The log of the corresponding medians (in the units used here) and the 1σ scatter about them are roughly |$9.5^{+0.3}_{-0.3}$|, |$10.4^{ +0.3}_{-0.2}$|, and |$11.6^{+0.3}_{-0.1}$|.
Most interestingly, there seems to be a threshold for successful quenching at Mv ≥ 1011.4 M⊙. If a galaxy attempts to quench while its halo is below this threshold, its quenching attempt temporarily fails, waiting for the halo mass to grow above the threshold before it can successfully quench. Consistent with this threshold, the halo mass at successful quenching is typically in a relatively narrow range above the threshold. If we consider the lower limits as detections, we find that about 70 per cent of the galaxies quench when the halo mass is in the narrow range Mv = 1011.4–1011.8 M⊙.
This is consistent with the basic theoretical understanding of halo quenching, where being above a threshold mass of ∼1011.5−12 M⊙ is a necessary condition for the halo to sustain a stable virial shock. Such a shock is typically triggered by a minor merger event that happens after the halo grew to above the threshold (Dekel & Birnboim 2006). A more direct test of halo quenching can be provided by measuring the halo gas temperature and the absence of penetrating cold inflows, which is deferred to a future study.
The corresponding ‘thresholds’ for Ms and Σ1 at quenching are softer, and the ranges of values above their minima are somewhat broader, 0.6 dex for 76 per cent of the galaxies compared to the 0.4 dex for Mv. This is consistent with the theory-motivated assertion that Mv is more strongly associated with the cause of quenching, and the narrow but somewhat broader ranges of values for the stellar quantities at quenching are induced by their correlations with Mv.
The colours of the circles in Fig. 21 mark the redshift at successful quenching (or an upper limit for it). This shows that galaxies that quench earlier tend to do so at a higher Σ1,max and correspondingly at a higher stellar mass, confirming the quenching downsizing discussed above in Section 5 and below in Section 7. A similar general trend is also seen for the halo mass, but here the trend is weaker, indicating a tendency to quench near a similar characteristic halo mass at the different redshifts.
DISCUSSION: ORIGIN OF COMPACTION and QUENCHING
Onset of compaction
As seen in previous sections, the compaction is wet, in the sense that it is driven by gas contraction at a rate that is faster than the SFR. This wet compaction could possibly be associated with VDI (DB14), and it is likely triggered by an intense episode of gas inflow through gas-rich mergers or smoother gas streams. We discuss the possible origin of compaction next.
Mergers
The possible correlation between merger events and the onset of compaction and/or quenching can be crudely explored in our simulations using the green curves in the right-hand panels of Figs 2 and 3, which show the mass growth, in the inner 1 kpc and in the whole galaxy, due to ex-situ stars that formed outside the galaxy. The addition of a large stellar mass over a single output timestep, of a typical duration of 150 Myr, is an indication for a merger event. In many cases, there are indications for mergers prior to compaction (e.g. V11, V12, V14). In other cases, there is no evidence for a significant merger prior to compaction, possibly indicating that the compaction is associated with VDI (e.g. V26). In most cases, we can see a sequence of mergers prior to compaction but they do not seem to coincide with the onset of quenching (e.g. the first snapshot shown for V12 in Fig. 7). The eight galaxies shown in Figs 2 and 3, like the other galaxies in the sample, give the impression that in many cases mergers are important in triggering the compaction, and are possibly also involved in the quenching process. These mergers can be major in some cases, namely with a mass ratio higher than 1:3, but in most cases they are minor mergers with a mass ratio between 1:10 and 1:3.
Stimulated VDI
Our developing picture is that the VDI that is very abundant in high-redshift disc galaxies is different from the secular instability common in late-redshift discs like the Milky Way. At high redshift, where the gas fraction is higher, the perturbations, including the giant clumps, are large and with non-negligible masses compared to the whole disc, so they have important dynamical effects that operate on time-scales comparable to the disc dynamical time-scale. This refers, for example, to the formation of in situ clumps and to their migration to the disc centre. Furthermore, the simulations reveal that the Toomre Q parameter in most of the disc outside the clumps is significantly larger than unity, while the disc still produces new clumps (Inoue et al., in preparation). This indicates a non-linear unstable state that is stimulated by non-linear perturbations. These perturbations may be associated with the intense instreaming including minor mergers that at those epochs are rather frequent with respect to the disc orbital time. The emerging wisdom is that VDI and mergers are not two distinct phenomena but rather closely associated with each other. In a gas-rich disc, they seem to work in concert in driving the intense inflow within the disc, thus compactifying the system into a blue nugget. This non-linear disc instability is under investigation (Inoue et al., in preparation).
Counter-rotating streams
The intense gas streams could naturally drive compaction if they are counter-rotating with respect to the existing gas disc. Our simulations demonstrate that this phenomenon is common in high-redshift galaxies. Danovich et al. (2014) found that on average about 30 per cent of the instreaming gas mass in the inner halo is counter-rotating with respect to the net instreaming AM in the same volume, carrying a negative contribution with an amplitude that is on average 43 per cent of the positive component, namely 75 per cent of the net total inflowing AM.
In order to evaluate the effect of the counter-rotating streams on the disc, Danovich et al. (2014) measured J−, the AM component in the direction antiparallel to the disc AM, for the instreaming gas at radial distances and velocities that will bring it to the disc in less than an outer-disc orbital time. This time is typically torb ∼ 250 Myr in our galaxies at z ∼ 2, involving most of the instreaming gas at 0.1–0.5Rv. For the galaxies at z = 2–3, the median of J−/Jd (where Jd is the disc AM) is about 10 per cent, but about 20 per cent of the galaxies have J−/Jd ∼ 1. Indeed, in a period of 250 Myr, about 15–20 per cent of the discs flip their orientations, namely change their spin direction by more than 90°. We note that this is suspiciously similar to the fraction of galaxies that start their compaction event in a similar period.
The interaction of a counter-rotating stream with the rotating disc leads to a cancellation of AM that can drive a significant shrinkage (to be studied elsewhere). This phenomenon has been studied in the context of proto-stellar discs. Quach, Dyda & Lovelace (2015) performed an analytic calculation based on the work of Lovelace, Turner & Romanova (2009), discussing the Kelvin–Helmholtz instability between a rotating inner disc and a counter-rotating outer disc. Dyda et al. (2015) performed idealized simulations of such a two-component disc as well as a disc and a counter-rotating stream, and found in both cases a significant shrinkage of the disc (their fig. 11) or part of it (fig. 2).
Low-AM-recycled gas
Most of the gas that inflows into galaxies at z ∼ 1–3 is likely to be recycled gas that has been ejected from the galaxy earlier. This has been argued based on the failure of models based on cosmological accretion alone to match the high sSFR observed in SFGs at these redshifts (Dekel & Mandelker 2014), and it has been directly measured in the simulations used in the current paper (DeGraf et al., in preparation). The gas is ejected preferentially from the dense central regions that are typically of low AM. The interaction between the low-AM returning gas and the high-AM fresh instreaming gas is another natural way to generate shrinkage. This has been addressed by Elmegreen, Struck & Hunter (2014), who studied shrinking galaxy discs by fountain-driven accretion from the halo.
Tidal compression
Tidal interactions are commonly perceived as causing stripping, but in certain circumstances they could actually cause compaction. In particular, when a satellite galaxy is orbiting in a core of a host halo, where the density profile is flatter than r−1, the tidal forces from all directions are pushing inwards, towards the satellite centre (Dekel, Devor & Hetzroni 2003). Thus, a galaxy passing through a cluster core is likely to compactify subject to tidal compression.
Renaud et al. (2014) measured the compressive tides during a simulated major merger, and found them to become strong during the merger. They learned that the compressive tides boost the compressive, irrotational mode of the gas turbulence well above its usual equipartition with the rotational, solenoidal mode. This compressive mode can induce local collapse. Indeed, it has been argued analytically that compressive tides reduce the Jeans mass, which makes clump formation more efficient (Jog 2013, 2014). One may therefore deduce that compressive tides may stimulate VDI with giant clumps, and suspect that they could also induce a central compaction of the galaxy core.
Origin of mass dependence
One wonders what could be the reason for more massive galaxies to compactify at a higher redshift. The total sAR into haloes is only a weak function of mass, |$\dot{M}/M \propto M^{0.14}$|, which could be derived from the slope of the fluctuation power spectrum on galactic scales (Neistein, van den Bosch & Dekel 2006; Neistein & Dekel 2008; Dekel et al. 2013). The associated merger rate, for mergers with a mass ratio above any threshold, is a fixed fraction of this overall accretion rate (Neistein & Dekel 2008). The resultant sAR of baryons on to the galaxy at the halo centre is similar (Dekel et al. 2013), and the associated galaxy merger rate is expected to crudely follow. Therefore, unless the fraction of mergers is smaller in less massive haloes due to more efficient pre-merger disruption of satellites, we do not expect a mass dependence of compaction time to arise from a mass dependence in the accretion or merger rate.
According to DB14 (equation 29), at a given high redshift, for haloes in the mass range simulated here, the critical effective surface density for wet compaction, Σe,w=1, is expected to be slowly increasing with mass, at a rate comparable to the natural dependence of surface density on mass, Σ ∝ M1/3, induced by the virial relations (e.g. Dekel et al. 2013, equation 15). This, also, does not introduce a strong mass dependence in the compaction efficiency at a given redshift. On the other hand, at a given mass, Σe,w=1 is expected to increase with time as ∝ (1 + z)−3/2, while the natural evolution of the effective surface density in galaxies of a given mass is ∝ (1 + z)2, which makes it easier to compactify at higher redshift but for any galaxy mass. We thus do not see a compelling theoretical preference for a late compaction in low-mass galaxies.
An inspection of the histories of our lower mass simulated galaxies indeed indicates that the apparently late compaction of lower mass galaxies refers only to the last and most dramatic compaction event that leads to successful quenching. These galaxies may undergo earlier compaction events that do not end up in full quenching. Our tentative conclusion (as argued in DB14) is that the downsizing refers to the quenching process, and is possibly associated with the effect of a threshold halo mass for successful quenching, as discussed in Section 6.
Onset of quenching at maximum compactness
The simulations reveal that the point of maximum gas compactness defines the onset of quenching, in terms of gas depletion in the central regions and the associated decline in SFR. It would be interesting to find out what makes the gas compaction stop at a given configuration, and what causes the onset of quenching at the same time. Clues for the mechanisms involved are provided in the second-from-right panels of Figs 2 and 3 by the curves displaying the evolution of the central masses of the different components and their different rates of change.
Since the SFR gradually increases during the compaction phase and reaches a maximum near the peak of gas compactness, the gas consumption into stars itself is likely to be an important source of quenching. Indeed, the gas depletion time by star formation at the peak compactness is short, ∼100 Myr. With an average SFR of ∼10 M⊙ yr−1 over a typical compaction duration of ∼0.5 Gyr, the gas mass consumed into stars is a few times 109 M⊙, comparable to the peak total gas mass within the 1-kpc sphere.
Both the inflow rate and outflow rate through the boundary of the 1-kpc sphere are expected to be correlated with the SFR, and, indeed, they seem to be comparable to it, and thus also important in the quenching process. During the compaction and the early phases of the quenching process, part of the inflow is associated with the compaction process, while additional inflow may be associated with recycling of earlier outflows, which is likely to be substantial (e.g. Dekel & Mandelker 2014). We do not identify a large burst of outflows at the onset of quenching, but there is a broad maximum of outflow rate (and inflow rate) during the maximum compaction phase, with a mass-loading factor of order unity with respect to the SFR. This is consistent with preliminary observations of outflows from blue-nugget candidates at z ∼ 3 (Williams et al. 2014b).
The pre-compaction and especially the compaction phase are characterized by the gas inflow rate into the central 1 kpc being higher than the sum of the SFR and the outflow rate, leading to an overall growth with time of the central gas density. Immediately after the compaction peaks, where the SFR and the outflow rate are at their peak, not much gas is left outside the central compact object so the inflow is dropping, shifting the balance to a situation where the SFR plus outflow dominate over the inflow. This leads to gas depletion from the centre, which in turn reduces the SFR and leads to gradual quenching. The fact that the inflow, SFR, and outflow rates remain comparable to each other implies that the inequality SFR+outflow>inflow remains valid, which allows the quenching process to continue till completion. This situation may change only if there is a new episode of external gas supply that boosts the inflow rate into the centre. More likely in the post-compaction phase is a slow buildup of an extended gaseous disc about the quenched centre, driven by high-AM accretion from the halo, partly in a hot mode, and certain outflow from the centre. This leads to an extended star-forming ring surrounding a quenched red nugget, which can be interpreted as inside-out quenching during the post-compaction phase. We comment, again, that star formation in this ring (as well as in the bulge) could be impeded by AGN feedback or stronger stellar feedback had those been included in our simulations.
DB14 considered the process of VDI-driven wet compaction in the dark matter dominated regime. They argued that when w > 1, as the baryons contract within a fixed dark matter halo that dominates the mass, the compaction leads to an increase in δ = Mcold/Mtot, as the given Mcold is shrinking to a radius that contains less halo mass. Based on equation (1), where the wetness is w ∝ δ2, the growth of δ makes w increase, thus leading to a runaway compaction until it is halted by the growing velocity dispersion or another process. The central quenching is helped by the suppression of gas supply to the inner region, which may result from the suppression of disc instability in any disc that may remain after the shrinkage. The increase of the Toomre Q parameter to above unity can be caused either by the depletion of gas surface density in the disc (Forbes et al. 2012, 2014), by an increase in the turbulent velocity dispersion, or by the growing contribution of the bulge to the potential well and therefore to the epicyclic frequency κ (morphological quenching, Martig et al. 2009). In the later stages of compaction, when the baryons are self-gravitating with a negligible contribution from the dark matter, the compaction may actually lead to a decrease in δ. This is because the ‘hot’ component, made of stars, grows at the expense of the depleting cold-gas component. This makes w decline, which may suppress the gas inflow in the disc as the SFR becomes faster than the inflow rate, and thus help the central quenching.
The halo quenching naturally introduces a mass dependence in the quenching process. A halo of mass below a few times 1011 M⊙ allows efficient cold gas inflow into the galaxy (Dekel & Birnboim 2006), which builds a gaseous disc that undergoes VDI. The incoming mergers and counter-rotating streams trigger compaction events, each followed by a temporary quenching attempt driven by the high central gas density with enhanced SFR and the associated temporary shortage of gas supply from the disc that has been diluted by the shrinkage. However, the continuing cold gas supply from the halo rebuilds a disc that provides gas mass for a recurrent compaction event, leading to a new central star formation event followed by a new quenching attempt, and so on. Only when the halo becomes massive enough to support a stable virial shock and thus sustain a hot CGM, and when the cosmological time is late enough such that cold streams do not efficiently penetrate through the hot CGM, can the quenching attempt be completed. In such a halo, the disc that has been diluted by compaction cannot be replenished by fresh external gas supply. The feedback from the star-forming centre may help triggering the hot CGM and suppress gas infall from the halo. The inclusion of AGN feedback may do so even more efficiently and for a longer period. This may connect the internal quenching process with the long-term quenching by the hot CGM in the halo.
Transition to self-gravity and quenching
We noticed that in the pre-compaction phase, while the galaxy forms stars at a rather constant sSFR, the mass within Re or 1 kpc is dominated by the dark matter. Then, after compaction, the baryons become self-gravitating within the central region, where they dominate the gravitational potential over the dark matter. This transition may provide an alternative explanation for the onset of quenching at the peak of central gas density. We already mentioned in the previous section how such a transition can help the quenching by modifying the DB14 argument for a runaway shrinkage, and we now discuss an alternative interpretation of the quenching in the self-gravitating state via a bathtub toy model for galaxy evolution (e.g. Dekel & Mandelker 2014).
Once the baryons become self-gravitating in the late compaction and post-compaction phases, the depletion time may not be independent of gas mass any more. We learn from the right-hand panels of Figs 2 and 3 that the depletion time τsfr = Mg/SFR reaches a minimum when Mg is at its peak, and it later grows in time as Mg declines, namely τsfr is a decreasing function of Mg. This is consistent with the free-fall time being determined by the gas density. If we assume, for example, |$\tau _{\rm sfr} \propto M_{\rm gas}^{-1/2}$|, the second term in equation (10) becomes |$\propto M_{\rm gas}^{3/2}$|. In this case, the SFR drain term in equation (10) dominates over the accretion source term, which makes the solution for Mgas decrease in time rather than approach a QSS. This is consistent with the gradual decrease of Mg leading to quenching in the self-gravitating phase.
CONCLUSION AND DISCUSSION
Our suite of zoom-in cosmological simulations reveals three characteristic phases in the evolution of galaxies at high redshift: a diffuse phase, a compaction phase, and a subsequent quenching phase, which in some cases occur more than once in the lifetime of a galaxy. The main features of this chain of events are as follows.
In the diffuse phase, the intense accretion though streams, including mergers, grows a gas-rich, highly perturbed, turbulent, rotating disc, and drives a high sSFR, often associated with VDI.
The typical galaxy undergoes a phase (or phases) of dissipative compaction into a compact, gas-rich, star-forming system, which resembles the observed ‘blue’ nuggets.
The moment of maximum gas compaction marks the onset of gas depletion from the central regions, followed by gradual central quenching into a compact elliptical that resembles the observed red nuggets.
In some cases, a post-compaction clumpy ring of gas forming stars develops around the quenched massive compact bulge, which appears as inside-out quenching in this phase of the evolution. An extended stellar envelope may gradually grow by dry accretion.
The compaction process is associated with a steep increase in both rotation and velocity dispersion for the stars, and an even steeper increase in rotation velocity of the gas. These velocities remain high in the post-compaction phase, and give rise to high and comparable gas and stellar linewidths when observed through a broad beam.
There is downsizing in the sense that more massive galaxies tend to quench earlier, faster, and at a higher stellar density. They quench more efficiently and decisively than their lower mass counterparts. The latter tend to oscillate about the MS ridge between the blue-nugget and green-nugget phases before they eventually fully quench.
Other noticeable features of these events are as follows.
As a galaxy undergoes compaction, it maintains a roughly constant sSFR. When it subsequently quench, the sSFR decreases rapidly while the density within the inner 1 kpc stays roughly constant (and the effective surface density may slowly decrease), consistent with the way observed galaxies populate the sSFR–Σ plane.
The compaction is commonly triggered by an intense inflow episode. This may include a major merger, multiple minor mergers, counter-rotating streams, recycled gas, or tidal-compression, and is sometimes associated with stimulated VDI.
As predicted by DB14, the compaction process is wet, with the inflow rate higher than the SFR. The maximum surface density reached after compaction is indeed anticorrelated with cosmological time and with the initial spin parameter, and it is correlated with the sSFR. The simulated population of SFG at z ≥ 3 shows a bimodality in central surface density, being either diffuse or compact, as predicted.
The central quenching in the current simulations is driven by gas depletion from star formation and stellar/supernovae feedback, while the gas inflow to the centre is (at leaset temporarily) suppressed.
Quenching occurs after the baryons become self-gravitating in the central kpc, which may be explained in the context of VDI-driven compaction or via a bathtub toy model for the evolution of the central region of the galaxy.
A halo mass above a threshold of 1011.4 M⊙ is required for successful quenching, with most galaxies quenching in the narrow range Mv = 1011.4−11.8 M⊙. This indicates that the halo mass has an important role in allowing significant quenching and maintaining it, while the central density provides the trigger for quenching. The stellar mass and central surface density at final quenching span a somewhat broader but also rather narrow range of values, presumably reflecting their tight correlations with the halo mass.
The simulation results, which confirm the toy-model predictions of DB14, are qualitatively consistent with observational findings concerning high-redshift star-forming and quenched galaxy populations, the compact ‘blue’ nuggets and red nuggets, both at z < 1 (Cheung et al. 2012; Kauffmann et al. 2012; Fang et al. 2013) and at z = 1–4 (Barro et al. 2013, 2014a,b; Kaviraj et al. 2013a,b; Lee et al. 2013; Bruce et al. 2014; Williams et al. 2014a,b).
DB14 predicted using a toy model for VDI-driven wet compaction that the ‘blue’ nuggets should be dispersion-dominated, rotating, star-forming systems, with σ/V ≥ 0.5. Indeed, we find in our simulations that the compaction is associated with a steep rise in both rotation velocity and velocity dispersion (for the stars). The line-of-sight mass-weighted velocity dispersion tends to rise during the compaction from ∼50 km s−1 to 100–200 km s−1, and to remain high (or slightly decreasing) during the subsequent quenching to a red nugget. This is consistent with the observed linewidths for galaxies in the three distinct phases (Barro et al. 2014b). As pointed out by DB14, the ‘blue’ nuggets could potentially be associated with observed dispersion-dominated systems (Law et al. 2012; Newman et al. 2013). We found that the ‘blue’ nuggets could either proceed or precede a VDI clumpy phase. Low-mass, low-metallicity, dispersion-dominated galaxies more likely represent the violent pre-VDI stages of galaxy buildup driven by intense instreaming, while the post-compaction dispersion-dominated ‘blue’ nuggets are expected to include more massive and more metal-rich systems.
Our simulations, and the scenario of DB14, predict that compact galaxies, following the ‘blue’-nugget phase, may be surrounded by an extended disc or ring of low-density gas and young stars. This ring is gravitationally unstable showing clumps and is forming stars at a gradually declining rate. There are already possible observational detections of such cases (Elmegreen, Elmegreen & Ferguson 2005; Bournaud et al. 2011a; Genzel et al. 2014a). The high-z post-compaction quenching is thus from the inside out. We address this in detail in a companion paper (Tacchella et al., in preparation). It is consistent with preliminary observational indications for inside-out quenching based on the rising sSFR profiles of a sample of galaxies at z ∼ 2.2 (Tacchella et al. 2015).
Our work reveals how the dissipative shrinkage of a galaxy into a compact bulge leads to quenching. The process is driven by efficient gas consumption into stars and the associated feedback-driven gas removal by outflows, while the inflow to the centre is suppressed, first because of the disappearance of the extended gas disc, and then by the shutdown of fresh gas accretion from the halo. In parallel, the disc instability, which drives star formation and inflow within the disc, is suppressed by the growth of bulge mass (morphological quenching; Martig et al. 2009, 2013), the increase of turbulent velocity dispersion, and the decline of gas surface density. AGN feedback, which is likely to be correlated with the high SFR in the ‘blue’-nugget phase (e.g. Barro et al. 2013) but is not included in the current simulations, may help boosting the quenching process associated with the internal compactness.
The maintenance of long-term quenching requires a shutdown of fresh gas supply, which is naturally provided by virial shock heating of the CGM in the halo, occurring in haloes more massive than a threshold mass that can vary about a mass scale ≲1012 M⊙ and at sufficiently low redshift, where cold streams fail to penetrate deep into the galaxy (Dekel & Birnboim 2006). This is a slower quenching mode that is potentially dominant at lower redshifts, commonly after the quenching has been triggered by the internal bulge quenching processes discussed above (Woo et al. 2013; DB14; Woo et al. 2014). The lower mass galaxies in our simulations start as discs with moderate wetness, and they contract later, more slowly and to a lower density. Their compaction events trigger unsuccessful short-term quenching attempts as long as the halo mass is below the threshold for virial shock heating. The less massive galaxies manage to quench significantly only when the halo becomes massive enough to sustain a hot CGM that suppresses the cold gas supply.
Once a compact red nugget forms at a high redshift, it is likely to be subject to further accretion (including mergers), which becomes more and more star-dominated with time (Oser et al. 2010; Porter et al. 2014a,b), and thus lead to a dry growth. In some cases, the accretion is slow, leaving the red nugget naked, with no stellar envelope, until z ∼ 1. In cases of substantial dry growth, an extended stellar envelope develops around the red nugget, and the galaxy becomes a rotating spheroid compatible with the typical observed ellipticals at low redshift (e.g. van Dokkum et al. 2014). The stellar core itself typically remains dense within the inner kpc, while the density within the effective radius can decrease as the effective radius grows. In many cases, the overall stellar density profile seems to evolve self-similarly, crudely matching the De Vaucouleurs’ profile (Tacchella et al., in preparation).
As a word of caution, one should recall that the reliability of cosmological simulations is still limited by the uncertain treatment of star formation and especially feedback. This commonly leads to too-early formation of stars at redshifts above 3, leaving the galaxies with a gas fraction somewhat lower than observed at z ∼ 2. The simulations used here, with lower SFR efficiency and added radiative feedback compared to earlier simulations in our series, do better than the earlier versions, but the simulated gas fractions in massive galaxies at z ∼ 2 may still be lower than deduced from observations (Daddi et al. 2010; Tacconi et al. 2013), and the stellar-to-virial mass ratio may still be higher than deduced from observations (Moster et al. 2010; Behroozi et al. 2013), both by factors of ∼2 (Moody et al. 2014). If true, the compaction events may tend to occur in the simulations at somewhat earlier epochs than in the real Universe.
Furthermore, because of the potentially insufficient feedback and in particular the absence of AGN feedback in the current simulations, the quenching is sometimes incomplete. Nevertheless, the simulations do appear to capture the key features of the compaction and quenching processes and thus provide at least a qualitative description of these major events in the lifetime of a galaxy, pointing to their frequent abundance at z > 2, and to the vital role they play in the formation of compact massive galaxies, star-forming and quenched ellipticals.
Based on Figs 12, 13, and 18, we propose that the evolution through the phases of compaction and quenching may be responsible for variations of galaxy properties across the MS at a given stellar mass and may be the key for explaining the small scatter about the MS ridge (addressed in detail in a companion paper Tacchella et al., in preparation). Observations, simulations and analytic theory indicate that the average sSFR on the MS at any redshift is a weak function of stellar mass and its zero-point is declining with time as sSFR ∝ (1 + z)2.5 (e.g. Noeske et al. 2007a,b; Whitaker et al. 2012; Dekel et al. 2013; Dekel & Mandelker 2014). We see in the eight example galaxies shown in Fig. 18 that each galaxy starts near the MS ridge with a constant or slightly declining sSFR. During the pre-compaction phase and especially during the compaction phase the positive deviation of the sSFR from the ridge is rising, reaching a maximum at the ‘blue’-nugget phase. From then on the sSFR of the quenching galaxy drops faster than ∝ (1 + z)2.5, thus bringing the galaxy to a negative deviation from the ridge before it reaches the green-valley phase. We thus associate the galaxies that lie ‘above’ the MS with the ‘blue’-nugget phase of evolution, and the galaxies that lie ‘below’ it with the post-compaction green-valley phase, on the way to quenching. The simulations indicate that the ‘blue’-nugget phase is associated with a minimum in the depletion time and a maximum in the gas fraction during the short-term history of the galaxy. This predicts gradients in these quantities orthogonal to the MS, as observed in Genzel et al. (2014b). Furthermore, the onset of quenching at the peak of central gas density, based on the balance between the rates of inflow and the sum of SFR and outflow, as argued above, may explain the upper bound for the sSFR deviation from the MS ridge. In turn, the lower bound can possibly be explained by a temporary recovery of the inflow rate that triggers a new episode of compaction and rising sSFR, till the final rapid drop of the sSFR towards the red sequence.
We conclude that compaction and subsequent quenching, assisted by a hot massive halo, combine to a chain of events of major importance in the history of massive galaxies. In particular, the high-redshift ‘blue’ nuggets represent a key phase in galaxy evolution.
We acknowledge stimulating discussions with Andi Burkert, Marcella Carollo, Reinhard Genzel, David Koo, Simon Lilly, and Sandro Tacchella. This work was supported by ISF grant 24/12, GIF grant G-1052-104.7/2009, a DIP grant, by the I-CORE Program of the PBC, ISF grant 1829/12, and NSF grants AST-1010033 and AST-1405962. SI and CD acknowledge Lady Davis Fellowships at HU. DC acknowledges support from MINECO grant AYA2012-31101, MICINN grant AYA-2009-13875-C03-02, and a Juan-de-la-Cierva fellowship. The simulations were performed at NERSC, LBNL, NASA Ames, and at the astro cluster at HU.
The term ‘nugget’ does not imply a small mass; the nuggets are massive but small in size, namely compact.
The ‘blue’ nuggets could actually be quite red due to dust, so we sometimes refer to them as ‘blue’, with quotation marks.
Replacing the Miller–Scalo IMF used in earlier simulations.
This range is dictated by the fact that the refinement level is changed discretely by a factor of 2 once the Hubble-expanding box has doubled in size.
This is a crude proxy for SFR estimates based on Hα measurements, while UV-based estimates are sensitive to stars younger than ∼100 Myr.
This division by the mass in every redshift bin is similar but not identical to implementing mass cuts at the highest redshift bin and following the galaxies in each of the three initial mass bins as they grow in mass with time.
An approximate translation of time in Gyr to redshift, valid in the Einstein-deSitter regime, z > 1, is provided by 1 + z = (t/17.5 Gyr)−2/3.
