


Abstract
We present results from multiwavelength observations of the galaxy NGC 5005. We use new neutral hydrogen (H i) observations from the Very Large Array to examine the neutral gas morphology and kinematics. We find an H i disc with a well-behaved flat rotation curve in the radial range 20–140 arcsec. Ionized gas observations from the SparsePak integral field unit on the WIYN 3.5 m telescope provide kinematics for the central 70 arcsec. We use both the SparsePak and H i velocity fields to derive a rotation curve for NGC 5005. Deep 3.6 μm observations from the Spitzer Space Telescope probe the faint extended stellar population of NGC 5005. The images reveal a large stellar disc with a high surface brightness component that transitions to a low surface brightness component at a radius nearly 1.6 times farther than the extent of the gas disc detected in H i. The 3.6 μm image is also decomposed into bulge and disc components to account for the stellar light distribution. Optical broad-band B and R and narrowband Hα from the WIYN 0.9 m telescope complement the 3.6 μm data by providing information about the dominant stellar population and current star formation activity. The neutral and ionized gas rotation curve is used along with the stellar bulge and disc light profiles to decompose the mass distributions in NGC 5005 and determine a dark matter halo model. The maximum stellar disc contribution to the total rotation curve is only about 70 per cent, suggesting that dark matter makes a significant contribution to the dynamics at all radii.
INTRODUCTION
Understanding the role and significance of dark matter in the evolution of baryonic components (i.e. conversion of the gaseous disc into stars) is a critical aspect for realistic models of galaxy evolution. Observational studies aimed at addressing the influence of dark matter in galaxy formation and evolution often use mass decomposition to constrain the distribution of dark matter. Many of these projects utilize neutral hydrogen (H i) synthesis observations to derive the kinematics for rotation curve decompostion (i.e. The H i Nearby Galaxy Survey (THINGS); Walter et al. 2008, Westerbork Survey of H i in Spiral Galaxies (WHISP); van der Hulst, van Albada & Sancisi 2001). In this paper, we take advantage of the well-behaved outer disc kinematics in the galaxy NGC 5005 to perform a mass decomposition analysis. We use radio synthesis observations of H i and CO to probe both the gas surface density and dynamics as the gas follows the gravitational potential of the galaxy. The stellar contribution to the overall mass budget of the galaxy is determined from deep near-infrared (NIR) observations. Finally, we use optical broad-band B and R and narrowband Hα observations to supplement the NIR and radio synthesis data to provide information about the dominant stellar populations and star formation activity.
Large projects like THINGS and WHISP have provided a foundation for numerous other studies investigating gas kinematics and morphology (e.g. van Eymeren et al. 2011; Holwerda et al. 2011; Vollmer & Leroy 2011) and dark matter haloes (e.g. de Blok et al. 2008; Oh et al. 2011). However, an examination of the statistical significance of connections between the dark matter and baryonic properties of these galaxies may be biased due to the representative nature of the samples. In an effort to address fundamental questions regarding the growth and distribution of stellar discs in dark matter haloes in a statistical manner, we have undertaken a project correlating structural properties and star formation activity with the dark matter properties of the host galaxy. The project uses a statistical sample of 45 nearby galaxies and builds on existing data obtained as part of the Extended Disk Galaxy Exploration Science (EDGES) Survey (van Zee et al. 2012), which includes deep Spitzer Space Telescope imaging observations. The statistical sub-sample consists of all galaxies in the EDGES Survey that are optimally suited for rotation curve decomposition, based primarily on the limited range of inclination angles that yield both accurate rotation curves and surface density profiles. Our combination of optical, NIR, and radio synthesis observations will enable a comprehensive statistical analysis of the evolution of galactic discs as a function of baryonic mass, environment, and dark matter mass.
In this paper, we focus our efforts on a single galaxy from the sample, NGC 5005. This SAB (rs) bc type galaxy has been studied extensively in the literature (e.g. Burbidge, Burbidge & Prendergast 1961; Blackman 1979; Duric et al. 1996; Batcheldor et al. 2005). It is known to host a low-ionization nuclear emission-line region in its centre (Ho, Filippenko & Sargent 1997) and has been classified as a low-luminosity active galactic nucleus (LLAGN) with a polycyclic aromatic hydrocarbon (PAH)-dominated mid-infrared spectrum by Mason et al. (2012). The morphology of NGC 5005 as viewed in the infrared and optical features a strong bulge with boxy isophotes (Eskridge et al. 2002) and a complicated dust morphology with no coherent structure (Hughes et al. 2003). There is also evidence of a fairly weak, round bar which is nearly aligned with the major axis of the galaxy. Despite the weakness of the bar, Das et al. (2003) found that it could still be responsible for creating shocks visible in the central molecular gas velocity field. The molecular gas dynamics in NGC 5005 were studied in more detail by Sakamoto, Baker & Scoville (2000). Their observations reveal CO emission from the nucleus, a ring at about 3 kpc, and a stream of gas north-west of the nucleus. The S-shape in the nuclear velocity field in Sakamoto et al. (2000) is a signature of non-circular gas motions. Sakamoto et al. (2000) cite a stellar bar of length ∼5 kpc as being accountable for infalling gas seen as in the north-west stream and for creating the 3 kpc ring which may form at the ultraharmonic resonance of the bar or alternatively constitute a pair of spiral arms that originate at the bar's ends. A position–velocity cut along the major axis of NGC 5005 reveals a steep rise in the rotational velocity of the CO emission (their fig. 5). The rotational velocity rises to approximately 300 km s−1 within the central 10 arcsec.
NGC 5005 lies in a relatively populated environment that is near the Ursa Major Cluster. The distance to NGC 5005 is uncertain; distance measurements range from 13.7 to 34.6 Mpc. In this paper, we adopt the Type Ia supernova distance of 16.5 Mpc (Takanashi, Doi & Yasuda 2008). NGC 5005 is thought to be part of a physical galaxy pair with the nearby spiral galaxy NGC 5033 (Helou, Salpeter & Terzian 1982). The two galaxies are separated by a projected distance of approximately 41 arcmin (∼200 kpc at 16.5 Mpc) and are at similar redshifts. There are no clear signs of any interaction between the galaxy pair. There are two dwarf galaxies, SDSS J131115.77+365911.4 and SDSS J131051.05+365623.4, that are within 10 arcmin of NGC 5005 and also lie at similar redshifts. Farther out, there are many additional dwarf galaxies within 1° of NGC 5005 which are part of the NGC 5033 group.
The goal of this present work is to investigate the dark matter and baryons in NGC 5005. NGC 5005 is also a proof of concept for the larger study. The observational data are presented in Section 2, and we focus on the kinematics in Section 3. Section 4 describes the rotation curve decomposition analysis and the determination of the dark matter distribution in NGC 5005. Section 5 provides a brief summary of the results.
OBSERVATIONAL DATA
Multiwavelength observations have been acquired to probe the stellar and gas content in NGC 5005. Deep NIR images taken at 3.6 μm from the Spitzer Space Telescope trace the extended stellar population, while moderate depth optical broad-band B and R and narrowband Hα provide information about the dominant stellar population and star formation activity. Radio synthesis observations of neutral hydrogen from the Very Large Array (VLA)1 are used to probe both the gas surface density and kinematics. Spectroscopic integral field unit (IFU) observations from SparsePak on the WIYN 3.5 m telescope provide ionized gas kinematics in the central region of NGC 5005. Fig. 1 shows the new VLA H i observations along with optical and NIR imaging data. Table 1 provides a summary of integrated properties derived from this multifrequency data set. We describe the data acquisition and processing below.
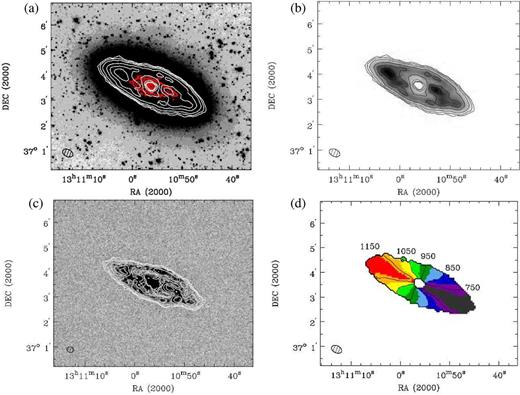
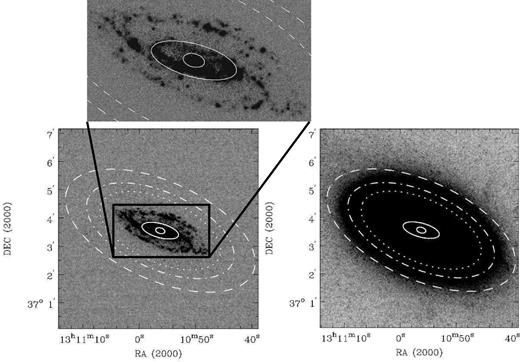
(a) Low spatial resolution H i integrated intensity contours (white) and CO intensity contours from Helfer et al. (2003) (red) overlaid on the Spitzer 3.6 μm image. Note that this field of view focused in on NGC 5005 does not include the entire low surface brightness stellar disc. (b) Low spatial resolution H i intensity contours overlaid on the low spatial resolution H i intensity image. Note the hole in H i emission in the centre. (c) High spatial resolution H i intensity contours overlaid on the Hα image. (d) H i velocity field, or first moment map with isovelocity contours derived from the low spatial resolution H i data. The velocity contour values are indicated in the plot in units of km s−1. The H i intensity contours represent column densities of 1020 atoms cm−2 × (1, 2, 4, 8, 12, and 16) in images (a)–(c).
Integrated properties of NGC 5005.
| Property | NGC 5005 |
|---|---|
| Distancea | 16.5 Mpc |
| Morphological typeb | SAB(rs)bc |
| mB | 10.74 ± 0.02 |
| mR | 9.29 ± 0.02 |
| m3.6 | 6.21 ± 0.01 |
| MB | -20.50 ± 0.02 |
| (B − R)0 | 1.43 ± 0.02 |
| (B-3.6)0 | 4.48 ± 0.02 |
| (R-3.6)0 | 3.05 ± 0.02 |
| log (Hα flux) | −11.42 ± 0.09 erg s−1 cm−2 |
| Equivalent width | 7.93 ± 0.32 Å |
| Total SFR | 0.67 ± 0.14 M⊙ year−1 |
| Total stellar massc | (9.16 ± 1.83) × 1010 M⊙ |
| H i flux | 19.0 ± 3.8 Jy km s−1 |
| Total H i mass | (1.22 ± 0.24) × 109 M⊙ |
| CO fluxb | 1278 ± 484 Jy km s−1 |
| Total H2 massd | (2.73 ± 1.03) × 109 M⊙ |
| Total dynamical masse | (2.82 ± 0.47) × 1011 M⊙ |
Note. – The apparent magnitudes are measured values and are not corrected for extinction. The reported apparent magnitudes and colours are measured at R25. MB and colours are extinction corrected assuming AB = 0.051 and AR = 0.031 (Schlafly & Finkbeiner 2011). The extinction correction for the NIR is assumed to be negligible. The MB value also includes a small correction (0.10 mag) based on an extrapolation of the observed stellar disc.
aTakanashi et al. (2008)
bRC3; de Vaucouleurs et al. (1991)
cAssumed best-fitting M/L3.6 = 0.5 ± 0.1
dHelfer et al. (2003); mass corrected for distance = 16.5 Mpc
eMeasured at Rbreak, assuming the rotational velocity stays constant.
VLA observations
Radio synthesis observations of NGC 5005 using the 21 cm line of H i were obtained with the VLA in C configuration on 2013 August 4 and 5 for a total on-source time of 407 min. The data had an initial frequency resolution of 7.8125 kHz channel−1 (∼1.65 km s−1 channel−1). The standard flux calibrator 3C286 was observed at the beginning and end of each observing block, and the phase calibrator J1227+3635 was observed approximately every 40 min, so that the data may be flux and phase calibrated.
In order to flag uniformly, the data were loaded into aips2 and the inner 75 per cent of the bandpass was combined to generate a ‘channel zero’ data set. The channel zero data was flagged and phase calibrated. The calibration solutions were applied to the line data, which was then bandpass calibrated with 3C286. After calibrations, the data were continuum subtracted in the uv plane and then combined. The combined, continuum subtracted data sets were imaged using the aips task IMAGR. Three cubes were created with different robust weighting parameters for varying spatial resolution and a channel averaging of 3 for a resulting velocity resolution of ∼5 km s−1 channel−1 (for simplicity, these cubes are designated as low, medium, and high; Table 2). Only the cubes with the highest sensitivity (low) and highest resolution without severe loss of sensitivity (high) are shown in Fig. 1. A lower velocity resolution cube (15 km s−1 channel−1) was additionally created to probe the lowest column density of H i gas. This velocity resolution was chosen to match the channel width to the expected line width from thermal gas motions. This cube was also smoothed spatially post-imaging to increase the sensitivity to low column density gas.
H i Synthesis image parameters.
| Image name | Velocity resolution | Robust | Beam size | Beam position angle | Noise |
|---|---|---|---|---|---|
| (km s−1) | (arcsec) | (deg) | (mJy beam−1) | ||
| low | 5.0 | 5 | 26.4 × 17.2 | 64.2 | 0.57 |
| medium | 5.0 | 0.5 | 20.5 × 14.8 | 67.0 | 0.61 |
| high | 5.0 | −0.5 | 16.9 × 13.2 | 72.6 | 0.72 |
| smooth | 14.9 | 5 | 52.9 × 34.5 | 64.2 | 0.53 |
| D configa | 10.4 | 5 | 59.6 × 51.8 | −45.2 | 0.96 |
Note.aArchival VLA D configuration (project code AW536)
In addition to the new VLA C configuration data, there are existing archival VLA D configuration data taken on 2000 August 11 for a total on-source time of 80.3 min (project code AW536). These archival data were retrieved from the archive and processed in aips. Properties of the imaging of this data set are presented in Table 2. The archival D configuration data was not combined with the new C configuration data due to the lower velocity resolution and the smaller frequency coverage of the archival data. The galaxy signal nearly fills the bandpass in the D configuration observations. Despite this, the integrated H i flux and H i mass measured from the archival data is consistent with the new C configuration values within the measurement errors. Both this D configuration data and the spatially smoothed, 15 km s−1 channel−1 velocity resolution cube were used to confirm the lack of detection of low column density gas in the higher resolution cubes.
The total intensity map and velocity field of the final combined C configuration data imaged at the low spatial and 5 km s−1 channel−1 velocity resolution are presented in Figs 1(a), (b) and (d). The velocity field will be discussed in greater detail in Section 3.1. Fig. 1(c) shows the same data in contours imaged at high spatial resolution. The first contour in Figs 1(a), (b) and (c) corresponds to a column density of 1020 atoms cm−2. There are two notable features of the H i emission in NGC 5005 visible in Figs 1(a) and (b). First, there is a slight hole or depression in the H i column density at the centre. This is expected to occur in galaxies where there is a phase change from atomic to molecular gas in the central kiloparsec. Bar-driven transport also tends to concentrate the molecular gas in the centres of galaxies. (Sheth et al. 2005; see also Sakamoto et al. 2000). Archival CO data allows us to trace the molecular gas component in the nucleus to fill in the missing gas surface density information (Section 2.2). Second, the gaseous disc does not extend nearly as far as the stellar disc. Indeed, NGC 5005 is known as an H i-deficient galaxy with a measured mass in H i that is almost half of its expected value (Fumagalli et al. 2009). Furthermore, we did not find low column density gas in either the lower velocity resolution, spatially smoothed map or in the archival D configuration data beyond what is shown in Fig. 1(a). The higher resolution H i contours displayed in Fig. 1(c) show that the neutral gas appears to be spatially coincident with the ionized gas seen in Hα, as is expected for star forming regions in galaxies. Global properties of NGC 5005 measured from this H i data set are presented in Table 1.
The field of view of the H i observations includes not only NGC 5005, but also nearby dwarf galaxies SDSS J131051.05+365623.4, SDSS J131115.77+365911.4, SDSS J131105.57+371036.1, and SDSS J131126.81+371842.3. Only SDSS J131051.05+365623.4 is detected in the H i images (Fig. 2) with a measured flux of 0.21 Jy km s−1 and line width at 50 per cent of the peaks of 33 km s−1; this yields a corresponding H i mass of 1.33 × 10⁷ M⊙ at the adopted distance of 16.5 Mpc. Outside of the primary beam, we also detect NGC 5002 and NGC 5033. No other known or suspected companions were detected in the H i observations.
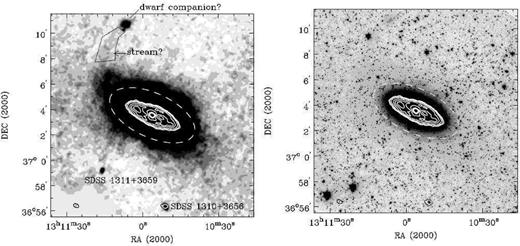
Low spatial resolution H i integrated intensity contours (white) overlaid on the Spitzer 3.6 μm image to show the full extent of the stellar disc. The 3.6 μm image on the left is smoothed and edited to highlight the low surface brightness features, including a possible dwarf companion to the north and a hint of a potential stellar stream connecting it to NGC 5005. The outlined region demarcates where flux assumed to be part of the potential stream was measured. The image on the right shows the unmasked, unsmoothed large field of view around NGC 5005. The dwarf companion SDSS J131051.05+365623.4 (labelled as SDSS 1310+3656 in the left-hand panel) to the south of NGC 5005 is detected in H i. The dwarf companion SDSS J131115.77+365911.4 (abbreviated as SDSS 1311+3659) is also visible to the southeast of NGC 5005 in the left-hand panel. The white dashed ellipse indicates Rbreak (Section 2.5) in both images.
Archival CO
The central hole in H i column density makes it difficult to extract trustworthy total gas surface density measurements from the VLA data alone. Therefore, archival CO data from the Berkeley-Illinois-Maryland Association (BIMA) Survey of Nearby Galaxies (BIMA SONG; Helfer et al. 2003) was acquired to supplement the H i observations of NGC 5005. Observations for the BIMA SONG survey were carried out from 1997 November through 1999 December using the BIMA millimetre interferometer in Hat Creek, CA. The archival CO data cube for NGC 5005 has a velocity resolution of about 10 km s−1 and a spatial resolution of 6.2 arcsec × 6.0 arcsec. The integrated CO intensity is mapped in red contours in Fig. 1(a). A more detailed map can be found in Helfer et al. (2003). This map allows the central molecular gas surface density to be determined. Note that the spatial extent of the molecular gas is confined within the central ∼40 arcsec or ∼3.2 kpc at 16.5 Mpc. As is typical for barred galaxies with CO emission, the molecular gas is concentrated in the centre (Sheth et al. 2005). In the present study, we focus on using the archival CO observations to improve the accuracy of the gas surface density measurements only. A complete analysis of the complex molecular gas dynamics in NGC 5005 can be found in Sakamoto et al. (2000).
WIYN SparsePak
We obtained an Hα velocity field for the central region of NGC 5005 using the SparsePak IFU (Bershady et al. 2004) on the WIYN 3.5 m telescope. The SparsePak IFU is composed of eighty-two 5 arcsec diameter fibers arranged in a fixed 70 arcsec × 70 arcsec rectangle. Observations were acquired on the night of 26 April 2014 during reasonably clear, but non-photometric weather with good seeing. We used the STA1 CCD binned 4 × 3 with the 316@63.4 grating in eighth-order, centred at 6686 Å to cover a wavelength range from 6480 to 6890 Å. This resulted in a velocity resolution of 13.9 km s−1 pixel−1, which is sufficient to derive an accurate velocity field for NGC 5005.
For simplicity, the SparsePak array was aligned on the sky with a position angle (P.A.) of 0°. We used a three pointing dither pattern to spatially fill in gaps between fibers. We took three exposures at 900 s for each dither pointing in order to be able to detect diffuse ionized gas, not just star forming regions. Additional observations of blank sky were also taken to remove sky line contamination more accurately, as NGC 5005 is much more extended than the SparsePak field-of-view (see Fig. 3).
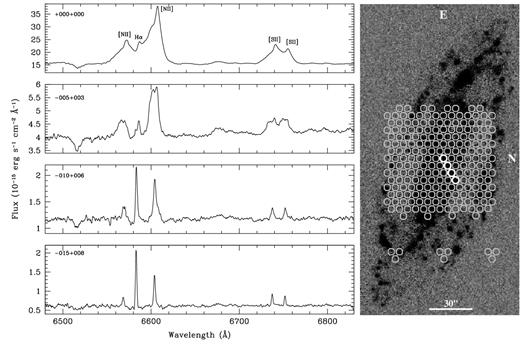
Example spectra extracted from four different fibers from the SparsePak IFU. The positions of the SparsePak fibre apertures on NGC 5005 are displayed on the narrowband Hα image from HDI on the right. The fibers from which the four spectra were extracted are highlighted in white. The image has been rotated such that north is to the right and east is up. The numbers in the top left corner of each spectrum panel indicate the fibre's position offset from the central fibre in arcseconds.
The SparsePak data was processed using standard tasks in the hydra package within iraf.3 The data were bias-subtracted and flattened, and the iraf task DOHYDRA was used to fit and extract apertures from the IFU data. The spectra were wavelength calibrated using a wavelength solution created from Th–Ar lamp observations. The three exposures for each dither pointing were cleaned of cosmic rays. The individual images were sky subtracted using the separate sky pointing scaled to the strength of the 6577 Å sky line, which is close to the redshifted Hα and [N ii] λ6584 lines in some locations. The cleaned, sky subtracted images were averaged together to increase the signal-to-noise ratio and then flux calibrated using observations of spectrophotometric standards from Oke (1990).
We illustrate representative spectra from four SparsePak fibers in the central region of NGC 5005 in Fig. 3 to demonstrate the types of spectral emission found in NGC 5005. The locations of these fibers start in the central nucleus of NGC 5005 and move out towards the north-west just off the minor axis (see the rotated Hα image on the right). While our primary analysis relies on cross-correlation of the entire spectrum, we also fit Gaussian profiles to emission lines of Hα, [N ii], and [S ii] in all the spectra to estimate the full width half-maximum (FWHM) values and the emission line ratios. As seen previously (Burbidge & Burbidge 1965) the strength of the [N ii] λ6584 line emission relative to Hα in the central fibre (+000+000) implies non-thermal emission processes (Baldwin, Phillips & Terlevich 1981). The broadness of the nuclear emission lines from the centre of NGC 5005 are suggestive that the nucleus is accretion powered (Ho et al. 1997). We find an approximate FWHM of 900 ± 200 km s−1 based on single Gaussian fits to [N ii] and [S ii] lines within the central 5 arcsec fibre. The second spectrum in Fig. 3 (−005+003) was extracted from the adjacent fibre to the north-west of the central fibre. This spectrum displays double-peaked emission lines that suggest either infalling or outflowing gas. Indeed, this fibre is placed near where Sakamoto et al. (2000) detected infalling molecular gas in their CO observations of NGC 5005. The third fibre's spectrum (−010+006) still shows broad emission lines with non-thermal line strengths, but less so in both aspects than the central fibre. This spectra is representative of diffuse ionized gas emission in NGC 5005, which we measure to have typical FWHMs of about 140 ± 10 km s−1 and [N ii] λ6584/Hα line ratios of 3.0 ± 1.2, which is consistent with non-thermal or shock excited gas. The fourth fibre's spectrum (−015+008) shown in the bottom panel of Fig. 3 is placed on the ring of Hα emission surrounding the nucleus. This spectrum displays narrower line widths and stronger Hα to [N ii] λ6584 line emission strengths. We find typical FWHMs of approximately 80 ± 5 km s−1 and [N ii] λ6584/Hα ratios of 0.4 ± 0.1 in similar spectra, which are indicative of primarily thermal emission processes most likely due to recent star formation activity (Baldwin et al. 1981).
Inspection of spectra extracted from a few other fibers revealed additional locations with double-peaked emission lines, similar to the −005+003 fibre spectrum. These spectra were located approximately east–west on the sky along where evidence from Sakamoto et al. (2000) suggests a stellar bar exists. We note, however, that double-peaked emission lines may also occur due to smearing of the rotation curve within the 5 arcsec SparsePak fibers. The spectra along the major axis would be most susceptible to this beam smearing as the velocity gradient is highest here. Since the bar is oriented close to the major axis of NGC 5005, it would be difficult to verify that the double-peaked emission lines are signatures of infalling gas along the bar. Alternatively, the beam smearing effect would be minimized for velocities along the minor axis, so it is reasonable to assume that the double-peaked emission lines seen in the −005+003 spectrum in Fig. 3 are real and are not merely due to observational effects.
The flux calibrated, sky subtracted spectra were cross-correlated with a template emission line spectrum to extract the luminosity weighted mean recessional velocity at every position using the iraf task fxcor. We used the spectrum of an H ii region from within NGC 5005 as our reference template for the cross-correlation analysis due to its strong narrow emission lines. Spectra with a Tonry and Davis ratio (TDR; Tonry & Davis 1979) less than five were not included in deriving the velocity field. Spectra with broad or double-peaked emission line profiles resulted in broad cross-correlation peaks that were nonetheless of high significance and had a well-defined centroid. The velocity values from fxcor were then placed into a grid that mapped the SparsePak fibre locations. To fill in the missing spacings, the velocity field was then interpolated using the average value from the nearest eight pixels. Analysis of the velocity field will be discussed further in Section 3.2.
Spitzer 3.6 μm data
Imaging observations at 3.6 μm were obtained using the Infrared Array Camera on the Spitzer Space Telescope on 2012 July 12 and 19. Observations were conducted in a grid-like mapping pattern of 10 × 9 dithered pointings, where each pointing was offset by ∼100 arcsec to cover a total area of 18 arcmin × 33 arcmin. Observations were taken in two sets separated by several days to enable asteroid removal from the mosaicked images. The resulting map has a total exposure time of 1800 s pixel−1. This exposure time provides a sensitivity of a few × 0.01 M⊙ pc−2 over a field of view five times the size of the optical radius R25. After standard processing, the individual pointings were combined into maps using the MOsaicker and Point source EXtractor (mopex) software. Images were drizzled to resample the data to 0.75 arcsec pixel−1 (Fruchter & Hook 2002). The maps were fit for a first-order sky subtraction to remove any gradient in the sky level.
Fig. 2 shows the full extent of the faint stellar disc component of NGC 5005 detected in the final mosaicked and sky subtracted 3.6 μm image. The image on the left has been smoothed to bring out the lowest surface brightness features. The immense sensitivity over such a large field of view enables a complete study of the faint extended stellar component of NGC 5005. NGC 5005 has a large high surface brightness disc, which is surrounded by an even more extended low surface brightness component. This faint stellar population extends about twice as far as the break or transition radius between the high and low surface brightness components and nearly three times farther than the gas disc detected in H i. This is an unusual result, as most spiral and irregular galaxies with H i have a diameter in H i that is larger than the optical diameter (Broeils & Rhee 1997).
There is also a feature that appears to be a faint stellar stream extending to the northeast towards an apparent companion galaxy SDSS J131105.57+371036.1. To measure the stellar mass associated with the apparent stellar stream, we used the smoothed and masked image to create a hand-drawn polygonal aperture that traces the area associated with the diffuse light (Fig. 2). We measured a lower limit for the flux in the stream of 0.15 ± 0.13 mJy based on a conservatively masked image. However, this value significantly underestimates the total flux associated with the stream due to the significant masking required to remove the large area associated with the bright foreground star located in the middle of the stream. Thus, to obtain a more accurate estimate of the total mass associated with the stream, we replaced the masked pixels with a value interpolated from neighbouring pixels and remeasured the total flux to be 0.35 mJy. Assuming the best-fitting disc mass-to-light (M/L) ratio of 0.5 (Section 4) and a distance to NGC 5005 of 16.5 Mpc, this corresponds to a total stellar mass for the stream of 1.8 × 10⁷ M⊙, which is an order of magnitude less massive than notable streams identified around other galaxies, such as M63 (Chonis et al. 2011; Staudaher et al., in preparation) and M83 (Barnes et al. 2014). The apparent companion galaxy is not detected in the H i observations and does not have a redshift measurement available in the literature. However, if SDSS J131105.57+371036.1 is at the same distance as NGC 5005 and we again assume an M/L ratio of 0.5, it would have a total stellar mass of 2.3 × 10⁷ M⊙ (Table 3). Given the slightly larger mass of the apparent companion galaxy, interactions between the apparent dwarf companion and NGC 5005 cannot be immediately ruled out as an origin for the potential stellar stream.
Properties of known and suspected companions to NGC 5005.
| Name | RA, Dec. | Systemica | Angular | Physicalb | Sizec | Position | mB | mR | m3.6 | (B − R)0 | MBb |
|---|---|---|---|---|---|---|---|---|---|---|---|
| (J2000) | velocity | separation | separation | (a × b) | angle | ||||||
| (km s−1) | (arcmin) | (kpc) | (arcsec × arcsec) | (°) | |||||||
| NGC 5005 | 13:10:56.2, 37:03:33 | 948 (1) | − | − | 336.4 × 162.4 | 65.55 | 10.74 ± 0.02 | 9.29 ± 0.02 | 6.21 ± 0.01 | 1.43 ± 0.02 | −20.50 ± 0.02 |
| SDSS J131115.77+365911.4 | 13:11:15.7, 36:59:14 | 956 (2) | 5.85 | 28.1 | 42.4 × 21.6 | −22.24 | 18.56 ± 0.07 | 17.53 ± 0.07 | 15.75 ± 0.01 | 1.01 ± 0.09 | −12.58 ± 0.07 |
| SDSS J131051.05+365623.4 | 13:10:51.0, 36:56:23 | 1026 (2) | 7.24 | 34.7 | 43.8 × 28.2 | 32.21 | 17.76 ± 0.05 | 16.80 ± 0.05 | 14.81 ± 0.01 | 0.94 ± 0.07 | −13.38 ± 0.07 |
| SDSS J131105.57+371036.1 | 13:11:06.2, 37:10:40 | – | 7.29 | 35.0 | 62.8 × 45.4 | −62.08 | 17.71 ± 0.10 | 16.75 ± 0.10 | 15.15 ± 0.01 | 0.94 ± 0.14 | −13.43 ± 0.10 |
| SDSS J131058.75+364943.8 | 13:10:58.6, 36:49:42 | – | 13.72 | 65.9 | 59.4 × 36.2 | −49.14 | 18.28 ± 0.12 | 17.29 ± 0.12 | – | 0.97 ± 0.17 | −12.86 ± 0.12 |
| SDSS J131058.04+364812.4 | 13:10:58.1, 36:48:12 | – | 15.35 | 73.7 | 39.6 × 25.0 | −8.15 | 19.46 ± 0.13 | 18.25 ± 0.13 | – | 1.19 ± 0.19 | −11.67 ± 0.13 |
| SDSS J131126.81+371842.3 | 13:11:26.9, 37:18:42 | 960 (2) | 16.33 | 78.4 | 63.0 × 50.8 | −7.90 | 17.21 ± 0.06 | 16.11 ± 0.06 | – | 1.08 ± 0.09 | −13.93 ± 0.06 |
| kkh 081 | 13:11:11.6, 36:40:46 | 1032 (3) | 22.94 | 110.1 | 58.6 × 35.8 | 17.85 | 18.70 ± 0.16 | 17.68 ± 0.16 | – | 1.00 ± 0.24 | −12.44 ± 0.16 |
| NGC 5002 | 13:10:37.9, 36:38:03 | 1091 (4) | 25.78 | 123.7 | 212.8 × 114.4 | −6.64 | 14.16 ± 0.04 | 13.33 ± 0.04 | – | 0.81 ± 0.05 | −16.98 ± 0.04 |
Note. – The apparent magnitudes are measured values and are not corrected for extinction. B–R and MB are extinction corrected assuming AB = 0.051 and AR = 0.031 (Schlafly & Finkbeiner 2011). The extinction correction for the NIR is assumed to be negligible.
aFrom NED, if known (http://ned.ipac.caltech.edu/): (1) this work; (2) Sloan Digital Sky Survey Data Release 6 (Adelman-McCarthy et al. 2008); (3) Karachentsev, Karachentsev & Huchtmeier (2001); (4) Schneider et al. (1990)
bAssuming a distance of 16.5 Mpc
cSizes indicate the diameter in arcseconds of the apertures used to measure the reported magnitudes, except for NGC 5005 which is the size measured at the optical diameter D25.
The 3.6 μm image of NGC 5005 was decomposed into bulge and disc components to represent the stellar mass distributions in the rotation curve decomposition analysis. Note that the emission at 3.6 μm is predominantly stellar, and not greatly affected by PAH emission at 3.3 μm (Meidt et al. 2012). We used DiskFit (Spekkens & Sellwood 2007) to derive a photometric model that fit bulge and disc components to the 3.6 μm image itself. We did not include a bar component in the photometric model, despite evidence for its existence (Das et al. 2003; Sakamoto et al. 2000), since we only fit stellar bulge and disc components in the mass decomposition (Section 4). Our models are not sensitive to the exact inner structure of the galaxy, so the lack of a bar component will have a negligible effect on the derived dark matter profile. Radial surface brightness profiles of the resulting bulge and disc models are shown in Fig. 4(a). We additionally extracted a surface brightness profile from the 3.6 μm image using concentric, con-eccentric ellipses to provide a consistency check. The DiskFit model and the ellipse photometry yielded similar total surface brightness profiles. NGC 5005's surface brightness profile displays a relatively small bulge component with a complex disc component featuring a break, or change in slope of the exponential disc where the transition from high to low surface brightness stellar disc occurs. The break radius was estimated by fitting two exponentials to the radial ranges of 80–180 arcsec (inner) and 280–443 arcsec (outer). The radial ranges were chosen so as to avoid locations where the surface brightness profile displays a change in slope. Specifically, the inner limit of 80 arcsec avoids the bulge component and the dip in surface brightness around 40 arcsec. Scale lengths of these inner and outer exponential fits are given in Table 4. The break radius is defined as the radius at which the two different exponential fits intersect, which is 216.3 arcsec (or 17.3 kpc at 16.5 Mpc). This break radius is indicated on the bottom axis of the panels in Fig. 4, along with the optically defined R25 (see Section 2.5) and radial extent of the H i disc. The size of the neutral gas disc is only about 60 per cent of the size of the high surface brightness stellar disc, as measured by Rbreak. Fig. 4(b) shows the radial trends in B-3.6 and R-3.6 colours. The colours display nearly identical trends with radius featuring a relatively complex distribution in the inner ∼80 arcsec most likely due to star formation in spiral arms.
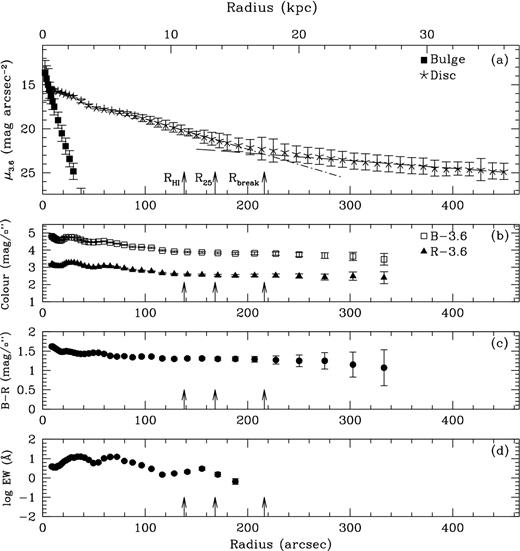
(a) Surface brightness profile at 3.6 μm decomposed into bulge (squares) and disc (stars) components. The dashed–dotted and dashed lines are exponential fits to the radial ranges 80–180 arcsec and 280–443 arcsec, respectively. The arrows represent the radial extent of the H i disc, the optically defined R25, and the approximate radius at which there is an observed change in slope of the outer exponential disc. (b) Radial trend in B-3.6 (squares) and R-3.6 (triangles) colour. (c) Radial trend in B–R colour. (d) Radial trend in the log Hα EW.
Radial properties of NGC 5005.
| Parameter | Value |
|---|---|
| Inner scale length (3.6 μm) | 31.6 arcsec (2.5 kpc at 16.5 Mpc) |
| Outer scale length (3.6 μm) | 124.6 arcsec (10.0 kpc at 16.5 Mpc) |
| Outer break radius (3.6 μm) | 216.3 arcsec (17.3 kpc at 16.5 Mpc) |
| D25 | 336.4 arcsec (26.9 kpc at 16.5 Mpc) |
| H i size at 1020 atoms cm−2 | 276 arcsec (22.1 kpc at 16.5 Mpc) |
| Concentration (C = 5|$\log {\frac{R_{80}}{R_{20}}}$|) | 4.3 |
| log (equivalent width) gradient | −0.11 log (EW) arcmin−1 |
| Colour gradient (B–R) | −0.13 colour arcmin−1 |
Aperture photometry on the 3.6 μm image was carried out using the galphot4 package for iraf. Concentric, con-eccentric ellipses were used to measure the integrated magnitude at R25 (Section 2.5) given in Table 1. No foreground extinction correction was used for the NIR since the expected value is negligible. The total stellar mass presented in Table 1 was determined from the total stellar luminosity at 3.6 μm assuming an M/L ratio of 0.5 (see Section 4). The luminosity was calculated from the absolute magnitude at 3.6 μm, which includes a slight correction (0.04 mag) based on an extrapolation of the 3.6 μm surface brightness. The ellipse photometry was also used to estimate the concentration of light in NGC 5005 using the definition from Conselice (2003, see Table 4). Our calculated value of 4.3 is towards the higher end of concentrations and is in agreement with the value of 4.16 measured in the R-band for NGC 5005 by Conselice (2003). McDonald, Courteau & Tully (2009) performed a study of NIR surface brightness distributions of Virgo cluster galaxies and discovered a bimodality of concentration with peaks at C = 3 and 4.5 in high surface brightness disc galaxies. The concentration value determined here for NGC 5005 is consistent with the second peak in the bimodal distribution.
Optical data
Optical broad-band B and R and narrowband Hα images provide insight into changes in the age or metallicity of the dominant stellar population in NGC 5005. Observations were taken with the WIYN 0.9 m telescope at Kitt Peak National Observatory in 2013 February with the S2KB imager and April 2014 with the Half-Degree Imager (HDI). NGC 5002, which was detected outside the primary beam in the VLA data, was also observed with HDI. During both observing runs, narrowband imaging was done using a filter with FWHM of about 60 Å centred at a wavelength of 6580 Å. A filter with similar FWHM and slightly offset central wavelength was used for continuum subtraction. The Hα images were taken with total exposure times of 2 × 20 min in the 6580 Å filter, and 20 min in the narrowband continuum filter. Broad-band imaging was done with three exposures of 900 and 300 s with the B and R filters, respectively. An additional short R-band exposure was acquired to replace saturated pixels in the core of NGC 5005.
The optical images were reduced and analysed with the iraf package. The image reduction included bias subtraction and flat fielding. Both the S2KB and HDI images were flat-fielded using twilight flats for the broad-band filters and dome flats for the narrowband. Prior to combination, sky values were measured as the mode of galaxy-free regions of the images. The images were then scaled, aligned, and averaged together to make a final combined image. The world coordinate system was updated using star lists from the USNO catalogue. The S2KB and HDI images were processed independently in order to provide internal consistency checks for the derived structural parameters. Since the HDI images have slightly higher quality and a larger field of view than the S2KB images, the subsequent analysis will focus on results from the HDI observations.
In addition to NGC 5005, our HDI observations include eight known or suspected companion galaxies, including NGC 5002 (Table 3). Velocities presented for the known companions in Table 3 are from the NASA/IPAC Extragalactic Database (NED).5 The three unconfirmed companions are diffuse, irregular galaxies that do not appear to be larger background galaxies based on visual inspection of the broad-band images. These galaxies are identified using the Sloan Digital Sky Survey (SDSS) designation that most closely matched the photometric centre of the galaxies. No corresponding H i or Hα emission was detected for the unconfirmed companion galaxies that look like they might be associated with NGC 5005. The absolute B-band magnitudes presented in Table 3 are calculated assuming a distance of 16.5 Mpc.
Aperture photometry of NGC 5005 using concentric and con-eccentric ellipses was carried out to derive surface brightness magnitudes for both the B- and R-band HDI images. Table 1 gives measured integrated magnitudes derived from the aperture photometry. The integrated apparent magnitudes tabulated here are measured at the radius at which the B-band surface brightness equals 25 mag arcsec−2 (R25) and are not corrected for foreground extinction. The absolute B-band magnitude has been corrected for extinction (Schlafly & Finkbeiner 2011) and includes a correction (0.10 mag) based on an extrapolation of the B-band surface brightness profile. Integrated colours are also measured at R25 and have been extinction corrected.
Inspection of the Hα image indicates that there are no visible star formation regions beyond R25. Aperture photometry was performed on the Hα image to measure an Hα flux and derive an equivalent width (EW). The current total star formation rate (SFR) is derived from the Hα flux (measured at R25) using the calibration given in Kennicutt & Evans (2012). The calculated SFR of 0.67 ± 0.14 M⊙ yr−1 is much lower than the median value of about 1.5 M⊙ yr−1 found by James et al. (2004) for galaxies of the same Hubble T-type as NGC 5005. However, this SFR is most likely an underestimate due to internal extinction, which we cannot accurately account for without a spatially resolved total infrared map due to the strong AGN contamination. The EW of the Hα emission line is used as a tracer of the specific SFR. It is calculated by dividing the Hα flux by the continuum flux density measured from the Hα narrowband continuum filter. It, therefore, serves as an indicator of the strength of the current SFR relative to the past average SFR. A larger EW value would indicate a larger current SFR relative to the continuum, or past average star formation. NGC 5005 has a relatively small EW value of 7.93 ± 0.32 Å, which is consistent with the little Hα emission seen in the narrowband image. This EW is also more of an upper limit as it is contaminated by strong [N ii] emission from the AGN in NGC 5005. Despite this, the derived EW value places NGC 5005 in the same regime as other Sbc morphological type galaxies in the MB-EW and (Vmax)-EW planes as found in Lee et al. (2007).
In addition to integrated properties from the aperture photometry, radial profiles were also created to examine the surface brightness values in each elliptical annulus. Fig. 4 shows the radial changes in the surface colours B-3.6, R-3.6 (b), and B–R (c) (see also Section 2.4), as well as the radial trend in EW (d). The radial trend in B–R is typical of large spiral galaxies, going from redder in the bulge-dominated nuclear region to bluer in the disc where more of the current star formation is occurring (e.g. Markarian, Oganesian & Arakelian 1965). After the initial gradient from red to blue, the B–R colour remains roughly constant through the disc of NGC 5005. There does not appear to be any change in B–R colour corresponding to either the extent of the H i gas, R25, or the change in the outer disc exponential slope (Rbreak). The radial trend in EW is much less regular than the B–R colour trend. The higher values of EW correspond to spiral arms where there are more H ii regions from recent star formation activity. Table 4 gives estimates of the EW gradient and B–R colour gradient from a linear fit to these profiles.
For visual reference, the characteristic radii described above are overplotted on both the Hα and R-band images in Fig. 5. The images are displayed with the same scale to exemplify the concentration of the ionized gas emission (left) and extent of the stellar disc (right). As is expected, the morphology of the ionized gas emission in the central ∼40 arcsec directly matches the morphology of molecular gas emission mapped in CO by Sakamoto et al. (2000). As can be seen in the zoom-in image, this morphology features a central nuclear disc (first solid ellipse) with a ring of emission at about 30–40 arcsec (second solid ellipse; referred to as the 3 kpc ring in Sakamoto et al. 2000). The two central ellipses have semimajor axes of 10 and 40 arcsec, respectively, assuming an inclination angle of 53° (from Sakamoto et al. 2000) and P.A. of 75°. The Hα emission continues beyond this central region tracing the spiral arms, which appear to emanate from either end of the ring along the semimajor axis. The ionized gas emission is contained within the H i disc (first dotted ellipse). The R-band image on the right shows a high surface brightness disc component that extends beyond R25 (middle dashed–dotted ellipse) followed by a low surface brightness component that begins slightly within the break radius (outermost dashed ellipse). The H i disc (innermost dotted ellipse) lies well inside the high surface brightness disc component.
Left: narrowband Hα image of NGC 5005 from HDI. Right: masked and interpolated R-band image of NGC 5005 from HDI. The inner two solid ellipses demonstrate the size of the nuclear disc and ring structure, respectively (see Section 2.5). The outer three ellipses demarcate the three radii shown in Fig. 4: |$R_{\rm H\,\small {I}}$| (dotted), R25 (dashed–dotted), and Rbreak (dashed), listed in order of increasing size.
GAS KINEMATICS
In this section, we return to the H i synthesis observations to explore the neutral gas kinematics. In addition, we use IFU spectroscopy to extract ionized gas kinematics in the central region of NGC 5005. We use both ionized and neutral gas kinematics to derive the circular rotational velocities of the gas as it follows the overall gravitational potential of the galaxy. Starting with the velocity field, we follow well-established techniques to determine the bulk motions of the gas from which we extracted a rotation curve. This process is described in more detail below.
Neutral gas kinematics
Beginning with the H i, we used standard analysis tools distributed as part of the gipsy software package (van der Hulst et al. 1992) for analysis of H i synthesis data cubes to extract an intensity-weighted mean velocity field for NGC 5005. To create this first moment map, individual channels from the low-resolution data cube at 5 km s−1 channel−1 were smoothed by a factor of 3, and clipped at the 3σ level, then interactively blotted to identify signal. Fig. 1(d) shows the final velocity field with isovelocity contours. The straight isovelocity contours seen in Fig. 1(d) indicate that the rotational velocity of the gas remains fairly constant with radius with no obvious signs of a warp at large radii. Kinematic warps due to changes in position and/or inclination angle of the disc often result in a velocity field with a characteristic S-shaped distortion seen at larger radii (e.g. M83; Bosma 1981). The low signal-to-noise of the H i observations within the central ∼20 arcsec (1.6 kpc at 16.5 Mpc) makes it difficult to trace the H i gas motions. However, as introduced previously, Sakamoto et al. (2000) found an S-shaped distortion in the CO velocity field. This central kinematic distortion is most likely due to the presence of a bar causing the gas to be in non-circular orbits.
The filled circles in the bottom panel of Fig. 7 show the rotation curve for NGC 5005 derived by fitting a series of concentric tilted rings to the H i velocity field (gipsy task rotcur). In this analysis, the galaxy is described using a set of concentric rings, each with its own centre coordinates (x0, y0), systemic velocity (Vsys), expansion velocity, inclination angle (i), P.A., and rotation velocity (Vrot). The radii and widths of the rings are defined such that the rotation curve is sampled at a rate of two points per synthesized beam width, which in this case is every 10 arcsec. The expansion velocity is fixed to zero. Initial estimates for the centre coordinates, inclination angle, and P.A were first obtained by fitting ellipses to the H i intensity distribution out to 3σ (gipsy task ellfit). The systemic velocity was measured from the spectral profile derived from the integrated intensity H i map. These initial values were fed into rotcur and iteratively fit to the receding and approaching sides together. Once the centre position (x0, y0) was fixed, rotcur was run again to determine Vsys with i and P.A. as free parameters. Additional runs of rotcur were used with (x0, y0) and Vsys fixed to determine i and P.A. for a combination of both sides. The rings are allowed to vary in position and inclination angle as a function of radius to account for warps (top panels). However, point-to-point variations in i can be caused by effects such as streaming motions along spiral arms for which the fitting routine tries to compensate by changing i (de Blok et al. 2008). A smoothly varying or constant distribution in i, and P.A. was adopted to derive the underlying bulk rotation and prevent spurious second-order effects in the rotation curve. Because variations in position and inclination angle were small, constant position and inclination angles were used for this analysis (dashed lines). Smoothly varying fits to both the inclination and P.A were also tried and determined to be unnecessary as this only changed the derived circular rotational velocities by a few km s−1. A final run of rotcur was done with all parameters fixed to derive the final azimuthally averaged rotation curve (bottom panel, filled circles).
Uncertainties on the rotational velocities were conservatively estimated to be a combination of non-circular thermal gas motions and inclination errors. The uncertainties on the rotational velocities for the first two radii are dominated by thermal gas motions and beam smearing. A velocity dispersion, or second moment map, was created from the high resolution H i data cube. Uncertainties due to thermal gas motions were estimated to be about 10 per cent of the average velocity dispersion values, which is the accuracy to which we believe the line centroid can be estimated. The velocity dispersion for NGC 5005 in the radial range 20–40 arcsec is quite large; average values range between 40 and 50 km s−1. This is why the first two rotation curve points have noticeably larger error bars than the rotational velocities farther out where the dispersion drops to more typical values on the order of 15 km s−1. Outside of r ≳ 40 arcsec, the uncertainties are dominated by inclination angle errors. Due to the relatively high inclination angle (∼68°) of NGC 5005, an inclination angle error of ± 10° in the inner parts and ± 5° in the outer parts produces corresponding rotational velocity errors of ≲ 10 and ≲5 per cent, respectively. Circular rotational velocities and their errors in the central 20′′ were not derived from the neutral gas data due to the low signal-to-noise in the H i data.
The rotation curve for NGC 5005 is remarkably flat; it varies by less than 10 km s−1 over a range of radii from 20 to 140 arcsec (1.6–11.2 kpc at 16.5 Mpc). The last measured rotational velocity is 265.2 ± 22.0 km s−1 which yields a dynamical mass of (1.83 ± 0.30) × 1011 M⊙ at 140 arcsec (11.2 kpc at 16.5 Mpc). If we assume that the rotation curve remains flat and extrapolate out to the break radius, this results in a dynamical mass of (2.82 ± 0.47) × 1011 M⊙ measured at 216.3 arcsec (17.3 kpc at 16.5 Mpc).
The H i rotation curve for NGC 5005 was additionally derived using a code for modelling asymmetries in disc galaxies (DiskFit; Spekkens & Sellwood 2007). DiskFit uses a physically motivated model rather than a parametrization of concentric rings. It is capable of fitting models with both rotation and lopsided or bisymmetric non-circular motions, as would be expected due to the presence of a bar (Kuzio de Naray et al. 2012). Rotation curves for NGC 5005 were derived using three different models: rotation only, lopsided flow, and bisymmetric flow. Due to the low signal-to-noise ratio of the H i at radii smaller than 20 arcsec, only the rotation dominated parts of the velocity field were fit. Rotation curves derived from all three DiskFit models, therefore, were in good agreement with a rotation only model and the tilted ring fits from rotcur. Derived best-fitting kinematic parameters from gipsy's rotcur and DiskFit's rotation only model are presented in Table 5.
Kinematic properties of NGC 5005.
| Parameter | rotcur value | DiskFit value |
|---|---|---|
| Kinematic centre (RA, Dec. J2000) | 13:10:56.28, +37:03:31.7 | 13:10:39.05, +37:05:35.4 |
| Systemic velocity | 948 km s−1 | 944 km s−1 |
| Adopted P.A. | 65.6° | 65.2° |
| Adopted inclination angle | 68.1° | 67.8° |
| Parameter | rotcur value | DiskFit value |
|---|---|---|
| Kinematic centre (RA, Dec. J2000) | 13:10:56.28, +37:03:31.7 | 13:10:39.05, +37:05:35.4 |
| Systemic velocity | 948 km s−1 | 944 km s−1 |
| Adopted P.A. | 65.6° | 65.2° |
| Adopted inclination angle | 68.1° | 67.8° |
Ionized gas kinematics
Given the low signal-to-noise ratio of the H i observations in the inner 20 arcsec of NGC 5005, we turn to ionized gas to provide kinematic constraints in this inner region. Fig. 6 shows the ionized gas emission map as traced by the [N ii] λ6584 line flux (left) and luminosity weighted mean velocity field determined from cross-correlation of the entire spectrum (right). We used the [N ii] λ6584 emission line to demonstrate the distribution of ionized gas in the central 70 arcsec of NGC 5005, as the Hα flux is often affected by underlying stellar absorption in the diffuse gas regions. Regions where the [N ii] λ6584 line flux is strongest represent areas with higher signal-to-noise ratios with typical TDR values around 40 from the cross-correlation results. The lower signal-to-noise ratio areas still have reliable cross-correlation results with TDR values closer to 20. We used rotcur in gipsy to derive a rotation curve from the ionized gas velocity field following the same steps for the H i data outlined above. The rotation curve derived from SparsePak ionized gas observations is shown in Fig. 7 (open stars). The ionized gas velocity field was sampled every 5 arcsec out to a radius of 35 arcsec. We allowed the P.A. inclination angle, and the systemic velocity to be fit by rotcur and not constrained to the values used for the H i derived rotation curve. Constant values of position and inclination angle were adopted (dash–dot lines). The ionized gas data fills in the central kinematics that are unconstrained by the H i observations and extends up towards the H i derived rotation velocity at 40 arcsec. The inner two H i rotation curve data points display higher rotational velocities than the ionized gas, but this is most likely due to the effects of beam smearing.
![Left: SparsePak [N ii] λ6584 emission line flux map for the central 70 arcsec × 70 arcsec of NGC 5005. The [N ii] λ6584 flux map illustrates where the ionized gas emission is strongest and thus where the cross-correlation analysis has the highest signal-to-noise ratio. Right: Luminosity weighted mean velocity field for the central 70 arcsec × 70 arcsec from SparsePak observations of ionized gas. Contours represent lines of constant rotational velocity, the values of which are indicated above and on the left in units of km s−1.](https://oup.silverchair-cdn.com/oup/backfile/Content_public/Journal/mnras/449/4/10.1093_mnras_stv568/1/m_stv568fig6.jpeg?Expires=1716398632&Signature=ppAngQ7ynnvA2F6RWWTJLoVuTdPETAlJNZvnuG2C0yJBqTm4zBh9n3YExRH9~Lb-vSMTaJrXtP30NlIvBwcqKcuKf~vLx36Hx6EYPGjwN4Q-SxqMiLXsdLq8wfTYzTqi-wk26HU1WcQN7aQk~zuPKbtklCEJMSsFCT1n6IKNcXo9Fo5ZLozOTXfXKhAun4H6IhF8P-U-O19LMGGuv4T6JQGsD0x0hX~gp0xMW7U4x1KMbbgK8qeHEgAu86Eoe1xvL5FKTAAspesdro374-vR7USXD-EEepMhVzy92SJFV3aXLy5p4DEgm-xwI69j09EjCqzyjwAYFBMUTIitDK57iQ__&Key-Pair-Id=APKAIE5G5CRDK6RD3PGA)
Left: SparsePak [N ii] λ6584 emission line flux map for the central 70 arcsec × 70 arcsec of NGC 5005. The [N ii] λ6584 flux map illustrates where the ionized gas emission is strongest and thus where the cross-correlation analysis has the highest signal-to-noise ratio. Right: Luminosity weighted mean velocity field for the central 70 arcsec × 70 arcsec from SparsePak observations of ionized gas. Contours represent lines of constant rotational velocity, the values of which are indicated above and on the left in units of km s−1.
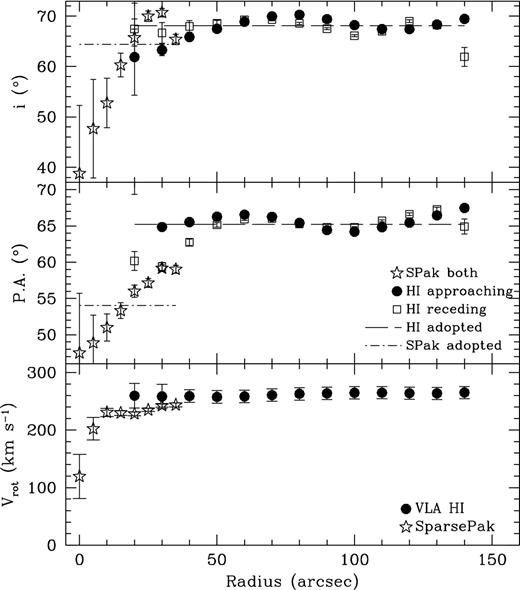
Rotation curves for VLA H i and SparsePak (SPak) ionized gas derived from tilted rings using the gipsy task rotcur. The radial range fit for the H i was from 20 to 140 arcsec (1.6–11.2 kpc at 16.5 Mpc) and 0–35 arcsec (0–2.8 kpc at 16.5 Mpc) for the ionized gas. Top: inclination angle fits to the approaching (filled circles) and receding (open squares) sides and the adopted constant inclination angle fit to both sides (dashed line) of the H i velocity field. Both sides of the SparsePak velocity field were fit at the same time (open stars), and a constant inclination angle was also adopted (dot–dashed line). Middle: P.A. fits to the approaching (filled circles) and receding (open squares) sides and the adopted constant P.A. fit to both sides (dashed line) of the H i velocity field. The open stars show the SparsePak P.A.s fit to both sides of the velocity field and dash–dot line shows the adopted constant P.A. Bottom: circular rotational velocities fit to both sides for the H i (filled circles) and SparsePak ionized gas (open stars) derived using the adopted inclination and P.A.s at each radius.
While the ionized gas morphology agrees well with the CO morphology found by Sakamoto et al. (2000), we do not observe as large of a velocity in the nuclear disc (r < 10 arcsec). This difference could arise because the ionized gas rotational velocities were derived from the centroid of the emission line detected in a 5 arcsec fibre and, therefore, do not include the high velocity dispersion of gas associated with the AGN. We do, however, detect the same central S-shaped distortion in the ionized gas velocity field, as was detected by Sakamoto et al. (2000) in the CO. Given the similar morphologies, it is plausible that the ionized gas is subjected to the same bar-driven dynamics as the molecular gas discussed extensively in Sakamoto et al. (2000).
DARK MATTER MASS DECOMPOSITION
Rotation curve decomposition analysis is a powerful tool to probe the dark matter content in galaxies (e.g. de Blok et al. 2008). This well-established analysis method combines the derived galaxy kinematics from the observed rotation curve with estimates of the baryonic mass distribution in order to derive an estimate of the dark matter distribution as a function of radius (e.g. de Blok & Bosma 2002). de Blok et al. (2008) found that both widely used dark matter models (NFW and isothermal) fit equally well for galaxies with MB < −19. In this analysis, we fit only the spherical pseudo-isothermal dark matter halo model to the observations as the data are not sensitive to the central dark matter distribution.
One of the strengths of the present analysis is the use of NIR data to derive stellar bulge and disc distributions. In particular, the Spitzer 3.6 μm images are relatively insensitive to radial changes in M/L ratio that might be introduced by either internal dust obscuration or changes in the dominant stellar population. Indeed, the M/L ratio at 3.6 μm is nearly independent of star formation history (e.g. Li et al. 2007; Meidt et al. 2014). The combination of NIR, H i, and CO observations allow many of the uncertainties associated with the spatial distribution of both major baryonic components (gas and stars) to be minimized.
The contributions from gas and stars to the overall rotation curve for NGC 5005 were calculated from the gas mass and stellar light surface density profiles. The gas mass surface density was measured from the H i and CO integrated intensity maps. The gas distributions were derived separately and then added together to create a total gas mass surface density distribution. The contribution to the total circular rotational velocity was calculated from the total gas distribution using the gipsy task rotmod assuming an infinitely thin gas disc. Following Broeils (1992), the total gas mass was multiplied by a factor of 1.3 to account for primordial helium. Fig. 8 shows the gas mass surface density distributions for the H i and H2 (as traced by CO) separately (filled circles and stars, respectively), as well as the resulting total gas distribution when added together (dashed line). The molecular gas is the dominant contribution to the total gas mass surface density for radii within 60 arcsec (4.8 kpc at 16.5 Mpc). The bump in the molecular gas distribution between 30 and 40 arcsec corresponds to the ring of emission observed in the narrowband Hα image (Section 2.5 and Fig. 5). Model rotation curves for the stellar distributions were derived separately for the bulge and disc based on the decomposed light surface density profiles discussed in Section 2.4. The contribution to the total circular rotational velocity for these stellar components was calculated with rotmod. A vertical sech-squared distribution with a vertical scale height of 0.93 kpc estimated using the fiducial relation derived in Bershady et al. (2010) was used for the stellar disc model. A spherical distribution was assumed for the bulge model rotational velocities.
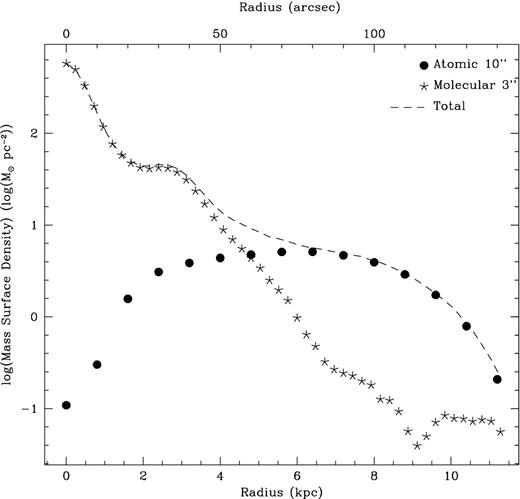
Atomic and molecular gas mass surface density distributions for NGC 5005. The atomic (filled circles) and molecular (stars) gas distributions are derived from the H i and CO integrated intensity maps, respectively (see Fig. 1 a). The spatial sampling for each distribution is roughly half the beam size from their respective maps (20 arcsec for H i and 6 arcsec for CO). The dashed line represents the total gas mass surface density when the atomic and molecular distributions are added together. Mass surface densities are plotted as the log of the value.
Fig. 9 presents the rotation curve decomposition for NGC 5005. Circular rotation velocities for the total gas, stellar bulge, and stellar disc were summed in quadrature and subtracted from the observed rotation curve. A spherical pseudo-isothermal dark matter halo model was fit to the residuals. The bulge and disc M/L ratios were left as free parameters to be fit during the decomposition. They were assumed to be constant with radius. For this galaxy, leaving the stellar disc and bulge M/L ratios in addition to the characteristic radius (RC) and velocity (VH) of the dark matter halo model as free parameters creates a poorly constrained problem without a unique solution. Therefore, the best-fitting RC, VH, M/Lbulge, and M/Ldisc were achieved using interactive fitting. The best fit achieved in this analysis resulted in a disc M/Ldisc = 0.5 and a bulge M/Lbulge = 0.4. This disc M/L is consistent with Eskew, Zaritsky & Meidt (2012) who suggest that the M/L ratio at 3.6 μm should be about 0.5 based on stellar population models and measurements of the Large Magellanic Cloud. The bulge and disc M/L ratios result in a best-fitting dark matter halo model with a characteristic radius of 2.5 ± 0.1 kpc and a velocity of 228 ± 1.0 km s−1. The observed rotation curve could not be adequately described at large radii using the baryonic contributions alone (crosses in Fig. 9).
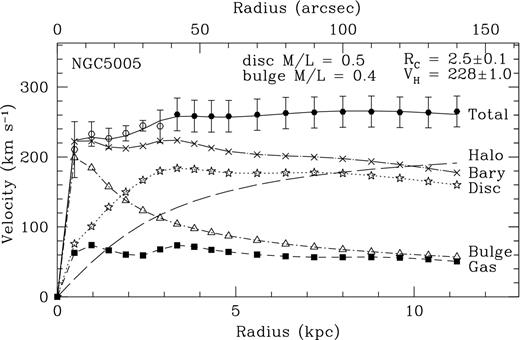
Decomposition of the rotation curve from the H i, optical, and NIR data. The total gas (filled squares), stellar bulge (open triangles), stellar disc (open stars), and dark matter halo model (dashed line) components are added in quadrature to achieve the best overall fit (solid line) to the observed rotation curve. Open circles represent circular rotation velocities derived from the ionized gas (SparsePak) observations, and the filled circles are from the H i (VLA) observations. Adding the baryonic components in quadrature without the dark matter results in the crosses. This total baryonic contribution primarily follows the stellar distribution in this gas-deficient galaxy.
The dip in velocity in the observed ionized gas rotation curve between 12 and 24 arcsec (0.96–1.92 kpc at 16.5 Mpc) is an interesting feature which demonstrates the connection between the galaxy morphology and its kinematics. It appears to occur in the transition region between the nuclear disc and ring structure, as seen in the Hα image (Fig. 5 left) and detected in CO emission (Sakamoto et al. 2000). This region corresponds to a decrease in the total gas contribution to the overall rotation curve, which is dominated by the molecular gas at these inner radii (Fig. 8), as well as to where the stellar contribution to the overall rotation curve transitions from being bulge- to disc-dominated. It is also visible as a prominent dip in the EW profile seen in Fig. 4(d).
The mass decomposition reveals that NGC 5005 is baryon dominated at the innermost radii. NGC 5005 follows the same trend as most other massive, luminous galaxies where its mass is baryon dominated in the core and gradually becomes more dark matter dominated with increasing radius (e.g. de Blok et al. 2008). Furthermore, galaxies of similar dynamical mass from de Blok et al. (2008), such as NGC 6946 and NGC 7331, display rotation curve decompositions similar to that of NGC 5005 where the dark matter halo contribution to the total rotation curve does not overtake the stellar disc contribution to the total rotation curve until close to or beyond the last measured point. The fractional contribution of the maximum stellar disc to the rotation curve at 2.2 times the disc scale length is only 0.71 in NGC 5005. This implies that the stellar disc can only explain about 70 per cent of the observed rotation curve at the point where the stellar disc's contribution should be greatest. This is slightly less than average values found for other samples of galaxies (Swaters et al. 2011 and references therein), which were between 0.8 and 0.9.
CONCLUSION
We have acquired multiwavelength observations to examine the gas and stellar content in NGC 5005. We have utilized new VLA C configuration observations to explore the neutral hydrogen gas morphology and kinematics, as well as SparsePak IFU observations to derive kinematics of the ionized gas in the central region of NGC 5005. Deep 3.6 μm images from Spitzer allow us to trace the extended stellar population. Finally, we have used optical broad-band B and R and narrowband Hα observations to detect properties of the dominant stellar population and star formation activity. The main results from this multiwavelength study are summarized below.
The most striking morphological feature of NGC 5005 is its extended stellar population. The neutral and molecular gas components are both confined well within the high surface brightness stellar disc. The low surface brightness stellar component appears to extend nearly three times beyond the gas disc detected in H i. The central 40 arcsec of NGC 5005 has a lack of detectable H i, but displays both molecular and ionized gas emission.
Spectra of the ionized gas in the central region of NGC 5005 reveal signatures of both thermal and non-thermal emission processes. The nuclear AGN region displays broad emission lines with non-thermal line intensity ratios. Double-peaked emission lines are seen to the north-west of the nucleus, approximately where Sakamoto et al. (2000) found dynamical evidence for infalling gas potentially due to an inconspicuous stellar bar. The ionized gas emission outside of the nuclear disc appears to be dominated by thermal processes from recent star formation activity.
Inspection of the optical broad-band images reveals numerous known and suspected companions of NGC 5005. These include SDSS J131051.05+365623.4 which was detected in the VLA observations and SDSS J131105.57+371036.1, which appears to be possibly connected to NGC 5005 by a faint stellar stream.
Surface photometry of NGC 5005 shows a NIR surface brightness distribution with a central bulge component and an inner and outer exponential disc. The radial profile of optical colour displays a distribution that is typical for large spirals like NGC 5005 and is consistent with NGC 5005 having little current star formation activity. The unusually low SFR and EW measurements from the Hα imaging are expected given the gas poor nature of NGC 5005.
A rotation curve for NGC 5005 was derived from both the neutral and ionized gas kinematics. The ionized gas rotation curve in the central region of NGC 5005 exhibits structure which can be connected directly to the ionized gas morphology (which follows the molecular gas), and also appears to correspond to the stellar distribution as it transitions from bulge to disc dominated. The H i rotation curve at large radii is remarkably flat and exhibits no signs of warps.
The gas kinematics and surface densities were used in conjunction with the stellar bulge and disc light profiles to decompose the observed rotation curve of NGC 5005 and derive a model dark matter distribution. The results of the mass decomposition demonstrate that NGC 5005 is baryon dominated in its central region and that the prominent stellar disc only maximally contributes about 70 per cent to the total rotation curve.
The authors acknowledge observational and technical support from the NRAO. We acknowledge use of the WIYN 0.9 m telescope operated by WIYN Inc. on behalf of a Consortium of ten partner Universities and Organizations, and the WIYN 3.5 m telescope. WIYN is a joint partnership of the University of Wisconsin at Madison, Indiana University, Yale University, and the National Optical Astronomical Observatory. This work is based on observations made with the Spitzer Space Telescope, which is operated by the Jet Propulsion Laboratory, California Institute of Technology under a contract with NASA. EER acknowledges support from the Provost's Travel Award for Women in Science, a professional development fund supported through the Office of the Provost at Indiana University Bloomington. This research has made use of the NED which is operated by the Jet Propulsion Laboratory, California Institute of Technology, under contract with the National Aeronautics and Space Administration.
The VLA is operated by the NRAO, which is a facility of the National Science Foundation operated under cooperative agreement by Associated Universities, Inc.
The Astronomical Image Processing System (aips) has been developed by the NRAO.
iraf is distributed by NOAO, which is operated by the Association of Universities for Research in Astronomy, Inc., under cooperative agreement with the National Science Foundation.
GALPHOT is a collection of scripts in the iraf STSDAS environment first developed by W. Freudling and J. J. Salzer. The current version has been further enhanced by members of the Cornell Extragalactic Group and is maintained by M. P. Haynes.
The NED is operated by the Jet Propulsion Laboratory, California Institute of Technology, under contract with the National Aeronautics and Space Administration.
