


Abstract
The peculiar low-mass X-ray binary XSS J12270−4859, associated with the Fermi/LAT source 2FGL J1227.7−4853, was in an X-ray, gamma-ray and optical low-luminosity persistent state for about a decade until the end of 2012, when it entered into the dimmest state ever observed. The nature of the compact object has been controversial until the detection of a 1.69 ms radio pulsar early 2014. We present optical spectroscopy and optical/near-IR photometry during the previous brighter and in the recent faint states. We determine the first spectroscopic orbital ephemeris and an accurate orbital period of 6.912 46(5) h. We infer a mid G-type donor star and a distance d = 1.8–2.0 kpc. The donor spectral type changes from G5 V to F5 V between inferior and superior conjunctions, a signature of strong irradiation effects. We infer a binary inclination 45° ≲ i ≲ 65° and a highly undermassive donor, M2 ∼ 0.06–0.12 M⊙, for a neutron star mass in the range 1.4–3 M⊙. Thus, this binary joins as the seventh member the group of ‘redbacks’. In the high state, the emission lines reveal the presence of an accretion disc. They tend to vanish at the donor star superior conjunction, where also flares are preferentially observed together with the occurrence of random dips. This behaviour could be related to the propeller mechanism of the neutron star recently proposed to be acting in this system during the high state. In the low state, the emission lines are absent in all orbital phases indicating that accretion has completely switched-off and that XSS J12270−4859 has transited from an accretion-powered to a rotation-powered phase.
1 INTRODUCTION
Since the discovery of the first radio millisecond pulsar (MSP) (Backer et al. 1982), low-mass X-ray binaries (LMXBs) containing neutron stars (NS) were believed to be possible progenitors of radio MSPs through the so-called ‘recycling’ scenario (Alpar et al. 1982), in which radio pulsars are spun-up to very short periods during a previous prolonged (Gyr) phase of mass accretion. During the mass transfer phase, a large amount of angular momentum is transferred to the NS which is spun-up by accretion torques. The system appears as a bright accretion-powered LMXB. When mass transfer ceases, the emission is powered by the fast-rotating NS magnetic field and appears as a radio MSP. Supporting evidence were found from the detection of msec X-ray pulses in accreting NS (see for a review Patruno & Watts 2012). However, confirmations of the link between LMXBs and MSPs came only recently. The radio MSP PSR J1023+0038 was found to have experienced a previous accretion epoch in 2001 (Archibald et al. 2009; Wang et al. 2009; Archibald et al. 2010; Tam et al. 2010) and it is back again in an accretion powered phase since mid-2013 (Stappers et al. 2014; Patruno et al. 2014; Takata et al. 2014). Also the MSP, PSR J1824−2421, in the globular cluster M28, was surprisingly discovered as an X-ray source during a thermonuclear outburst in early 2013 and, after fading in the X-rays, it was again detected as a radio pulsar (Papitto et al. 2013). These discoveries provide the long-sought ‘missing-link’ and demonstrate that radio MSPs may have episodes of mass accretion, supporting the proposals that the transitions between the two states reflect the interplay between the NS magnetosphere and the mass transfer rate from the donor star (see Stella et al. 1994; Campana et al. 1998; Burderi et al. 2001). They furthermore challenge the existence of transitional MSP binaries to be identified yet. Radio MSP systems have greatly increased in number with many associated with Fermi sources (Ransom et al. 2011; Kaplan et al. 2012; Kerr et al. 2012; Kong et al. 2012; Roberts 2013) among which PSR J1023+0038 (Tam et al. 2010).
The hard X-ray source XSS J12270−4859 (henceforth XSS J1227) was early proposed as a cataclysmic variable hosting a magnetic white dwarf (Masetti et al. 2006; Butters et al. 2008) and later disproved with independent observations by Pretorius (2009), Saitou et al. (2009), and de Martino et al. (2010, hereafter dM10). It was identified as a peculiar low-luminosity (|$L_{\rm X} \sim 6\times 10^{33}\,d_{\rm 1\,kpc}^2 \,\mathrm{erg\,s}^{-1}$|) LMXB with unusual dipping and flaring behaviour (dM10). Surprisingly we also found XSS J1227 to be positionally coincident with the high-energy gamma-ray Fermi-LAT source 1FGL J1227.9−4852/2FGL J1227.7−4853 emitting up to 10 GeV (dM10). Multi-wavelength follow-up observations, performed by Hill et al. (2011), Saitou et al. (2011) and de Martino et al. (2013a, hereafter dM13), showed persistent X-ray and high-energy gamma-ray emissions over an interval of at least ∼7 yr, making it a unique case among known galactic binaries with comparable X-ray and gamma-ray luminosities. The detection of a radio (Hill et al. 2011) and gamma-ray (dM10) counterpart, together with a putative 4.5 h orbital period (dM10), led to the suggestion that XSS J1227 could host a MSP (Hill et al. 2011), sharing similar properties with PSR J1023+0038 (Wang et al. 2009; Archibald et al. 2010; Tam et al. 2010). However, no radio pulses were detected (Hill et al. 2011) and searches for msec X-ray pulses only provided upper limits to pulse amplitudes of ∼15–25 per cent (dM13). The nature of the compact object, an unusual black hole emitting in high-energy gamma-rays or a peculiar state of a MSP, remained an open question. The peculiar persistent optical, X-ray and high-energy gamma-ray emissions were recently discussed by Papitto, Torres & Jian (2014) in terms of a fast-spinning NS in a propeller state. The propeller effect operates when the magnetospheric radius is larger than the corotation radius thus inhibiting accretion of matter. The model predicts that, at low accretion rates, the accretion flow is truncated at large distances by the magnetic field of a rapidly rotating NS, where electron acceleration occurs producing energetic gamma-rays. This model also allows a small fraction of the inflowing matter to be accreted on to the NS.
XSS J1227 remained stable in gamma-rays, X-rays and optical for about a decade until the end of 2012, when it decreased by ∼1.5–2 mag in the optical and by more than a factor of 10 in the X-ray flux (Bassa et al. 2013, 2014). Hints of a decrease in the Fermi-LAT gamma-ray flux, coincident with the optical decay, were also found by Tam, Kong & Li (2013). This behaviour prompted the suggestion that XSS J1227 could be transiting from a LMXB to a MSP-powered phase (Bassa et al. 2013) reminiscent of the state transitions seen in the binary MSPs PSR J1824−2421 and PSR J1023+0038 itself. The unexpected variability triggered further follow-ups, along with radio searches, at 607 MHz with GMRT early 2014, finally detecting a highly accelerated 1.69 ms pulsar (Roy, Bhattacharyya & Ray 2014).
XSS J1227 has still to be characterized in terms of system parameters and energetics to understand its peculiar properties. The early claim of a 4.5 h photometric periodicity (dM10) was subsequently discarded by U-band XMM–Newton/OM observations giving a longer period (6.4(2) h) (dM13). A 6.91 h periodicity was found from a preliminary analysis of part of the spectroscopic data presented in this work (de Martino et al. 2013b,c) and further confirmed by Swift/UVOT U-band data (Bassa et al. 2014).
We present here the results of optical spectroscopic and optical/near-IR (nIR) photometric campaigns carried out in early 2012 during the long persistent high state and in late 2013 during the faint state into which the source entered since the end of 2012.
In Section 2 we describe the spectroscopic and photometric observations and data reductions. In Section 3 we present the spectroscopic analysis from which we detect both donor and compact star orbital motions and derive the first spectroscopic orbital period and ephemeris. In Section 4, we present the peculiar photometric variability and link it to a complex spectral behaviour during the high state as well as the orbital variability during the dim state. In Section 5 we discuss the results, obtaining estimates of the binary parameters, the distance and the effects of irradiation on the secondary star. We finally discuss the accretion flow and peculiar variability in terms of a propeller state.
2 OBSERVATIONS AND DATA REDUCTION
2.1 The spectroscopic data
We observed XSS J1227 from 2012 Mar. 30 to Apr. 1, with the 4-m NTT telescope at the ESO La Silla Observatory equipped with the EFOSC2 spectrograph using grism 19 (1557 l/mm) that covers the spectral range 4445–5110 Å with spectral resolving power R ∼ 2200–3000. A total of 73 spectra with exposure time of 1200 s were obtained. During each night we took arc-lamp exposures every ∼1–1.5 h to compensate for possible shifts due to instrumental flexure. Spectrophotometric standard stars were also observed at the beginning (LTT 3864 and GD 108) or at the end (EG 274) of each night.
Extended spectroscopic coverage was secured from 2012 Mar. 28 to Apr. 2 at the 10 m Southern African Large Telescope (SALT) (Buckley, Swart & Meiring 2006) equipped with the Robert Stobie Spectrograph (RSS)(Burgh et al. 2003) and grating PG2300 (2300 l/mm) covering the range 4000–5000 Å with R∼2200–5000. A total of 65 spectra were obtained with integration time of 300 s.
Further spectra were acquired from 2013 Dec. 14 to Dec. 18 at the ESO/NTT with the same instrument set-up. A total of seven spectra with exposure times between 900 s and 1200 s were obtained. When two spectra within the same night were acquired, they are separated by more than 2 h in order to sample different orbital phases. The log of the spectroscopic observations is reported in Table 1.
Summary of the spectroscopic observations.
| Telescope/instrument | ut date | ut start | Instrument setup | Exptime | No. of exposures | |||
|---|---|---|---|---|---|---|---|---|
| Grism | slit | CCD binning | Dispersion | (s) | ||||
| (arcsec) | (Å pixel−1) | |||||||
| ESO NTT/EFOSC2 | 2012-03-30 | 00:04 | #19 | 0.7 | 2 × 1a | 0.33 | 1200 | 21 |
| 2012-03-30 | 08:17 | #19 | 1.0 | 2 × 2 | 0.67 | 1200 | 4 | |
| 2012-03-31 | 00:37 | #19 | 1.0 | 2 × 2 | 0.67 | 1200 | 23 | |
| 2012-04-01 | 00:04 | #19 | 1.0 | 2 × 2 | 0.67 | 1200 | 25 | |
| 2013-12-14 | 07:21 | #19 | 1.0 | 2 × 2 | 0.67 | 900 | 2 | |
| 2013-12-15 | 07:35 | #19 | 1.0 | 2 × 2 | 0.67 | 900 | 1 | |
| 2013-12-17 | 07:12 | #19 | 1.0 | 2 × 2 | 0.67 | 1200 | 2 | |
| 2013-12-18 | 06:12 | #19 | 1.0 | 2 × 2 | 0.67 | 1200 | 2 | |
| SAAO SALT/RSS | 2012-03-28 | 19:12 | PG2300 | 1.5 | 2 × 2 | 0.35 | 300 | 13 |
| 2012-04-01 | 01:04 | PG2300 | 2.0 | 4 × 8 | 0.68 | 300 | 11 | |
| 2012-04-01 | 18:52 | PG2300 | 2.0 | 4 × 8 | 0.68 | 300 | 14 | |
| 2012-04-02 | 00:56 | PG2300 | 2.0 | 4 × 8 | 0.68 | 300 | 13 | |
| 2012-04-02 | 18:51 | PG2300 | 2.0 | 4 × 8 | 0.68 | 300 | 14 | |
Note:aThe binning is in the spatial direction.
The NTT data reduction was performed following standard iraf procedures, using bias and flat-field frames. Wavelength calibration of the 2012 data set was performed using the arc exposures so that every three NTT spectra had its own wavelength calibration providing a spectral resolution (FWHM) of 1.55 Å (96 km s−1) and 4.3 Å (265 km s−1) for the 0.7 and 1.0 arcsec set-ups, respectively. On the other hand, only one arc-line spectrum was acquired on 2013 Dec. 14 giving a spectral resolution of 4.4 Å (270 km s−1). Flux calibration for all NTT spectra was performed using the sensitivity function created by combining all the standard stars and correcting for grey losses when necessary.
The SALT spectra were processed with the PySALT pipeline (Crawford et al. 2010) to perform gain and cross-talk corrections, overscan bias subtraction and mosaicking. Standard iraf procedures were employed to perform flat-field correction, wavelength calibration and background subtraction. The wavelength calibration was based on arc exposures acquired at the beginning and end of each SALT observing slot providing a resolution of ∼2.7 Å (165 km s−1). We further applied a shift1 of 33.9 km s−1 to match those obtained with NTT. No spectrophotometric standard star was observed during the SALT run and therefore the spectra were not flux calibrated.
Heliocentric time and velocity corrections were applied to both sets of data.
2.2 The photometric data
XSS J1227 was observed from Mar. 28 to Apr. 1 with the 1.9m telescope at the South African Astronomical Observatory (SAAO) equipped with the Southerland High-speed Optical Camera (SHOC) (Coppejans et al. 2013) during the commissioning phase, using the U-band filter and adopting a 5 s integration time. The U filter was chosen for comparison with the 2009 and 2011 light curves obtained with the XMM–Newton Optical Monitor (dM10; dM13). The photometric coverage is ∼4.4 h, 7.7 h and 7.4 h during the three nights, respectively.
Simultaneous nIR photometry in J (1.25μ), H (1.63μ) and Ks (2.14μ) bands was also acquired from Mar. 28 to Apr. 3 at the SAAO 1.4-m InfraRed Survey Facility (IRSF) telescope equipped with the Simultaneous three-colour InfraRed Imager for Unbiased Survey (SIRIUS) (Nagayama et al. 2003). 15 s exposures with a dithering at 10 positions were performed giving a temporal resolution of 256 s including deadtimes. During the five nights the source was observed for 7.0 h, 9.8 h, 8.1 h, 10.7 and 9.6 h, respectively. The optical and nIR photometry partially overlaps the NTT and SALT spectroscopic observations.
XSS J1227 was re-observed from 2013 Dec. 13 to Dec. 15 with the 0.5m REM telescope equipped with the ROSS camera simultaneously in g′ and r′ bands, using integration times of 120 s. Total coverages of 1.9 h, 0.7 h and 0.8 h were obtained during the three nights. It was also simultaneously observed with the REMIR camera in the J filter but its faintness precluded useful analysis. The log of the photometric observations is reported in Table 2.
Summary of the photometric observations.
| Telescope/instrument | ut date | ut start | Filter | Exptime | No. of exposures |
|---|---|---|---|---|---|
| (s) | |||||
| SAAO 1.9m/SHOC | 2012-03-28 | 21:49 | U | 5 | 3159 |
| 2012-03-31 | 19:05 | U | 5 | 5573 | |
| 2012-04-01 | 18:39 | U | 5 | 5320 | |
| SAAO IRSF/SIRIUS | 2012-03-28 | 20:09 | J,H,K | 150a | 99 |
| 2012-03-31 | 18:09 | J,H,K | 150 | 138 | |
| 2012-04-01 | 19:46 | J,H,K | 150 | 124 | |
| 2012-04-02 | 17:27 | J,H,K | 150 | 156 | |
| 2012-04-03 | 17:39 | J,H,K | 150 | 150 | |
| ESO REM/ROSS | 2013-12-13 | 07:04 | g′,r′ | 120 | 24 |
| 2013-12-14 | 07:03 | g′,r′ | 120 | 12 | |
| 2013-12-15 | 06:11 | g′,r′ | 120 | 14 |
Note:a15-s exposures in dithering mode at 10 positions.
All photometric data sets were reduced using standard routines of iraf to perform bias and flat-field corrections. For the IRSF/SIRIUS photometry fringe patterns by OH were eliminated and 10 dithered images were merged into a single frame. For each data set, aperture photometry was performed optimizing aperture radius, and sky subtraction was done using annuli of different sizes. Comparison stars were used to check and to correct for variable sky conditions. No photometric calibration was applied to the 1.9-m/SHOC data and therefore we present differential photometry. The IRSF/SIRIUS JHK magnitudes were reconstructed using the comparison 2MASS star at: RA2000 = 12:28:01.885, DEC2000 = −48:52:09.77, with J = 13.076 ± 0.033, H = 12.710 ± 0.037 and Ks = 12.670 ± 0.031. The REM/ROSS photometry was calibrated using the Sloan standard SA 92 345 observed during the three nights. Heliocentric corrections were applied to all time series.
3 RESULTS FROM SPECTROSCOPY
The spectra obtained in 2012 show XSS J1227 at an average flux level similar to that observed in 2006 by Masetti et al. (2006), with prominent Hβ, He i (λλ 4471, 4919, 5015), He ii (λλ 4686) and bowen-blend N iii (λλ 4634–41)/C iii (λλ 4647–50) (Fig. 1, top). A strong variability is found in the continuum and emission lines. Dramatic changes from an emission-dominated spectrum to a pure absorption one on time-scales of hours were recorded in both NTT and SALT spectra. These spectacular changes are also accompanied by strong flux variations (Fig. 1, middle). Several absorption features of metallic lines are detected in the individual exposures even when emission are present. These are undoubtedly ascribed to the donor star. The relative strength of metallic lines suggests the companion is approximately an F-type star. Wavelength shifts in emission and absorption lines are signature of orbital variability.
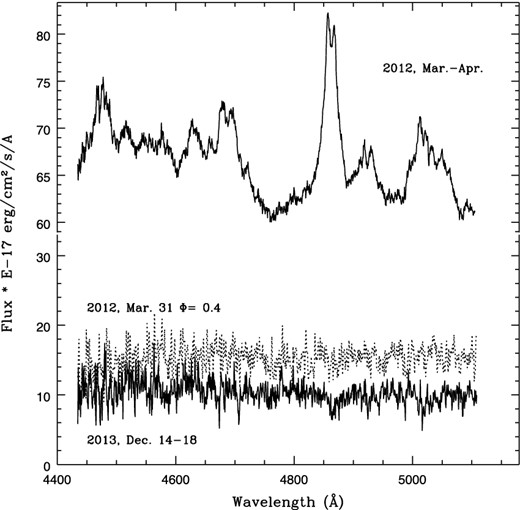
The grand average spectra of XSS J1227 obtained at ESO/NTT in 2012 (top) and in 2013 (bottom) showing the dramatic changes between the two epochs. Such spectacular changes are also observed in 2012 on time-scales of hours as elucidated by the spectrum (dotted line) acquired at orbital phase ∼0.4 (see text).
In comparison, the spectra obtained in 2013 do not show any emission feature (Fig. 1, bottom) but rather weak absorptions overimposed on a faint continuum, a factor of ∼7 lower than that observed in 2012 and 2006. The average flux is ∼1.1 × 10⁻¹⁶ erg cm−2 s−1 Å−1 comparable to only one spectrum acquired on 2012, Mar. 31 when emission lines were also absent (middle panel). The source appears to have undergone into a deep low state with no sign of accretion.
3.1 The orbital variability
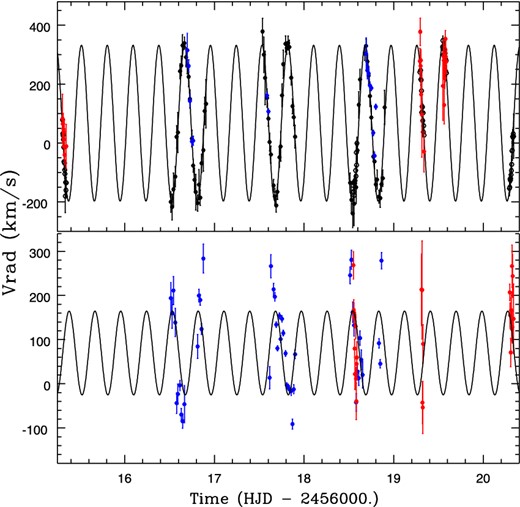
We cross-correlated the individual NTT and SALT spectra acquired in 2012 with the F2 V template HR 20852 in the spectral ranges λλ4500–4615, 4725–4820, 4940–4990 and 5065–5010, free from strong emission lines. The template was broadened to 125 km s−1 to match the width of the absorption features in XSS J1227 (see below). The radial velocities were obtained by parabolic fit to the peaks of the cross-correlation functions. The systematic offset between the SALT and NTT velocities was corrected by shifting the SALT spectra by +33.9 km s−1. A power spectrum analysis of the radial velocities reveals a clear peak at a frequency of 3.47 cycles d−1, corresponding to 0.288 d (Fig. 2, top panel). A sine wave fit to the radial velocities yields Porb = 0.287 75(17)d, the time of blue-to-red zero crossing To = 2456 015.1574(20) (inferior conjunction of the companion star), the amplitude of the donor star K2 = 261(5) km s−1 and the systemic velocity γ = 67(2) km s−1, where errors are purely statistical. We have rescaled the error bars of the NTT and SALT measures by factors of 2.5 and 2.7, respectively, in order to obtain a reduced χ2 = 1. Three outliers were masked from the fit, although they have a negligible impact in the final parameters.
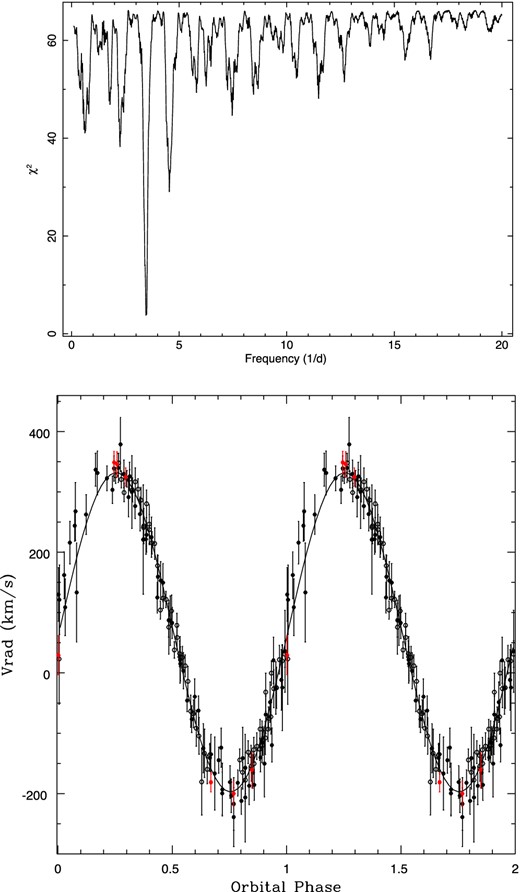
Top: the periodogram of radial velocities obtained by cross-correlating the NTT and SALT spectra acquired in 2012 with an F2 V template broadened by 125 km s−1. Bottom: the radial velocities folded at the refined orbital period using the ephemeris quoted in the text together with the best-fitting sinusoid. Measures from NTT are marked with filled circles (black from 2012 run and red from 2013 run), from SALT with open circles.
We also extracted radial velocities from the 2013 NTT spectra using the same template. These velocities are clearly modulated with the 0.288 d orbital period. An offset of −87 km s−1 is detected, most likely caused by flexure differences between the target observations and the calibration arc obtained during daytime with the telescope pointing to the zenith. Therefore, the 2013 NTT velocities were corrected by adding 87 km s−1. A sine wave fit to these velocities, fixing Porb = 0.287 75 d, yields a more contemporary determination of the zero phase, To = 2456 640.736(5). The uncertainty in Porb prevents us from constraining the exact number of orbital cycles elapsed between the two zero phases and, therefore, improve the orbital period. A periodogram of the entire data base of radial velocities is dominated by a strong aliasing pattern with several peaks around 3.475 cycles d−1 equally significant. However, only one peak (at 3.472 cycles d−1) is consistent with the photometric period reported by Bassa et al. (2014). Assuming the photometric period is the orbital period and not the superhump (e.g. (Haswell et al. 2001), a sine wave fit to the radial velocities, using Bassa et al's period as input parameter, allows us to refine the period to Porb = 0.288 0195(22) d. Our best set of orbital parameters is reported in Table 3, while the radial velocity curve, folded on this period, is presented in the bottom panel of Fig. 2.
Spectroscopic orbital parameters of XSS J1227.
| Porb | 0.288 0195(22) d |
| K2 | 261(5) km s−1 |
| K1 | 89(23) km s −1 |
| γ | 67(2) km s−1 |
| |$T_o^{a}$| | 2456 015.1574(20) |
| |$T_o^b$| | 2456 640.736(5) |
| Porb | 0.288 0195(22) d |
| K2 | 261(5) km s−1 |
| K1 | 89(23) km s −1 |
| γ | 67(2) km s−1 |
| |$T_o^{a}$| | 2456 015.1574(20) |
| |$T_o^b$| | 2456 640.736(5) |
Note:aTime of blue-to-red zero crossing of 2012 data set.
bTime of blue-to-red zero crossing of 2013 data set.
Variations in the depth of several metallic lines with orbital phase were also detected, indicating irradiation effects. To test this, we produced Doppler-corrected averages in the reference frame of the companion star (using the ephemeris in Table 3) grouping spectra at phases 0.9–1.1 and 0.4–0.6. These were compared with a set of A0-F7 templates of luminosity class IV–V from Casares et al. (1998), conveniently broadened to match the XSS J1227 spectra. These were complemented with another set of high-resolution main-sequence templates with spectral types G0-K7 (see details in Casares, Martinez-Pais & Rodriguez-Gil 2009). The spectral type classification of the XSS J1227 spectra was obtained through an optimal subtraction routine (see e.g. Casares et al. 2009) and the results are presented in the top and middle panels of Fig. 3. At orbital phase 0, the minimum χ2 is found at spectral type G5 whereas it is shifted to F5 at phase 0.5. The Doppler-corrected averages at the two phases are shown in Fig. 4 together with their respective best-fitting templates and the residuals after template subtraction. Here we note that the spectrum at phase 0.5, averaged over the three nights shows emission lines due to the night-to-night variability (see below and Section 3.2). The orbital dependence of spectral type is a clear indication that the secondary star is affected by irradiation at superior conjunction. This may cause some quenching on the photospheric absorption lines (Martin et al. 1989) which could lead to an overestimate of the K2 amplitude (see Section 5.1). We also attempted to constrain the spectral type of the companion star from the 2013 NTT spectra. Here, because of the scarce number of spectra and their lower signal-to-noise ratio, we produced a single Doppler corrected average combining the six spectra from all phases. The best match is obtained for the G6 V template, although spectral types between G0 and K1 are equally significant (Fig. 3, lower panel). The data confirm that the donor is a mid-G star, which is heated up to spectral type ∼ F5.
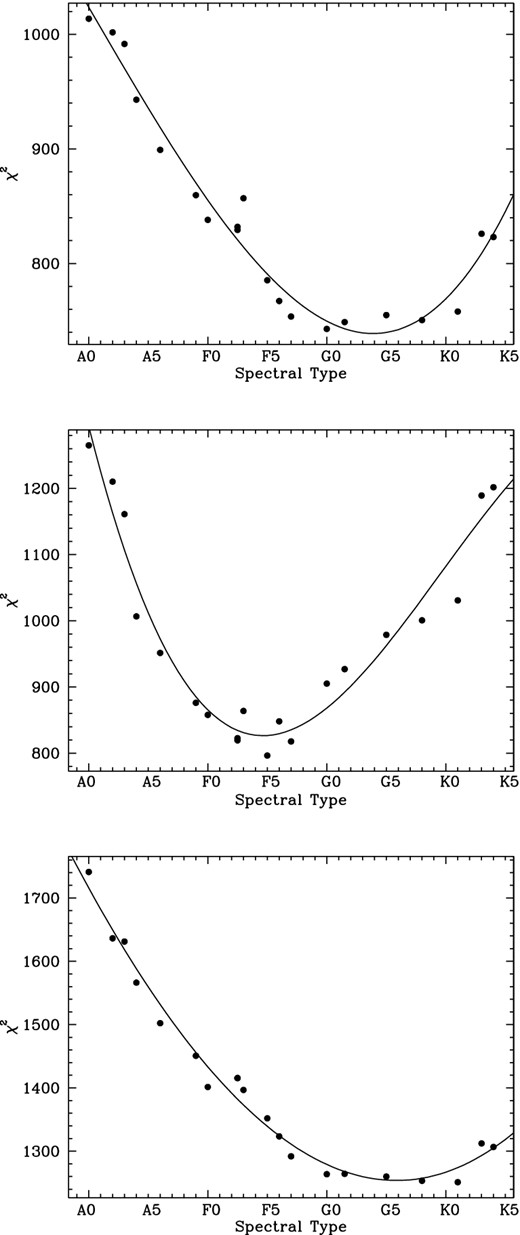
The χ2 distribution from cross-correlation of average spectra obtained in 2012 around orbital phases 0.0 (top) and 0.5 (middle) and in 2013 (bottom). Abscissas indicate spectral types A0 (0), F0 (10), G0 (20) and K0 (30). The spectra in 2012 show earlier spectral type at the secondary superior conjunction. A mid-G-type star is favoured from 2013 data.
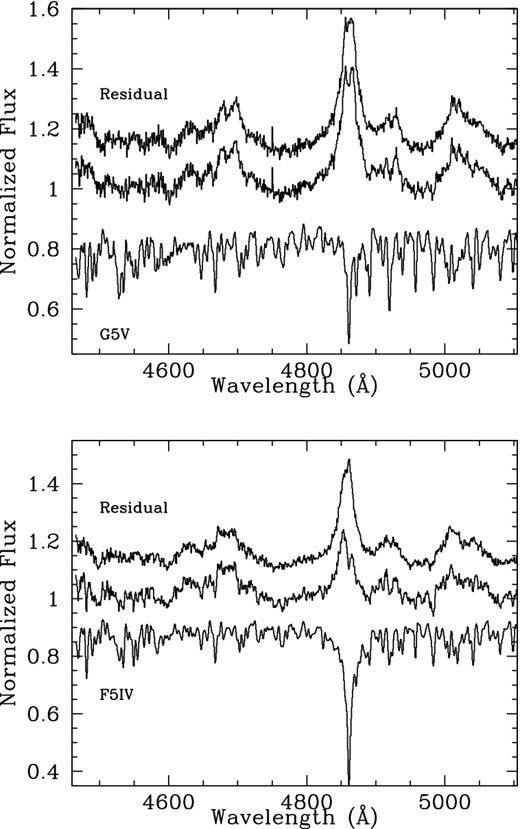
The Doppler-corrected average NTT spectra around orbital phase 0.0 (top) and 0.5 (bottom) together with the corresponding best-fitting templates, G5 V and F5 V, respectively. The residual spectra after template subtraction are also shown (shifted vertically for clearness).
To estimate the companion star rotational broadening we used a subset of 21 NTT spectra from the first night in 2012, that have better spectral resolution. These were co-added in the rest frame of the companion star and the resulting spectrum was compared with an F7 IV and a G0 V template, both degraded to the resolution of the NTT spectra (96 km s−1) and subsequently broadened from 50 to 100 km s−1 in steps of 1 km s−1 (see e.g. Casares et al. (2010)). The best match is obtained when the F7 IV is broadened by 98 ± 8 km s−1 and the G0 V template to 82 ± 16 km s−1 gives equally good fits. Therefore, we conservatively adopt V sin i = 86 ± 20 km s−1, although this number should be treated with caution because it is comparable to our instrumental resolution.
To study the emission line behaviour observed in 2012 we restricted the analysis of radial velocities to the Hβ line that is the strongest line in the spectrum. The profiles were normalized to their local continuum and then fitted with a broad (FWHMem ∼ 30 Å = 1850 km −1) Gaussian in emission. When in absorption, Hβ profiles were fitted with a narrow Gaussian (FWHMabs ∼ 3 Å = 185 km −1). The latter is consistent with the derived rotational broadening. A period search was performed on the radial velocity measures of Hβ emissions from both NTT and SALT data sets, giving a period of 0.38(1) d, the 1-d alias of that obtained from cross-correlation of absorption lines. This is likely due to the significant night-to-night variability of radial velocities of the emission line with shifts up to 300 km s−1 (see Fig. 5). We therefore fixed the period at the refined orbital value and fit the radial velocities of Hβ emissions and absorptions obtaining Kabs = 264(3) km s−1, γabs = 67(2) km s−1 and Kem = 89(23) km s−1, γem = 63(10) km s−1. The γ velocities of absorptions and emissions well agree within their uncertainties. Also, the Hβ absorption radial velocity amplitude matches that derived from cross-correlation. The radial velocity curves versus time, together with their corresponding sine wave fits, are shown in Fig. 5. This figure elucidates the two-fold behaviour of Hβ line: the tendency of the emissions to disappear around orbital phases ∼0.35–0.65 with a strong night-to-night variability, which reveals the donor photospheric absorptions, and the anti-phased modulation of emissions and absorptions, which then trace the primary and donor star orbital motions, respectively.
Top: the radial velocities as obtained from cross-correlation of metallic lines with an F2 V template (NTT: black filled and SALT open black circles) and from Gaussian fits to the Hβ absorptions as measured on the NTT (blue circles) and SALT spectra (red circles). The sinusoidal fit using the orbital solution quoted in the text is also shown. Bottom: the radial velocity measures as obtained from Gaussian fits to the Hβ emission line on the NTT (blue circles) and SALT (red circles) together with a sinusoidal fit. Note the night-to-night variability of emission lines. The radial velocities of emissions and absorptions are anti-phased.
We further inspected the variability in both continuum and Hβ emission fluxes in the NTT spectra, measuring the line-integrated and the local continuum fluxes. Both are variable, being Hβ flux strongly dependent on the orbital period. Equivalent widths (EWs) vary by ∼90 per cent and are maxima at inferior conjunction of the donor star.
3.2 Trailed and Doppler maps
Trailed spectrograms were constructed to investigate in more detail the orbital line variability. We used the NTT set which has a more homogeneous coverage and averaging the spectra in 20-phase bins. In Fig. 6 (left panel) the trailed spectra in the region encompassing He ii and Hβ are displayed with different colour scales to enhance either the metallic absorption lines or the peak of the emission lines. The absorptions are clearly visible throughout the orbital cycle, while emission lines fade in the phase range ∼0.35–0.65. This fading is observed in the spectra during the three nights where also a night-to-night variability in the emissivity is detected. In Fig. 6 (right panel) the Hβ trailed profiles (top) reveal a double-peaked structure, a signature of an accretion disc. It is worth noticing that the red side of Hβ profile tends to disappear first (left panel of Fig. 6), likely due to the increasing contribution of photospheric absorptions of the donor star.
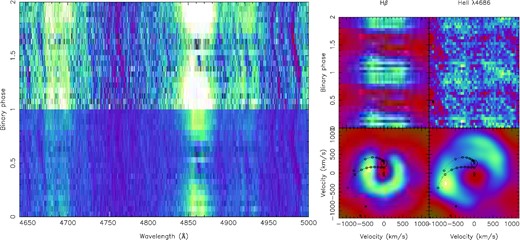
Left: the NTT trailed spectra averaged in 20 orbital phase bins revealing the orbital evolution of several absorption features and emission lines. Two colour scales have been used to enhance the absorptions and emission line structure. Right: enlargements of the regions at Hβ and He ii showing the double-peaked shape (top). Doppler maps in velocity coordinates are shown together with the theoretical Keplerian trajectory along the gas stream and the stream trajectory. The secondary Roche lobe is also indicated for q = 0.25.
Doppler maps of Hβ and He ii, the two strongest lines in our wavelength range, were produced from the 73 NTT spectra following Marsh & Horne (1988). These spectra were continuum subtracted and rebinned into a velocity scale of 42 km s−1 per pixel. The maps are displayed in the right and lower panels of Fig. 6. They also display the Roche lobe of the donor star, together with the ballistic trajectory of the gas stream and the Keplerian velocity of the disc, in steps of 0.1RL1 for q = M2/M1 = 0.25. The presence of an accretion disc is further confirmed by the maps. The lack of emission at particular azimuths is likely due to the visibility of the strong photospheric Hβ absorption from the donor. Difference between the two maps is found. The He ii displays emission at larger velocities than Hβ, indicating that this line is formed closer to the compact star. The Hβ map shows a bright spot consistent with emission from the impact region of the gas stream with the outer rim of the disc at ∼0.55RL1. The latter sets constraints on the outer disc radius. Instead, the He ii map shows a bright spot along the gas stream trajectory but further in, at ∼0.15RL1. A possible explanation for the He ii bright spot is that it is formed by overflowing material that reimpacts on to the inner disc regions closer to the primary star. The remarkable tendency of emission lines to fade around superior conjunction of the secondary is difficult to explain. In Section 4.1 we will present further details on this behaviour.
4 RESULTS FROM PHOTOMETRY
4.1 The variability during the persistent state
The simultaneous optical U band and nIR photometry acquired in 2012 confirms the peculiar behaviour detected by Pretorius (2009), dM10, Saitou et al. (2011) and dM13, with dips, flares and flickering occurring in all the filters (Fig. 7). A large amplitude (up to ∼1 mag) variability is observed without an apparent orbital dependence. From Fig. 7 the source appears always brighter around orbital phases 0.4–0.5. Also, though not recurrent, flares tend to occur in this phase range. Similar behaviour is observed in subsequent white light photometry (Kotze, private communication). The light curve of Mar. 31 (middle left panel of Fig. 7) does not show flares for more than one cycle but flickering overimposed on a roughly sinusoidal modulation. A formal fit at the fixed orbital period (see Fig. 7) gives a time of maximum To = 2456 018.47(2) and a full amplitude ΔU = 0.32(4).
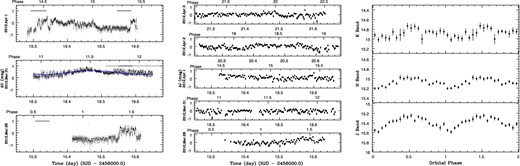
Left: the U-band photometry acquired at the 1.9-m SAAO telescope during 2012 Mar.–Apr. showing flares and dips. The spectroscopic coverages with SALT and NTT are also reported as black thick and dotted lines, respectively. Orbital phases are reported in the upper abscissas. A sine wavefunction (blue line) at the orbital period is also superimposed on the U-band photometry of Mar. 31. Middle: the simultaneous J-band photometry acquired at the IRSF SAAO telescope showing similar behaviour. Right: the nIR light curves folded at the orbital period after removing flares.
While the amplitude of the modulation is similar to those observed in other LMXBs, the light curve is not double-humped as it would be expected from ellipsoidal variations of the secondary star (Shahbaz et al. 2003). Single humped light curves with a minimum at inferior conjunction of the secondary star instead indicate that the donor irradiation is an important source of variability as also observed during low states in the MSP binaries SAX J1808.42−3658 (Homer et al. 2001), PSR J102347+0038 (Thorstensen & Armstrong 2005) or PSR J2215+5135 (Breton et al. 2013; Schroeder & Halpern 2014).
We compare the portion of the light curve acquired on Mar. 31 with the simultaneous SALT and NTT spectra that cover cycles 11.7–12.14 (Fig. 7, middle left panel). Here an intense flickering is observed and the spectra show strong emission lines, though with different shapes. These are signatures of a contribution from the accretion disc, which is not expected to produce substantial orbital variability (Bayless et al. 2011).
On the other hand, during flares (as those observed on Apr. 1) (Fig. 7, upper left panel) the line profiles are complex with absorption and emission components with variable shapes. The pre-flares and dips are characterized only by absorptions. Here we recall that the pre-flare dips as well as the erratic dips seen in X-rays are due to occultation rather than absorption (dM10; dM13). This peculiar variability cannot be easily reconciled with only stationary orbitally locked emitting regions. An extra source of light is needed to account by for the flares. An opaque and localized material that crosses the line of sight at the primary inferior conjunction is also needed to explain the overimposed dips.
The nIR IRSF photometry gives the source at: J = 15.39(8), H = 15.08(8) and Ks = 14.9(2) consistent with the measures in 2009 reported by dM10 and by Saitou et al. (2011). The light curves, though with lower temporal resolution, display the same variability seen in the U band (Fig. 7, middle panels). Removing the few flares, J − H and H − Ks colours indicate bluer spectrum when it brightens. The H, J, Ks phase-folded light curves (Fig. 7, right panels) reveal a quasi-sinusoidal modulation with a maximum centred at orbital phase 0.5 and full amplitudes ΔJ ∼ 0.4 mag and ΔH ∼ 0.2 mag (the Ks photometry being too noisy). Correcting the average J and H magnitudes for interstellar reddening with E(B − V) = 0.11 (dM10), we obtain (J − H)|$\rm _o$| = 0.27(11), consistent with a late F–early G spectral type (Bilir et al. 2008; Straižys & Lazauskaitė 2009). At the minimum of the modulation we obtain (J − H)|$\rm _o$| = 0.33(7) corresponding to a G5-6 V spectral type. This suggests that the nIR light mainly arises from the donor star, as also indicated by the analysis of the SED (dM13), which is affected by irradiation.
4.2 The photometric variability during the low state
The REM/ROSS photometry acquired in 2013 gives the source at g′ = 18.82(5) and r′ = 18.19(5), hence ∼2 mag fainter than in 2009 and 2012. The simultaneity with the NTT spectra of Dec. 14 and 15 gives further support that XSS J1227 has faded to the lowest level ever observed. The light curves, though of poor quality, reveal a variability consistent with the orbital period (Fig. 8). A sinusoidal fit at the fixed period (Table 3) gives full amplitudes Δg′ = 0.74(3) and Δr′ = 0.70(4). The large amplitude variation is not easy to explain in terms of the sole contribution from the unheated donor star.
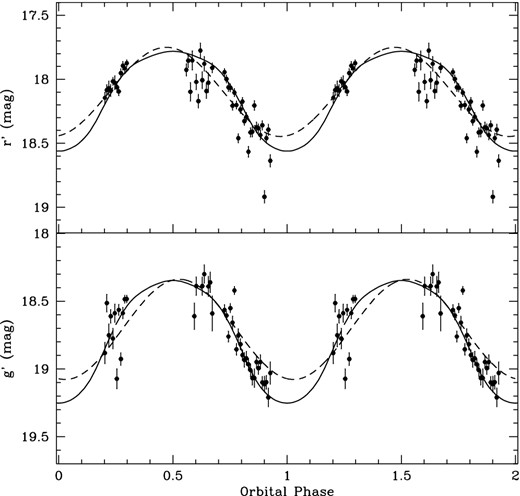
The g′ (bottom) and r′ (top) light curves in 2013 Dec. folded at the orbital period together with a sine wavefunction (dashed line) and with the simulated light curves obtained with Nightfall code for q = 0.3 and i = 69° (solid line) described in the text.
To check if the observed g′ and r′ light curves can be explained by an irradiated donor star we simulated both light curves at the refined orbital period using the Nightfall code.3 We adopt a blackbody temperature of 5500 K for the unheated donor star assumed to fill its Roche lobe and the maximum allowed temperature (500 000 K) for the irradiating star treated as a point source. Given the low quality and poor orbital coverage of our photometric data especially at the inferior and superior conjunctions of the donor star, we also include in the analysis the secondary star radial velocity curve acquired in 2012, which has a denser orbital coverage than that obtained in Dec. 2013. We left the mass ratio q to vary between 0.2 and 0.4 (see also Section 5.1) and obtain q = 0.29 and a binary inclination i = 69°(|$\chi ^2_{\rm red}$| = 8.9, d.o.f = 160). The companion star is found to be heated up to 6100 K. The two parameters result to be unconstrained: q ≲ 0.5 and i ≳ 43° at 3σ confidence level. Given the low fit quality, we do not attempt to further interpret the results of the fitting. The simulated light curves are also shown in Fig. 8.
5 DISCUSSION
Our optical spectroscopy and photometry during the persistent state that characterized XSS J1227 for about a decade have shown a peculiar variability of both emission lines and continuum that display dramatic quasi-erratic changes superimposed on a periodic modulation. From the detection of absorption lines from the donor star we have derived orbital period of 6.91246(5) h and the first spectroscopic ephemeris for this system. The dim state into which XSS J1227 entered since the end of 2012 is characterized by the absence of emission lines and the lowest optical flux ever observed, indicating that mass transfer has completely switched off and that the donor star dominates the optical light. In the following we discuss the implications of our study of radial velocities and of optical and nIR light curves.
5.1 The binary masses and distance
We also derived the secondary rotational broadening: V sin i = 86 ± 20 km s−1. Since V sin i scales with K2 and it is a function of the mass ratio q (Horne, Wade & Szkody 1986), we estimate q = 0.25 ± 0.12.
From the radial velocity variations of the wings of Hβ emission line we estimated an amplitude of the compact object orbital motion K1 = 89(23) km −1, although this should be regarded as an upper limit (see e.g. Marsh 1988). This yields a mass function f(M2) = 0.02 M⊙. Using the ratio of the radial velocity amplitudes K1 and K2 we obtain a mass ratio q = K1/K2 = M2/M1 = 0.34 ± 0.09, which is, within 1σ, consistent with that derived above. We then conservatively adopt a mass ratio q = 0.13–0.43, and the quoted values for f(M1) and f(M2) to infer the allowed ranges of the binary component masses. We also make use of the binary inclination limits i ≳ 43° (Section 4.2) and i ≲ 73° due to the absence of X-ray eclipses. In Fig. 9 (lower panel), for a canonical NS mass 1.4 M⊙, the binary inclination is limited to 50° ≲ i ≲ 65°. Allowing a wider range of NS masses M1 = 1.4–3 M⊙, which is a likely possibility because the fastest spinning NS tend to be massive (Roberts 2013), the binary inclination range is: 45° ≲ i ≲ 65°. Within these values the secondary mass is limited to M2 ≃ 0.06–0.12 M⊙, implying an extremely undermassive donor for its spectral type (Fig. 9, upper panel). We then adopt the latter ranges for the donor star mass and for the binary inclination.
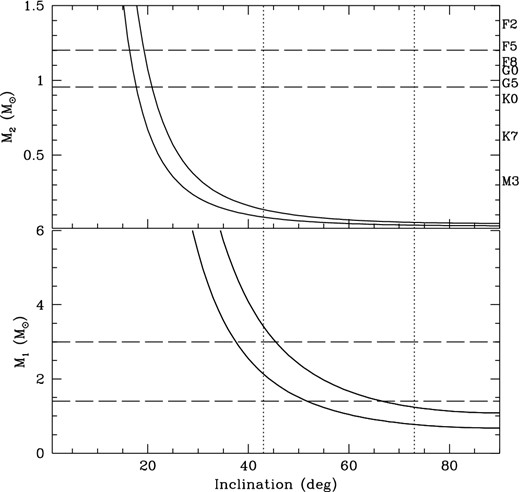
The primary (bottom) and secondary (top) masses versus the binary inclination angle i adopting a mass ratio q = 0.13–0.43 and mass functions f(M1) = 0.53 M⊙ (bottom) and f(M2) = 0.02 M⊙ (top). The binary inclination range 43° ≤ i ≤ 73° (see text) is shown as dotted vertical lines. The NS mass values M1 = 1.4 M⊙ and 3 M⊙ are shown as long dashed horizontal lines. The masses for donors between spectral type G6 V and F5 are also reported as horizontal long dashed lines.
Extremely low mass donors are indeed found in many MSP binaries with short (Porb ≪ 24 h) orbital periods, which are eroded by strong irradiation (Chen et al. 2013; Roberts 2013). They are broadly divided into the so-called black widows, harbouring strongly ablated and likely degenerate secondaries with M2 ≪ 0.1 M⊙ (typically 0.02–0.04 M⊙) and the so-called redbacks which have non-degenerate secondaries with masses M2 ≃ 0.1–0.4 M⊙ (Roberts 2013). The donor in XSS J1227 then appears to be a new member of the redback group that now would count with seven systems. Higher resolution spectroscopy and better photometric coverage are needed to constrain the mass ratio and orbital inclination.
Previous estimates of the distance to XSS J1227 (1.4–3.6 kpc) were based on high state nIR photometry (dM10; dM13). The optical magnitudes during the dim state, ascribed to the donor star, allow us to determine a new distance. The average and lowest observed g′ and r′ magnitudes corrected for extinction [E(B − V) = 0.11], when translated into the V band, give V = 18.11 and V = 18.45, respectively. The latter, if due to a G5 V star (MV = 5.1), would imply a distance of 3.4–4.7 kpc. However, a G5 main-sequence star has a larger radius than the donor in XSS J1227. Assuming the secondary fills its Roche lobe and using M2 = 0.06–0.12 M⊙ and the binary orbital period, we obtain R2 = 0.34–0.42 R⊙, which gives MV ∼ 6.9–7.2 mag and then a distance of 1.8–2.0 kpc.
5.2 Irradiation effects
We investigate the effect of irradiation due to the high-energy emission from the compact star. Irradiation increases the local effective temperature of the donor at the inner face. The effect of an anisotropic irradiation is such that the energy outflow through the surface layers of the companion is blocked over a fraction of its surface (Ritter, Zhang & Kolb 2000). Consequently, the heated face of the donor star emits a fraction of the incident flux: Firr = W Finc, where |$F_{\rm irr} = \sigma \,T_{\rm irr}^4$| is the flux of the irradiated surface of the donor, Finc is the component normal to the stellar surface of the incident flux and W is the reflection albedo, which, for stars in the temperature range 2000–10 000 K, is between 0.5 and 1.0 (Claret 2001) for atmospheres that are convective and in radiative equilibrium, respectively. Following Ritter et al. (2000), Finc = η (Lhigh, emiss./4 π a2) h(θ), with η an efficiency factor that is unity if the high-energy luminosity is radiated isotropically. XSS J12270 has been found in a prolonged persistent state until late 2012. We then adopt ηLhigh, emiss. = LX, γ ∼ 5 × 1034 erg s−1, using the bolometric X-ray/gamma-ray fluxes derived in dM10 and dM13 and d = 1.9 kpc (Section 5.1), a binary orbital separation a ∼ 2.2 R⊙, for q = 0.13–0.43 and i = 45°–65°, and h(θ) ≃ cos (θ) (see Ritter et al. 2000 for details). For a typical incidence angle θ = 45°, we derive Tirr ∼ 5800–6800 K, for albedos W in the range 0.5–1.0, respectively. Thus the heating of the secondary star inferred from the optical spectra is broadly consistent with irradiation by the high-energy X-rays and gamma-rays emitted during the persistent state. Furthermore, Papitto et al. (2014) modelled the X-ray and gamma-ray emissions in a propeller configuration with a total luminosity Lrad ∼ 1.5 × 1035 erg s−1. This would imply an efficiency η ∼ 0.3. On the other hand, the current low state into which XSS J1227 has entered is characterized by a decrease in the X-ray flux by a factor of ∼30 (Bassa et al. 2013, 2014; Bogdanov et al. 2014) also accompanied by a dimming of the gamma-ray Fermi/LAT flux (Tam et al. 2013). Notwithstanding this, the secondary star is not expected to cool substantially, because the thermal relaxation time-scale is of the order of the thermal time-scale of the convective envelope [τCE ≃ τKH ∝ (RL)−1] (Ritter 2000). Hence, while the optical light during the persistent state in 2012 could be heavily contaminated by the accretion disc, the modulation during the low state is dominated by the irradiated donor. In Section 4.2 we showed the Nightfall simulation for q = 0.29 and i = 69° and a heated secondary up to 6100 K that reproduces the observed large amplitude ΔM ∼ 0.7 orbital modulation in 2013 Dec. It also predicts amplitudes ΔM ∼ 0.3–0.4 in J, H and K bands consistent with the observed nIR modulation observed in 2012, suggesting that the donor dominates at these wavelengths even in the higher state.
Single humped orbital modulations are observed in many black widows (up to ∼2 mag) as well as in redbacks (∼0.2–0.8 mag) when in low states (Thorstensen & Armstrong 2005; Archibald et al. 2013; Breton et al. 2013; Schroeder & Halpern 2014). The orbital modulation is caused by a combination of irradiation, which produces a maximum at the superior conjunction of the companion, and ellipsoidal variations, which yield maxima at quadrature. Single peaked optical modulations are suggestive of negligible contribution of ellipsoidal variations and the amplitudes depend on the binary inclination. Examples are the redbacks PSR J2215+5135 and PSR J102347+0038, whose optical orbital modulations have amplitudes of ∼0.8 mag and ∼0.4 mag, respectively. These were modelled with mildly irradiated donors, filling their Roche lobe, and viewed at moderate inclination angles ∼48–60° (Schroeder & Halpern 2014) or ∼70° (Breton et al. 2013) and ∼40° (Thorstensen & Armstrong 2005), respectively. We conclude that XSS J1227 is a redback with a moderate irradiated donor.
5.3 A low-mass X-ray binary in a propeller state
Drawing analogy with PSR J102347+0038, Papitto et al. (2014) proposed XSS J1227 to be a LMXB in a propeller state where a rapidly spinning MSP inhibits most of the mass transferred from the donor star to accrete. In this configuration matter forms a shock at the magnetospheric boundary where the high-energy gamma-ray emission as well as most of the X-ray radiation takes place. The recent discovery of 1.69 ms radio pulsations (Roy et al. 2014) gives support to this hypothesis.
From our spectroscopic study during the persistent state there is evidence that an accretion disc is present. The Doppler map of Hβ emission reveals a spot located at ∼0.55 RL1, that for q = 0.25 translates into ∼6 × 1010 cm. This provides an estimate of the outer disc radius. On the other hand, the He ii emission spot is localized at ∼0.15 RL1 that translates into ∼1.6 × 1010 cm. A consistent value is obtained from Hβ emission line wings (FWZI/2 ∼ 1000 km s−1) assuming they trace the Keplerian velocity of the innermost disc regions contributing to this line (∼1.9 × 1010 cm). This value is also consistent with that of a hot emitting region (Thot ∼ 13000 K) inferred from the analysis of the SED (dM13).
For a pulsar rotating at a period of 1.69 ms the light cylinder radius at which the corotation velocity exceeds the speed of light is RLC = c P/2 π ∼ 80 km. At this radius the pulsar emission prevents the plasma from reaching the surface and a rotation-powered pulsar would turn on. If the magnetosphere is squeezed below RLC at distances of the order of the corotation radius Rco = (G MNS P2/4 π)1/3 ∼ 24 km the radio pulsar would turn off and accretion takes place. For XSS J1227 during the persistent higher state, Papitto et al. (2014) estimate an inner disc radius of ∼40 km at which the interface magnetic field strength is limited to 3–6 MG. At this radius the disc is dead and the propeller process takes place where the X-ray and gamma-ray emissions originate. Then the disc regions contributing to the optical emission lines and UV light (dM13) are clearly located further out. The tight correlation of X-ray and UV flares further implies that these regions are reprocessing sites of the X-ray emission.
Although the propeller model does not necessarily require material to be expelled by the system (it can fall back and rebuild the disc; Papitto et al. 2014), it is conceivable that matter is lifted off from the orbital plane. The tendency of flare/dip pairs to occur at superior conjunction of the donor star, the fading of emission lines in this phase range and the night-to-night variability of this behaviour could be related to the propellor state of the MSP, in which material is propelled within the Roche lobe of the primary and intercepts the line of sight. The remarkable flaring and dipping behaviour in XSS J1227 seem now to be also present in other MSPs. PSR J1023+0038, which recovered accretion around mid-2013, also displays an X-ray light curve with dips and a strong variability (Patruno et al. 2014).
XSS J1227 has entered in the faintest state ever observed since the end of 2012 characterized by the absence of accretion tracers in the spectra. The decay in the X-ray flux observed by Swift/XRT (Bassa et al. 2014) and XMM–Newton (Bogdanov et al. 2014) and the possible decrease in the Fermi/LAT count rate (Roy et al. 2014) further confirm accretion has switched off. XSS J1227 has therefore transited from a LMXB to a MSP phase, the opposite way of PSR J1023+0038 that has recently brightened in the X-rays, optical and in the high-energy gamma-rays (Stappers et al. 2014; Takata et al. 2014; Patruno et al. 2014).
In order to better constrain orbital parameters and energetics of XSS J1227 multi-wavelength follow-ups in the ongoing unprecedented faint state of this intriguing source are needed.
ESO/NTT observations were acquired under programmes 088.D-0311 and 092.D-0588. Some of the observations reported in this paper were acquired at the SALT under programme 2011-3-RSA OTH-025. The ESO REM observations were obtained under programme DDT-REM:28903. DdM wishes to thank the REM team to promptly schedule the observations. EM thanks ESO La Silla support astronomer and the hospitality at INAF − Astronomical Observatory of Capodimonte. JC thanks Dr. P. D'Avanzo for his help in acquiring the 2013 ESO/NTT spectra. We are grateful to Dr. Nagayama and Dr. D. Foster for their support in IRSF/SIRIUS observations and data reduction. JC acknowledges support by the Spanish MINECO grant AYA2010-18080. We acknowledge the use of the Nightfall program for the light-curve synthesis of eclipsing binaries written by Rainer Wichmann. We thank the anonymous referee for useful suggestions to improve the manuscript.
Based on observations made at ESO and SALT telescopes.
A systematic velocity offset of unknown origin between the NTT and SALT γ velocities was found. The shift, currently under investigation, is however smaller than the SALT/RSS resolution element.
The template spectrum was obtained with the ISIS spectrograph on the 4.2-m William Herschel Telescope (WHT) on the night of 2 Dec 1997 at 64 km s−1 resolution (Casares, Charles & Kuulkers 1998).
The Nightfall code is available at http://www.hs.uni-hamburg.de/DE/Ins/Per/Wichmann/Nightfall.html
The K2 amplitude could be affected by irradiation effects (see Wade & Horne (1988)) but, since quenching of absorption lines is not detected, we do not apply the so-called K-correction.
