


Abstract
We present 3–50 keV NuSTAR observations of the active galactic nuclei Mrk 335 in a very low flux state. The spectrum is dominated by very strong features at the energies of the iron line at 5–7 keV and Compton hump from 10–30 keV. The source is variable during the observation, with the variability concentrated at low energies, which suggesting either a relativistic reflection or a variable absorption scenario. In this work, we focus on the reflection interpretation, making use of new relativistic reflection models that self consistently calculate the reflection fraction, relativistic blurring and angle-dependent reflection spectrum for different coronal heights to model the spectra. We find that the spectra can be well fitted with relativistic reflection, and that the lowest flux state spectrum is described by reflection alone, suggesting the effects of extreme light-bending occurring within ∼2 gravitational radii (RG) of the event horizon. The reflection fraction decreases sharply with increasing flux, consistent with a point source moving up to above 10 RG as the source brightens. We constrain the spin parameter to greater than 0.9 at the 3σ confidence level. By adding a spin-dependent upper limit on the reflection fraction to our models, we demonstrate that this can be a powerful way of constraining the spin parameter, particularly in reflection dominated states. We also calculate a detailed emissivity profile for the iron line, and find that it closely matches theoretical predictions for a compact source within a few RG of the black hole.
1 INTRODUCTION
Several active galactic nuclei (AGN) exhibit large flux variations, in which the source spectrum usually becomes much harder in very low flux states. This behaviour can be caused by two different mechanisms: material passing across the line of sight to the AGN absorbing the light from the source (e.g. NGC 1365; Risaliti et al. 2013), or the source switching to a reflection-dominated state (e.g. 1H 0707-495; Fabian et al. 2012). Distinguishing between these two cases can be difficult, particularly when data are restricted to E ≲ 10 keV.
The Nuclear Spectroscopic Telescope Array (NuSTAR; Harrison et al. 2013) is the first focusing high energy (3–79 keV) X-ray telescope in orbit. Because of this, it is uniquely suited to studying reflection spectra in AGN and X-ray binaries (XRBs), as it can simultaneously observe the broad iron line from ∼3–7 keV and the Compton hump, prominent from ∼10–30 keV, (e.g. Miller et al. 2013; Risaliti et al. 2013; Tomsick et al. 2014; Marinucci et al. 2014a,b) with good enough spectral resolution to constrain the iron line profile and hence the spin and emissivity profile. This constraint on the shape of the high-energy spectrum can enable the effects of absorption and reflection to be disentangled. Recent work on NGC 1365 with NuSTAR (Walton et al. 2014) has demonstrated that when intervening cold absorption is taken into account the fluxes of the iron line and Compton hump are correlated. These features show no systematic correlation with the absorption in the source, and are found in all flux states, pointing to an origin unrelated to absorption.
Mrk 335 is a bright narrow-line Seyfert 1 (NLS1) galaxy at redshift z = 0.025 785, with log (MBH) = 7.15 ± 0.12 (Peterson et al. 2004) and evidence of ionized absorption in the X-ray and UV (Longinotti et al. 2013). Mrk 335 has been observed to go into extremely low-flux states (Grupe, Komossa & Gallo 2007) where the soft X-ray flux drops by a factor of up to ∼30, while the hard flux only drops by a factor of ∼2. Grupe et al. (2008), using XMM–Newton, found that the spectrum of Mrk 335 in its lowest state can be described equally well by either the effects of absorption or by a high-reflection fraction, with no clear way to distinguish between the two models. Gallo et al. (2013) analysed the spectrum of Mrk 335 in an intermediate flux state from 2009 (Grupe et al. 2012), and found that the complex variability can be well described using a blurred reflection model without invoking variable absorption. Extremely low-flux states have also been observed in several other AGN, such as NGC 4051 (Guainazzi et al. 1998; Uttley et al. 1999; Lobban et al. 2011), Fairall 9 (Lohfink et al. 2012), PG 2112+059 (Schartel et al. 2010), PG 0844+349 (Gallo et al. 2011), PHL 1092 (Miniutti et al. 2012) and Mrk 1048 (Parker et al., submitted).
X-ray reflection is observed when emission from a hot X-ray emitting corona is reflected off an optically thick accretion disc, producing both fluorescent lines and a backscattered continuum. These features can then be smeared by general relativistic effects close to the event horizon (Fabian et al. 1989; Laor 1991). This phenomenon is well documented in AGN and XRBs (e.g. Fabian 2013). Relativistic reflection spectra are characterized by a soft excess of blurred emission lines at low energies, a broad iron K line at ∼6.4 keV, and a Compton hump at high energies (≳10 keV, peaking around 20–30 keV). By investigating the properties of the relativistic blurring, we can investigate the geometry of the corona. The corona has been found to be compact using several different methods (e.g. time lags and microlensing; Zoghbi et al. 2010; Dai et al. 2010, respectively), and the height of the corona above the disc can be constrained by looking at the iron line profile. The closer the source of the coronal emission is to the disc, the more the reflected emission is dominated by the inner disc, and the more extreme the blurring (Dauser et al. 2013; Wilkins & Fabian 2012; Fabian et al. 2014). A characteristic of relativistic reflection from a compact corona close to the event horizon is that changes in the position of the coronal X-ray source can result in large changes in the continuum flux, with only a small difference in the reflected spectrum. This is a consequence of light bending, used by Miniutti et al. (2003) to explain the lack of variability in the reflection spectrum of MCG–06-30-15, later expanded by Miniutti & Fabian (2004). In this model, the reflection fraction is set by the height of the illuminating source above the disc. When the source is high above the disc, approximately half of its emission falls on to the disc and half escapes to infinity. However, when the corona is within a few RG of the disc, general relativistic light-bending results in a smaller fraction of the emitted photons escaping to infinity, while a roughly constant fraction falls on to the disc and a larger number fall into the event horizon (Fukumura & Kazanas 2007, Dauser et al., submitted).
Arguably, the strongest evidence for the relativistic reflection interpretation of the spectrum of Mrk 335 comes from reverberation lags. Kara et al. (2013b) found a high-frequency lag of ∼150 s between the continuum dominated energy bands and those which should include a large relativistic reflection component (the iron line and soft excess). This lag corresponds to the light travel time from the corona to the accretion disc, which delays the reflected spectrum. In the absorption model, lags arise as a consequence of scattering from distant material (e.g. Legg et al. 2012), and as such there is no explanation for the broad iron line profile present in the lag energy spectrum of this and other similar sources. Additionally, Walton et al. (2013b) showed that the low-frequency lag commonly seen in AGN cannot arise from distant reprocessing, and must instead be intrinsic to the source. Fe K lags appear to increase in amplitude with black hole (BH) mass, following the same trend as found for lags of the soft excess (De Marco et al. 2013). The 150 s amplitude of the lag in Mrk 335 corresponds to the light travel time of ∼2 RG, suggesting that the continuum source is located very close to the BH and that relativistic effects are likely to be very important.
In this paper, we present the first broad-band 0.5–50 keV observation of Mrk 335 in the low state, which reveals a spectrum consistent with being almost entirely dominated by reflected emission from the inner accretion disc.
2 OBSERVATIONS AND DATA REDUCTION
In 2013 May, Swift monitoring found Mrk 335 in a very low-flux state. A 300 ks Suzaku Target of Opportunity observation was triggered, and we also performed follow up with NuSTAR. The Suzaku observation took place in June, and partially overlaps with those of NuSTAR. The Suzaku data will be presented in a separate paper (Gallo et al., in preparation), focusing on a detailed comparison of the reflection and absorption models.
2.1 NuSTAR
Mrk 335 was observed twice with NuSTAR, in 2013 June and July, for ∼80 and ∼200 ks of elapsed time (the net exposure time is approximately 50 per cent of the total observation length, due to the low Earth orbit). The first observation was split into two separate observation IDs, with approximately the same exposure time in each. The three observation IDs used are shown in Table 1.
NuSTAR observations of Mrk 335 used in this analysis. The total count rate for the whole NuSTAR energy band is given for the FPMA detector, which has a slightly higher count rate than FPMB.
| Obs. ID | Start date | On-source | FPMA count rate |
|---|---|---|---|
| time (ks) | (s−1) | ||
| 60001041002 | 2013-06-13 | 21.3 | 0.095 ± 0.02 |
| 60001041003 | 2013-06-13 | 21.5 | 0.127 ± 0.03 |
| 60001041005 | 2013-06-25 | 93.0 | 0.180 ± 0.02 |
| Obs. ID | Start date | On-source | FPMA count rate |
|---|---|---|---|
| time (ks) | (s−1) | ||
| 60001041002 | 2013-06-13 | 21.3 | 0.095 ± 0.02 |
| 60001041003 | 2013-06-13 | 21.5 | 0.127 ± 0.03 |
| 60001041005 | 2013-06-25 | 93.0 | 0.180 ± 0.02 |
The data were reduced and filtered for background flares using the NuSTAR Data Analysis Software (nustardas) 1.3.1. nustarcaldb version 20131223 was used for all instrumental responses. All spectra and light curves are extracted from the cleaned event files using nuproducts. We used 65 arcsec extraction regions for all source and background spectra, and the spectra were binned to have a signal-to-noise ratio of 5 after background subtraction and to oversample the spectra by a factor of 3. The background regions were selected from the same detector, in a region free of point sources. The resulting spectra are source dominated until >40 keV, and are consistent between the two focal plane modules (FPMA and FPMB). Count rates and exposure times for the three observation IDs are given in Table 2.
Count rates and exposure times for the four NuSTAR spectra, covering different flux states. Spectra are selected so as to have approximately the same total counts.
| Spectrum | FPMA count rate | Exposure time |
|---|---|---|
| (s−1) | (ks) | |
| 1 | 0.095 ± 0.001 | 46.7 |
| 2 | 0.130 ± 0.002 | 36.9 |
| 3 | 0.150 ± 0.002 | 30.2 |
| 4 | 0.181 ± 0.003 | 22.0 |
| Spectrum | FPMA count rate | Exposure time |
|---|---|---|
| (s−1) | (ks) | |
| 1 | 0.095 ± 0.001 | 46.7 |
| 2 | 0.130 ± 0.002 | 36.9 |
| 3 | 0.150 ± 0.002 | 30.2 |
| 4 | 0.181 ± 0.003 | 22.0 |
To investigate flux-dependent variability in Mrk 335, we split the data into four separate flux states: very low, low, high and very high. The spectra are selected by filtering the 1 ks binned FPMA light curve such that the total number of counts is approximately the same (25 per cent of the total counts) in each spectrum, as shown in Fig. 1. These spectra are then binned as discussed above.
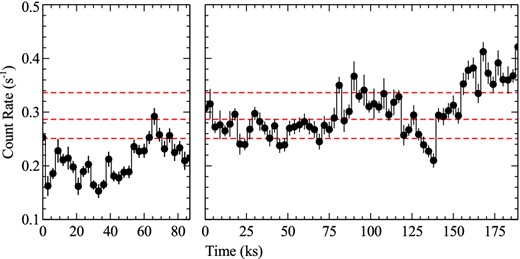
Background-subtracted light curves of the two NuSTAR observations of Mrk 335. The different flux levels used to extract spectra are shown by the horizontal lines. Note that for technical reasons the first observation was split into two separate observation IDs. For this figure, we sum the FPMA and FPMB count rates, and use 3 ks bins.
Fig. 2 shows the long-term light curve of Mrk 335, from its detection in 1971 to the latest NuSTAR observation. The observations used in this plot are described in table 3 of Grupe et al. (2008), with additional recent data from Swift, XMM–Newton and NuSTAR added.
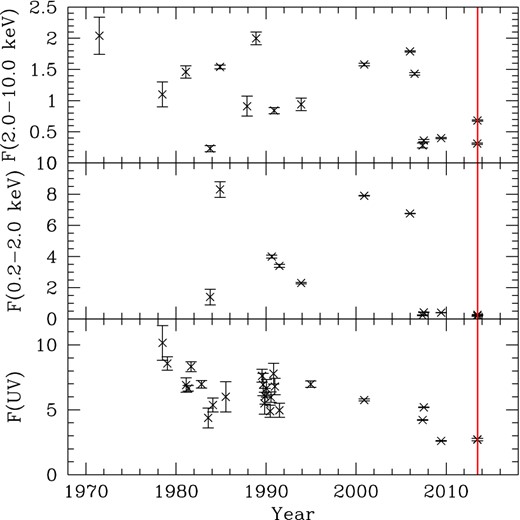
Long-term light curve of Mrk 335 as in Grupe et al. (2008). Top: 2–10 keV light curve, starting from the Uhuru detection in 1971, and ending with the two NuSTAR observations, with the 2–3 keV flux extrapolated from the best-fitting 3–50 keV model. Middle: the 0.2–2 keV light curve, starting from the 1983 EXOSAT observation and ending the Swift observation from the same day as the first NuSTAR observation. Bottom: UV light curve, measured with IUE, HST, XMM–Newton OM and Swift UVOT. The UV data are not corrected for Galactic reddening. The time of the NuSTAR observations is marked by the red vertical line. All fluxes are given in units of 10−11 erg s−1 cm−2.
2.2 Swift
Mrk 335 has been a target of a regular monitoring campaign by Swift (Grupe et al. 2012) after it was discovered in an unusual low X-ray flux state (Grupe et al. 2007). While our usual monitoring programme had a four-day cadence, during the NuSTAR observations we increased the frequency to daily observations. In order to obtain a better signal-to-noise ratio in the two spectra during the NuSTAR observations, we merged the data of 2013 June 11–14 and June 25–27, which are consistent in flux and photon index. We then merged these two spectra to give a single average spectrum, which should be approximately consistent with the average NuSTAR spectrum. We use a simple binning of 20 counts per bin, and fit the XRT data from 0.3–7 keV.
The observations with the Swift X-ray Telescope (XRT; Burrows et al. 2005) were all performed in photon counting mode (Hill et al. 2004). XRT data were reduced with the task xrtpipeline version 0.12.6., which is included in the heasoft package 6.12. For each day, we extracted a spectrum using xselect. Source counts were extracted in a circular region with a radius of 94′′ and the background counts from a source-free region with a radius 295′′. We created auxiliary response files (ARFs) for each of these spectra using the ftoolxrtmkarf. These ARFs were then combined into a single ARF per observation period using the ftooladdarf. We used the most recent response file swxpc0to12s6_20010101v013.rmf.
All spectral analysis were performed using xspec version 12.8.1, and all errors are quoted at 1σ confidence levels unless otherwise specified.
3 SPECTRAL MODELLING
Fig. 3 shows the ratio of the 100 ks observation by NuSTAR to a power law, fit from 3–4, 8–10, and 40–50 keV to exclude bands where strong reflection or absorption features may be present. The photon index of the power law is 1.72 ± 0.03. This model is clearly a poor fit, and separate narrow (at ∼6 keV) and broad (4–7 keV) features can be seen, along with a high-energy excess peaking at ∼20 keV. We note that the residuals in Fig. 3 do not represent the true shape of the component causing the excess: for that the underlying continuum needs to be determined, which is likely to be steeper than that found from this fit. In this and all following fits to the NuSTAR data alone, we neglect Galactic absorption as its effect is negligible in the NuSTAR band for this source. To thoroughly investigate the spectrum of this source, we first consider the time-averaged spectrum, then simultaneously fit the spectra from the four different flux-states.
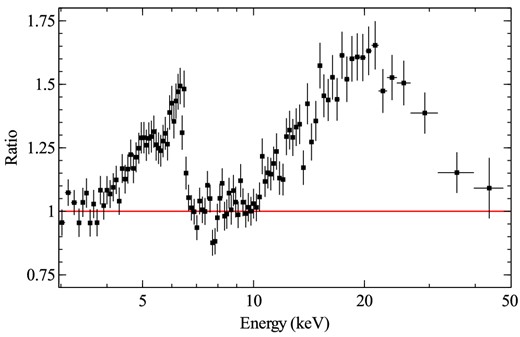
Ratio of the 100 ks NuSTAR observation of Mrk 335 to a power law, fit from 3–4, 7–10 and 40–50 keV. A narrow iron line is visible at just above 6 keV, as well as a broader feature extending from around 4–7 keV. Above 10 keV, a large excess is visible. Possible small absorption features are visible at ∼7 and 8 keV. The FPMA and FPMB spectra are grouped in this plot for clarity, but are kept separate for spectral fitting. Data are re-binned in xspec for visual clarity.
In all our fits to the spectra of Mrk 335, we include a single highly ionized warm absorption zone. This absorption is to allow for the potential narrow iron absorption features in the 7–8 keV band, which are also seen in NGC 1365 (Risaliti et al. 2013). In all cases, this absorption zone is too highly ionized to have any significant effect on the continuum or broad iron line fits. While Longinotti et al. (2013) found evidence for three warm absorption zones, the effect of the two lower ionization zones is negligible over the NuSTAR band.1
3.1 Time-averaged spectrum
We initially investigate a simple fit using a power law plus distant reflection alone, as would be expected if the intrinsic source flux had dropped sharply so that distant material contributes significantly to the observed spectrum. We model the distant reflection using the xillver model (García et al. 2013), fixing the incident photon index to the same value as the power law but leaving all other parameters free. The resulting fit is poor (|$\chi ^2_\nu =584/408=1.43$|) (residuals for this and other fits to the average spectrum are shown in Fig. 4). While this removes the narrow-line feature shown in Fig. 3 and flattens out the high-energy feature, significant residuals remain from 4–6 keV and above 20 keV. The parameters for this model and all others fit to the average spectrum are given in Table 3.
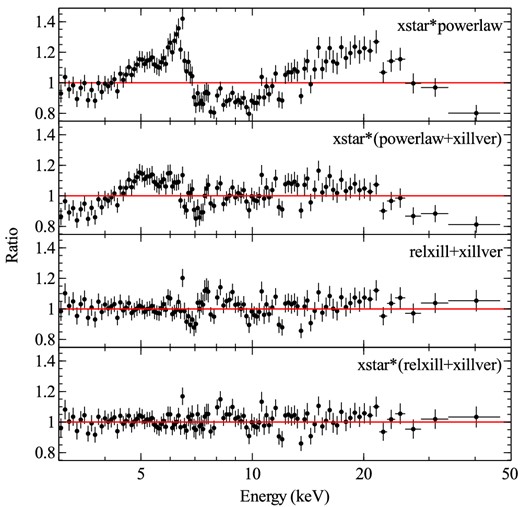
Data/model ratios for the models (1, 2 and 4 from Table 3) fit to the time-averaged spectrum. We also show (third row) the residuals from fitting model 4 without a warm absorber. Data are rebinned and grouped in xspec for clarity, but both detectors are fitted independently and with the binning described in the text. All models are fitted from 3–50 keV, where the spectrum is source-dominated.
Model parameters for fits to the time-averaged NuSTAR spectrum. All models include absorption by a single, highly ionized absorption zone, modelled with xstar. Model 1 is a simple power law, with no reflection (errors are not shown for this model, as the reduced χ2 was too high for xspec to calculate parameter errors); model 2 is the distant reflection (powerlaw+xillver) model and models 3, 4 and 5 are the relconv*reflionx, relxill and relxilllp models, respectively. Note that for model 5, we give the source height h, rather than the reflection fraction R, as this model sets R based on h.
| Model | NH | log (ξabs) | Γ | AFe | θ | a | R/h | log (ξref) | qin | |$\chi ^2_\nu /{\rm d.o.f.}$| |
|---|---|---|---|---|---|---|---|---|---|---|
| 1022 cm−2 | log(erg cm s−1) | solar | degrees | – /RG | log(erg cm s−1) | |||||
| 1 | 10.5 | 4.33 | 1.61 | 5.0 | – | – | – | – | – | 2.28/409 |
| 2 | |$33.5^{+1.3}_{-2.1}$| | 3.9 ± 0.1 | |$2.32^{+0.03}_{0.05}$| | <1.06 | <89 | – | – | – | – | 1.25/408 |
| 3 | |$10.0^{+1.6}_{-4.8}$| | >3.8 | |$2.32^{+0.03}_{-0.06}$| | |$1.99^{+0.33}_{-0.07}$| | 64 ± 1 | 0.98 ± 0.01 | >5.08 | 1.6 ± 0.1 | >8.2 | 1.00/404 |
| 4 | |$14.0^{+2.5}_{-7.8}$| | >3.7 | |$1.95^{+0.03}_{-0.04}$| | 1.8 ± 0.5 | |$30_{-6}^{+3}$| | |$0.99^{+0.01}_{-0.02}$| | |$9.2^{+0.6}_{-3.6}$| | 2.78 ± 0.03 | 3.5 ± 0.5 | 1.00/404 |
| 5 | <17 | >3.4 | |$2.0^{+0.1}_{-0.2}$| | 3.0 ± 0.5 | |$31^{+8}_{-6}$| | >0.97 | 3.1 ± 0.4 | |$2.4^{+0.4}_{-0.2}$| | – | 1.02/404 |
To examine the blurred reflection spectrum of Mrk 335, we use three different relativistic reflection models: the conventional reflionx convolved with relconv (Ross & Fabian 2005; Dauser et al. 2010), and the new relxill and relxilllp models (Dauser et al. 2013; García et al. 2014). The relxill models self consistently calculate the angle-dependent reflection spectrum from the disc, and in the case of relxilllp the reflection fraction and line profile is calculated as a function of source height, assuming a simple lamp-post geometry. By comparing the three models, we aim to establish the robustness of our parameter estimates, as well the plausibility of simple light-bending models. We include an additional constraint to the two non-lamp-post models, limiting the reflection fraction for each spin value to be less than the maximum possible reflection fraction for a lamp-post geometry at that spin. This constraint rules out unphysical models, and can give much more precise measurements of spin in reflection-dominated spectra (for more detailed discussion of this method, see Dauser et al., submitted).
All three of the blurred reflection models give excellent fits (see Table 3), and all three require high spin (Fig. 5, left-hand panel). The high reflection fractions are consistent between the models, as are the parameters of the warm absorber; however, there appear to be systematic differences between some of the other parameters. The ionization of the reflector differs somewhat between the models, but this is expected as the differences caused by ionization changes occur largely at lower energies, outside the NuSTAR band. The reflionx model gives a softer power-law, steeper emissivity profile, and higher inclination than the relxill models, while relxilllp requires a higher iron abundance.
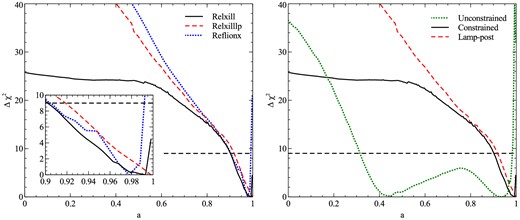
Left: Δχ2 contours for the three relativistic reflection models fit to the time-averaged spectrum. The inset shows the a = 0.9–1.0 region, and the dashed line in the main figure shows the 3σ confidence limit for a single parameter of interest. The agreement between the models is very good, although the lamp-post model hits the maximum spin limit without any upturn in χ2. Right: as left, but for the relxill in three different cases: without any constraint on the reflection fraction, with the constraint added, and the full lamp-post solution. The constrained and lamp-post lines are the same as in the left-hand panel.
In the right-hand panel of Fig. 5, we show the improvement in the spin constraint obtained by restricting the reflection fraction to physical values. Without this constraint, there are two acceptable values of the spin at the 2σ level, at ∼0.4 and ∼0.9. However, the low-spin solution still requires a high reflection fraction (R > 3) and a steep emissivity profile (q > 5). This is unphysical, as a steep emissivity profile and reflection fraction significantly greater than 1 require a large degree of light bending, which can only be achieved if the inner disc extends very close to the black hole, which in turn requires high spin. By forcing the model to remain within regions of parameter space where the reflection fraction is plausible, we obtain a much tighter constraint, with all spins below a = 0.9 ruled out at the 3σ level. This also gives much better agreement among the models.
Based on these fits, we conclude that blurred reflection models do an excellent job of modelling the time-averaged NuSTAR spectrum of the Mrk 335 low state, requiring a high reflection fraction and correspondingly high spin.
3.2 Broad-band model
Having established a best-fitting relativistic reflection model for the average NuSTAR spectrum, we then extend this to the soft band using the average Swift XRT spectrum. In Fig. 6, we show the residuals from a power law, modified by Galactic absorption with NH of 3.56 × 1020 cm−2 (Kalberla et al. 2005), fitted to the 3–4, 8–10 and 40–50 keV bands (where strong reflection and absorption features should not be present). In addition to the broad line and high-energy hump, this figure shows a strong soft excess and clear warm absorption.
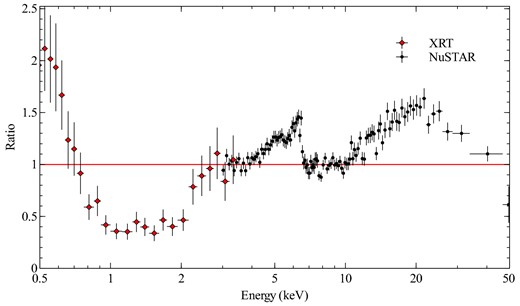
NuSTAR and XRT residuals from the average spectra fitted with a power law, modified by Galactic absorption, over the 3–4, 8–10 and 40–50 keV bands. The NuSTAR data are rebinned slightly in xspec and we ignore the XRT data above 3.5 keV for clarity (the XRT data are fitted from 0.3–7 keV). As in Fig. 3, the broad iron line and Compton hump are visible, but the XRT data reveals the presence of warm absorption and a soft excess as well.
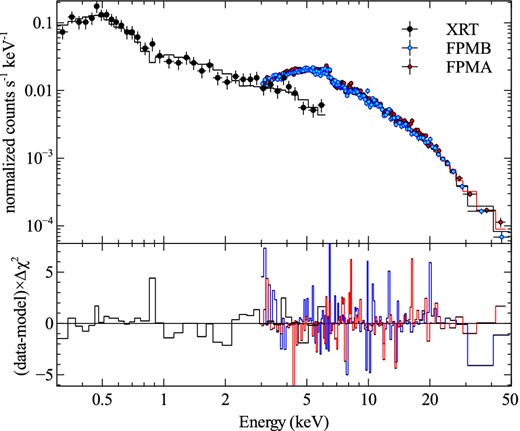
Data and residuals from fitting a blurred reflection plus power-law model, including warm absorption, to the combined XRT and NuSTAR spectra. Note that we plot δχ2 rather than a ratio, so that the residuals from both data sets can be seen on the same axes.
For the fit to this combined data set, the warm absorption becomes more important, so we include an additional, lower ionization, xstar grid to model this, as well as Galactic absorption. We use the model tbabs*xstar*xstar*(relxill+xillver) rather than independently fitting all three reflection models as the Swift data quality is not sufficient to distinguish between them.
We find an excellent fit (|$\chi ^2_\nu =446/440=1.01$|) to the broad-band spectrum with this model, despite not allowing for spectral variability between the NuSTAR and Swift observations or differences in the calibration. The model parameters are shown in Table 4. We stress that we are approximating the multiple warm absorption zones which affect the soft band (Longinotti et al. 2013) with a single zone, as the XRT spectrum does not have enough signal or resolution to constrain multiple zones. This approximation does a good job of fitting the data, but the parameters returned should be treated with a degree of caution. The fit and residuals to the combined spectrum are shown in Fig. 7.
Parameters estimates from the fit to the combined XRT and NuSTAR spectra, fitted with a power-law plus reflection model, and two warm absorbing zones (xstar*xstar*[powerlaw+relxill+xillver]). All units are the same as in Table 3.
| Component | Parameter | Value |
|---|---|---|
| Absorber 1 | NH | 7.35 ± 0.07 |
| log (ξ) | 2.04 ± 0.04 | |
| Absorber 2 | NH | 10 ± 4 |
| log (ξ) | >3.9 | |
| Power-law | Γ | 1.85 ± 0.04 |
| Reflection | qin | |$4.72_{-0.36}^{+0.25}$| |
| a | |$0.99^{+0.01}_{-0.03}$| | |
| AFe | |$3.0_{-0.8}^{+0.6}$| | |
| log (ξref) | 3.02 ± 0.02 | |
| R | |$5_{-2}^{+3}$| | |
| θ | 25 ± 5 |
The parameters returned from the joint fit are in general compatible with those found from the NuSTAR data alone, and a high reflection fraction is still required to fit the data. We conclude that the broad-band average spectrum is well modelled using a reflection-dominated solution.
3.3 Flux-resolved spectra
We now focus on the flux-resolved analysis. For this, we focus on the NuSTAR data alone, as the XRT data are not of high enough quality and do not cover the same time intervals as the NuSTAR observations. As discussed in Section 2.1, we use four spectra, selected to have the same total number of counts, from four different flux levels.
In Fig. 8, we show a different spectrum, calculated by using the lowest flux state spectrum as the background for the highest. This spectrum is well fit (|$\chi ^2_\nu =265/247=1.07$|) with a simple power-law model, with Γ = 2.1 ± 0.1, consistent with the value from spectral fitting of the mean spectrum. To estimate the limit of the reflection contribution to the difference between the highest and lowest flux states, we again use the relxill model to fit these data. We fix the parameters to those found from the time-averaged spectrum, leaving only the normalization and reflection fraction free. From this fit, we find that the reflection fraction, and hence the contribution of changes in the reflected emission to changes in the spectrum, is R < 0.16. This suggests that the spectral variability in these spectra is dominated by changes in the geometry or position of the primary X-ray source, rather than in its net flux, as this would cause both the reflected and primary emission to increase equally.
Top: difference spectrum calculated by using the lowest flux state as the background spectrum for the highest flux state spectrum, fitted with a simple power-law model. Black and red points correspond to the FPMA and FPMB spectra. Bottom: residuals to this fit.
We next apply the same three reflection models used in Section 3.1, allowing the normalization of the blurred reflection and power-law components to change in the reflionx model, the reflection fraction and normalization in the relxill model, and the source height and normalization in the relxilllp model. All three models give very good fits, with a slight preference towards the first two models (those without the emissivity profile fixed at the lamp-post solution). The best-fit parameters for the three models are given in Table 5.
Model parameters for fits to the flux-resolved NuSTAR spectra. All models include absorption by a single, highly ionized absorption zone, modelled with xstar. Model 1 is reflionx, model 2 is relxill, and model 3 is relxilllp.
| Model | NH | log (ξabs) | Γ | AFe | θ | a | log (ξref) | qin | |$\chi ^2_\nu /{\rm d.o.f.}$| |
|---|---|---|---|---|---|---|---|---|---|
| 1022 cm−2 | log(erg cm s−1) | solar | degrees | log(erg cm s−1) | |||||
| 1 | 10 ± 4 | >3.78 | 2.28 ± 0.04 | 2.2 ± 0.2 | 65 ± 1 | 0.98 ± 0.01 | <1.7 | >8 | 0.99/1078 |
| 2 | 10 ± 3 | >3.88 | |$2.14^{+0.02}_{-0.04}$| | 2.6 ± 0.2 | 65 ± 1 | 0.98 ± 0.01 | 2.0 ± 0.2 | >9 | 0.99/1078 |
| 3 | |$16_{-7}^{+1}$| | >3.72 | |$2.08_{-0.03}^{+0.02}$| | 2.2 ± 0.2 | 42 ± 2 | >0.994 | <1.16 | – | 1.02/1078 |
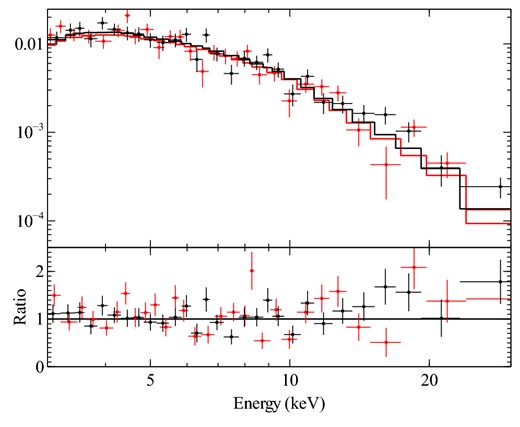
We show the data and residuals to the best-fitting relxill model in Fig. 9. This is representative of all three reflection models gives an excellent fit to the data, and leaves no significant residuals in any of the spectra.
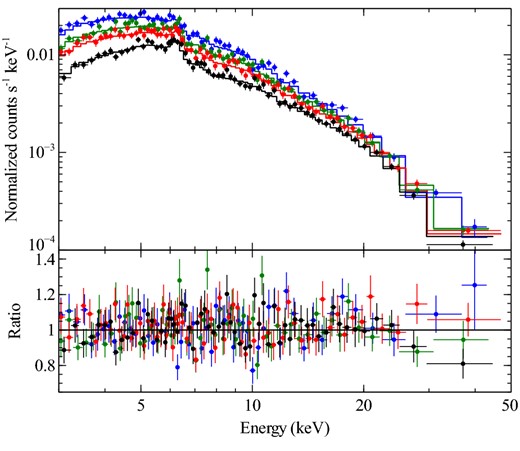
Data and residuals from fitting the relxill model to the four flux state spectra. This fit is representative of the three reflection models. The FPMA and FPMB spectra are grouped and some binning is applied in xspec for clarity, but all spectra are fit separately and binned as described in the text.
As with the average spectrum, we restrict the reflection fraction to be less than the theoretical maximum for each spin value, again obtaining extremely strong spin constraints. The χ2 contours from the three blurred reflection models are shown in Fig. 10, and as in Fig. 5 they show that high spin is preferred very strongly by all three models. The reflionx and standard relxill models also rule out maximal spin at high significance, unlike relxilllp. This is likely due to the additional constraints on the emissivity profile of the lamp-post model, which prevent it from finding the same optimal solution as the other two models. This may be pointing towards additional physics (such as ionization gradients over this disc) or a difference in the coronal geometry from the pure lamp-post model. Alternatively, the other models may be overfitting the data and the more constrained lamp-post model may be finding the more physical solution.
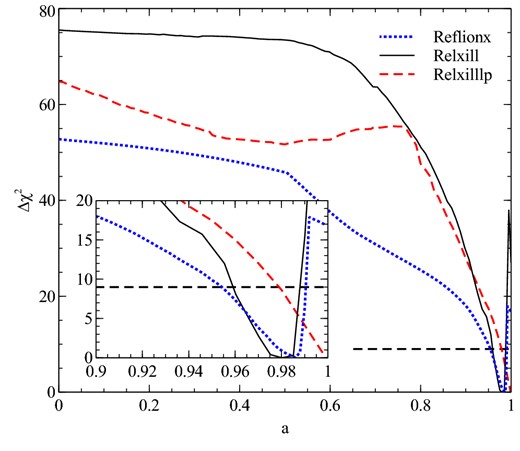
Δχ2 contours for the three relativistic reflection models fit to the four flux-resolved spectra. The inset shows the a = 0.9–1.0 region, and the dashed line shows the 3σ confidence limit, for one parameter of interest.
In the case of the lowest flux spectrum we find that, without the introduction of the constraint on R from the spin, the power-law component is unconstrained. This means that the source spectrum can be described by a pure reflection model.
We find that the reflection fraction systematically decreases with flux, and hence the source height increases with flux in the lamp-post model. Table 6 shows the reflection fractions and source heights we find, for each of the four spectra.
Reflection fractions or source heights for the three relativistic reflection models for each of the four flux-resolved spectra. The fluxes in the reflionx model are calculated using cflux and include errors on the normalization as well as the reflection fraction, leading to systematically larger errors.
| Flux | reflionx | relxill | relxilllp |
|---|---|---|---|
| R | R | h (RG) | |
| Very low | >7.9 | >8.0 | <2.3 |
| Low | |$5.9_{-1.7}^{+3.9}$| | |$4.6_{-0.6}^{+0.8}$| | |$3.1_{-0.2}^{+0.5}$| |
| High | |$4.8_{-1.3}^{+3.5}$| | |$3.6_{-0.5}^{+0.6}$| | |$3.7_{-0.3}^{+1.0}$| |
| Very high | |$3.6_{-0.9}^{+2.6}$| | |$2.7_{-0.4}^{+0.5}$| | |$5.1_{-0.8}^{+2.2}$| |
3.4 Emissivity profile
In several fits, we have found that there appear to be two acceptable values of the inclination and inner emissivity index. In Fig. 11, we show the χ2 contours for these two parameters, for all the fits presented so far. In general, we find that there are two acceptable solutions, one with high q and high θ, and one with low q and low θ. The reflionx models prefer both to be high, while the relxill models prefer the parameters to be high in the flux-resolved case, low in the broad-band average spectrum (although significantly higher than the classical limit of 3 Reynolds & Begelman 1997), and either solution is acceptable in the time-averaged case. This degeneracy likely arises from the limited spectral resolution, which makes it difficult to disentangle the blue edge of the broad line from the narrow line and absorption features. Since the blue edge of the line is the main driver of the inclination constraints, this parameter is highly sensitive to these effects, and our estimates should therefore be treated with a degree of caution. The differences between the two models could be due to the different treatment of angles – reflionx is angle-averaged, whereas relxill has an angle dependence in the reflection spectrum, or alternatively it could be due to the presence of the Fe Kβ line in the relxill model.
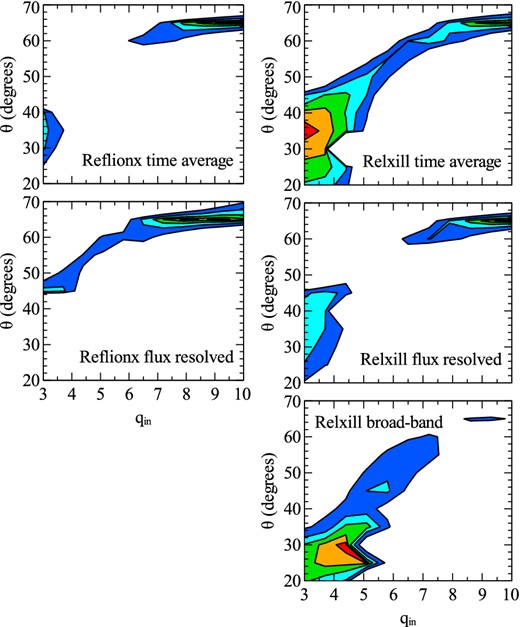
1,2,3,4 and 5σ contours (red, orange, green, cyan and blue), showing the degeneracy between the inner emissivity index and the inclination, for the reflionx and relxill models, and the different data sets used. Generally, we find solutions with either low θ and low qin, or high θ and high qin. In the case of relxill fit to the time-average spectrum (top right), both solutions are acceptable.
A more precise way of estimating the emissivity profile is given by Wilkins & Fabian (2011). In brief, this method fits the iron line as a sum of line profiles from different annuli over the disc, then the relative normalizations of the lines from each annulus give the full emissivity profile. By restricting this to the 3–5 keV band (i.e. the red wing of the iron line) and fixing the power-law parameters at the best-fitting values, we can exclude the narrow-line and absorption features from the fits, giving a more accurate constraint. This method can also allow for an independent constraint on the source height, separate from that obtained using the reflection fraction, as the precise shape of the line profile is strongly dependent on the position of the source.
Fig. 12 shows the emissivity profile obtained using this method. At large radii, the profile converges to the classical limit of q = 3 (shown by the red dashed line), but at lower radii it is extremely steep. A profile of this shape is very similar to the theoretical profile for a point source very close to the disc plane (Martocchia, Karas & Matt 2000), and we show the prediction for a lamp-post source at 2 RG above the disc plane (blue solid line). The steepness of the line profile at small radii found using this method confirms the need for a large degree of light bending to explain the observed spectrum. The missing values at intermediate and large radii are due to the lack of a constraint on the emissivity at these points, as these regions of the disc to not contribute strongly to the red wing of the line profile (for more detail, see Wilkins & Fabian 2011).
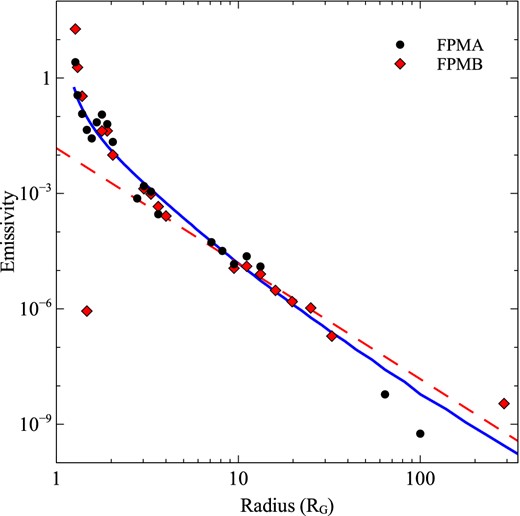
Emissivity profile in arbitrary units calculated from the second, long observation of Mrk 335 for FPMA (black points) and FPMB (red points). The dashed red line shows the classical q = 3 profile, and the solid blue line shows the theoretical emissivity profile for a point source at a height of 2 RG from the disc plane. These lines are not fit to the points, and are simply intended as a guide.
While it seems likely that the emissivity profile is steep (no model significantly prefers a fit with q < 4), as would be expected if the light-bending interpretation is correct, it is difficult to be sure exactly how steep. The values of θ found for the high q solutions may be unphysically high for a NLS1, and it may be that the true values of θ and q are more moderate. It appears that the Suzaku XIS data, with their higher spectral resolution, favour such a solution (Gallo et al., in preparation).
4 DISCUSSION
We have demonstrated that the broad-band spectrum of a low state in Mrk 335 can be well fitted with relativistic reflection. We find a high spin, and very high reflection fractions, which suggest that the low state is caused by a collapse of the corona in towards the event horizon.
These Mrk 335 observations appear very similar to the XMM–Newton observation of 1H0707-495 in 2011, described by Fabian et al. (2012). Fabian et al. found that the spectrum could be described by blurred reflection alone, without a power-law component (although one was slightly preferred by the fit, it was not constrained, as in the lowest flux spectrum of Mrk 335), and both Fe-K and Fe-L lines were clearly visible and strongly blurred. A similarly steep emissivity profile was obtained for 1H0707-495, as well as high spin. From the similarity of the source state and parameters, we conclude that these two objects are exhibiting the same phenomenon. The light-bending solution is very similar to that found for MCG–6-30-15, where the variability is dominated by the power-law component, and the relativistic reflection is much more constant (Fabian et al. 2002; Miniutti et al. 2003; Vaughan & Fabian 2004; Parker et al. 2014). Similar light-bending effects have also been seen in NGC 3783 (Reis et al. 2012), IRAS 13224 (Fabian et al. 2013; Kara et al. 2013a; Chiang et al., submitted), and the XRB XTE J1650-500 (Rossi et al. 2005; Reis et al. 2013).
We note that the ∼150 s Fe K lag observed by Kara et al. (2013b) was during a high-flux state. This suggests that the lower edge of the corona must still have been close to the disc (within a few RG), despite the increased flux, whereas the simple lamp-post model used here would suggest that the source height should be larger in a high-flux state. It is possible that this conflict is due to the simplified geometry used, as the corona, while known to be compact, may not be well approximated by a point source. If we consider a vertically extended corona which contracts downwards towards the BH, then the primary continuum emission will be dominated by the upper surface and the blurred reflection will be dominated by the lower surface. In this way the reflection spectrum would change very little, while the continuum would decrease sharply in flux.
We have demonstrated the ability of the maximum reflection fraction method introduced in Dauser et al. (submitted) to constrain the spin parameter, obtaining consistent and precise measurements of the spin from different reflection models. The spin estimate for the relxilllp model is extreme in both the average and flux-resolved spectra. We suggest that this may be due to the assumed emissivity profile, which does not take into account effects which can steepen the profile, such as changes in the ionization parameter across the disc (Svoboda et al. 2012). While this is a potential issue, this model still gives a very good fit, and is more physically motivated and constrained than the other models. More complex source geometries and determination of a more accurate ionization profile are beyond the scope of this work, but are promising targets for the next generation of relativistic reflection models.
Previous work on modelling the reflection spectrum of Mrk 335 has also found high-spin values. Gallo et al. (2013) found a > 0.7 at 90 per cent confidence in an intermediate flux spectrum observed with XMM–Newton, and Walton et al. (2013a) found a = 0.8 ± 0.1 in a high-flux state using Suzaku XIS and PIN spectra. Our best-fitting value of 0.98 ± 0.01 confirms the high spin of this source, and greatly improves on the precision of this measurement. We note that there are further possible systematic effects which may affect the accuracy of this measurement, such as emission from within the innermost stable circular orbit (Reynolds & Fabian 2008).
Spectra showing broad features around the iron line can generally be fitted with either reflection or absorption models (e.g. Miller et al. 2013). In this work, we have focused on the reflection interpretation of these data, motivated by the presence of an Fe K lag (Kara et al. 2013b), but we do not rule out the possibility that this spectrum could be produced by other models. We note that a detailed comparison of alternative models over the soft band using the Suzaku data (Gallo et al., in preparation) suggests that the reflection model is statistically preferred. Additionally, we stress that the light-bending model reproduces the spectral variability in a self-consistent manner and provides definite predictions, such as broadening of the line in a low state.
5 CONCLUSIONS
Detailed spectral analysis of an extremely low-flux observation of Mrk 335 by NuSTAR has revealed spectra with exceptionally high fractions (≳8) of relativistically blurred emission, which we interpret as being due to the X-ray source collapsing down to within ∼2 RG of the BH event horizon. Fitting with the relxilllp blurred reflection model, which self-consistently calculates the reflection fraction and blurring parameters for a point source above the disc suggest a change in the height (above the disc plane) from < 2.3RG to |$5.2_{-0.8}^{+2.2}R_{\rm G}$| during the observations.
By fitting the spectra, we find parameters indicative of reflection from the inner edge of the accretion disc around a rapidly spinning BH, which is confirmed by analysis of how the reflection fraction changes with the source flux, and by determination of the emissivity profile, which is typical for a source within a few RG of the event horizon. By excluding unphysical solutions we have calculated extremely precise measurements of the AGN spin, a = 0.98 ± 0.1, based on the requirement that a high spin is needed to produce the necessary light-bending for a reflection-dominated spectrum.
We conclude that the extreme spectral variability in Mrk 335 can be attributed to light bending due to strong relativistic effects focusing the continuum radiation on to the disc at low source heights, and this observations yields a spectral image of the innermost region around a rapidly spinning BH.
This work is based on observations made by the NuSTAR mission, a project led by the California Institute of Astronomy, managed by the Jet Propulsion Laboratory, and funded by NASA. This research has made use of the nustardas, jointly developed by the ASI Science Data Center (ASDC, Italy) and the California Institute of Technology (USA). At Penn State Swift is supported by NASA contract NAS5-00136. MLP acknowledges financial support from the Science and Technology Facilities Council (STFC). ACF thanks the Royal Society for support. AM and GM acknowledge financial support from Italian Space Agency under grant ASI/INAF I/037/12/0 - 011/13. DRW is supported by a CITA National Fellowship. The research leading to these results has received funding from the European Union Seventh Framework Programme (FP7/2007-2013) under grant agreement no. 312789.
We note that the predictions for the iron absorption features at ∼7–8 keV differs between the xstar grids used here and the xabs SPEX model used in Longinotti et al. (2013). At the ionization states reported by Longinotti et al., xabs does not predict any features over this band, while xstar does. It is therefore unclear whether this represents the same absorption zone or another, higher ionization zone.
