-
PDF
- Split View
-
Views
-
Cite
Cite
M. I. Moretti, G. Clementini, T. Muraveva, V. Ripepi, J. B. Marquette, M.-R. L. Cioni, M. Marconi, L. Girardi, S. Rubele, P. Tisserand, R. de Grijs, M. A. T. Groenewegen, R. Guandalini, V. D. Ivanov, J. Th. van Loon, The VMC Survey – X. Cepheids, RR Lyrae stars and binaries as probes of the Magellanic System's structure, Monthly Notices of the Royal Astronomical Society, Volume 437, Issue 3, 21 January 2014, Pages 2702–2719, https://doi.org/10.1093/mnras/stt2081
Close - Share Icon Share
Abstract
The VISTA near-infrared Y, J, Ks survey of the Magellanic System (VMC) survey is obtaining multi-epoch photometry in the Ks band of the Magellanic System down to a limiting magnitude of Ks ∼ 19.3 for individual epoch data. The observations are spaced in time such as to provide optimal sampling of the light curves for RR Lyrae stars and for Cepheids with periods up to 20–30 d. We present examples of the Ks-band light curves of Classical Cepheids and RR Lyrae stars we are obtaining from the VMC data and outline the strategy we put in place to measure distances and infer the System three-dimensional geometry from the variable stars. For this purpose, the near-infrared Period–Luminosity, Period–Wesenheit and Period–Luminosity–Colour relations of the system RR Lyrae stars and Cepheids are used. We extensively exploit the catalogues of the Magellanic Clouds’ variable stars provided by the EROS-2 and OGLE III/IV microlensing surveys. By combining these surveys, we present the currently widest-area view of the Large Magellanic Cloud as captured by the galaxy Cepheids, RR Lyrae stars and binaries. This reveals the full extent of the main structures (bar/s – spiral arms) that have only been vaguely guessed before. Our work strengthens the case for a detailed study of the Large Magellanic Cloud three-dimensional geometry.
INTRODUCTION
The Magellanic Clouds (MCs) are the largest satellites of the Milky Way (MW) and the nearest external system of interacting galaxies. They contain both old and young stars placing them in a favoured position in the context of studying the evolution of galaxies. The MCs are part of a bigger structure, the Magellanic System (MS), formed by the Large Magellanic Cloud (LMC), the Small Magellanic Cloud (SMC), the Bridge and the Stream. The Bridge and the Stream are mainly formed by gas, and are the results of the interaction between the two Clouds (e.g. Besla et al. 2012). The LMC is the first step of the extragalactic distance scale, hence knowing its three-dimensional (3D) structure holds the key for a proper definition of the entire cosmic distance scale (see Walker 2012, and references therein, for a recent review). The knowledge of the whole MS structure and of its stellar components is also of crucial importance to better understand the evolution of the two Clouds, the interaction with the MW and, in turn, to improve our understanding about the formation of the Galaxy and its satellites.
Started in 2009 November and expected to extend beyond the originally planned ∼5 yr time span, the VISTA near-infraredY, J, Kssurvey of the Magellanic System (VMC,1 P.I.: M.-R. L. Cioni, see Cioni et al. 2011) is studying the star formation history (SFH) and the 3D structure of the MS using both constant and variable stars for this purpose. The SFH is being recovered by means of the classical colour–magnitude diagram (CMD) reconstruction method (see Rubele et al. 2012). The 3D geometry is being inferred from a number of different distance indicators: the luminosity of the red clump stars, and the Period–Luminosity (PL), Period–Luminosity–Colour (PLC) and Period–Wesenheit (PW) relations of the pulsating variable stars (Leavitt & Pickering 1912; Madore & Freedman 2012 and references therein; Longmore, Fernley & Jameson 1986; Coppola et al. 2011 and references therein). The RR Lyrae stars belong to the oldest stellar component (t > 10 Gyr) in a galaxy and mainly trace the galactic halo, whereas the Classical Cepheids (CCs) are the youngest among the radially pulsating variables (50–200 Myr) and mainly reside in star-forming regions, galactic bars and spiral arms. These two types of pulsating variables are thus optimal to characterize the spatial structure of MS components with different ages.
The VMC strategy, its main goals and first data are described in Cioni et al. (2011, hereafter Paper I), first scientific results were presented in Miszalski et al. (2011), Gullieuszik et al. (2012), Rubele et al. (2012), Cioni et al. (2013a), Tatton et al. (2013) and Cioni et al. (2013b). First results for the pulsating stars, based on the VMC Ks-band light curves, were presented in Ripepi et al. (2012b, hereinafter R12b) for CCs in the VMC tiles covering the South Ecliptic Pole (SEP), and the 30 Doradus (30 Dor) regions of the LMC, and in Ripepi et al. (2013, hereinafter R13) for LMC Anomalous Cepheids. In two forthcoming papers (Moretti et al., in preparation; Muraveva et al., in preparation), we will present results obtained from similar studies of the LMC RR Lyrae stars (see Ripepi et al. 2012a for preliminary results).
The microlensing surveys of the MS (Udalski, Kubiak & Szymanski 1997; Alcock et al. 2000; Tisserand et al. 2007; Wyrzykowski et al. 2011a,b; see also Section 2.1) increased dramatically the census of the MC variable stars by discovering thousands of variables in the two Clouds. But an important piece of information still missing are near-infrared light curves for these variables. The VMC survey is now filling this gap by obtaining Ks photometry in time series mode of the MC variables brighter than Ks ∼ 19.3 mag, with an optimal sampling of the RR Lyrae stars and of Cepheids with periods shorter than about 20–30 d (saturation limits the observation of longer period Cepheids).
In this paper, we describe the VMC survey's Ks time series data, and outline the procedures we have developed, tested and fine tuned to derive distances and to study the 3D structure of the MS from the analysis of the Ks light curves of Cepheids and RR Lyrae stars.
The paper is organized as follows. Section 2 describes the type and quality of the VMC data for the variable stars, and compares the VMC sky coverage with that of the microlensing surveys. Sections 3 and 4 outline the analysis methods, respectively, for the inner and outer LMC regions where optical data for the variable stars are available from different surveys. We compare in Section 5 our results from the variable stars with the SFH results while in Section 6 we discuss the stellar structure of the LMC. Finally, Section 7 provides a summary.
VARIABLE STARS IN THE VMC SURVEY
The VMC survey is imaging ∼200 deg2 of the MS in YJKs (λc = 1.02, 1.25 and 2.15 μm, respectively) reaching a sensitivity limit on the stacked images close to Vega magnitudes Y = 21.1 mag, J = 21.3 mag and Ks = 20.7 mag with a signal-to-noise ratio S/N = 10. The survey covers the LMC area (116 deg2) with 68 tiles,2 while 27 tiles cover the SMC (45 deg2), and 13 cover the Bridge (20 deg2). Additionally, two tiles (3 deg2) are positioned on the Stream. The VMC Ks-band data are taken over 12 separate epochs (Paper I), each reaching a limiting magnitude of Ks ∼ 19.3 mag with an S/N∼ 5 (Fig. 1). The limit reached by the single-epoch data allows us to comfortably detect the minimum light of the RR Lyrae stars in both the LMC and the SMC.3 Previous near-infrared surveys such as DENIS (Cioni et al. 2000), 2MASS (Skrutskie et al. 2006) and IRSF/SIRIUS (Kato et al. 2007; Ita 2009) were generally single epoch and in any case much shallower than VMC. For bright stars, the VMC survey is limited by saturation which causes a significant departure from linearity starting at Ks ∼ 10.5 mag, the actual value varies with seeing, airmass, etc. (see fig. 7 of Paper I). As a consequence, the Cepheids for which VMC data are available have pulsation periods shorter than 20–30 d. The Ks-band monitoring sequence of each VMC tile can start at any time, but once a sequence is started each subsequent observation is obtained at intervals equal to or larger than: 1, 3, 5 and 7 d, for epochs from 2 to 5, and then, for epochs from 6 to 11, at least 17 d apart. This scheduling permits good light-curve coverage for both Cepheids and RR Lyrae stars.
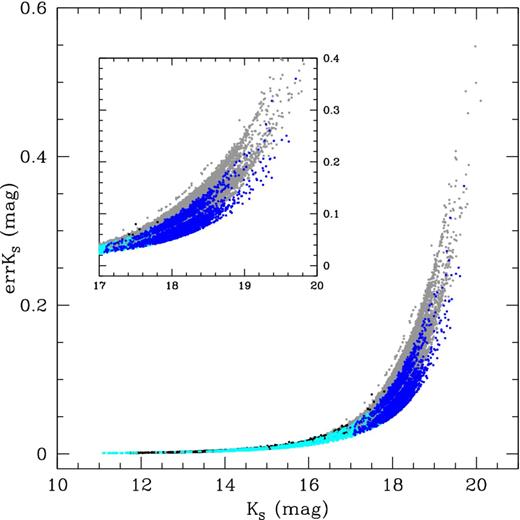
Typical errors per single epoch observation from the VSA aperture photometry. Grey and blue points correspond to observations of RR Lyrae stars, black and cyan points correspond to observations of CCs in the VMC tiles LMC 6_6 (30 Dor region) and 8_3, respectively. The inset shows an enlargement of the RR Lyrae region. See the text for details.
The VMC images are processed by the Cambridge Astronomical Survey Unit (CASU) through the VISTA Data Flow System (VDFS) pipeline that performs aperture photometry of the images and computes the Julian Day (JD) of observation for each source by averaging only the JDs of the pawprints in which that source was observed. The reduced data are then sent to the Wide Field Astronomy Unit (WFAU) in Edinburgh where the single epochs are stacked and catalogued by the Vista Science Archive (VSA; Lewis, Irwin & Bunclark 2010; Cross et al. 2012).
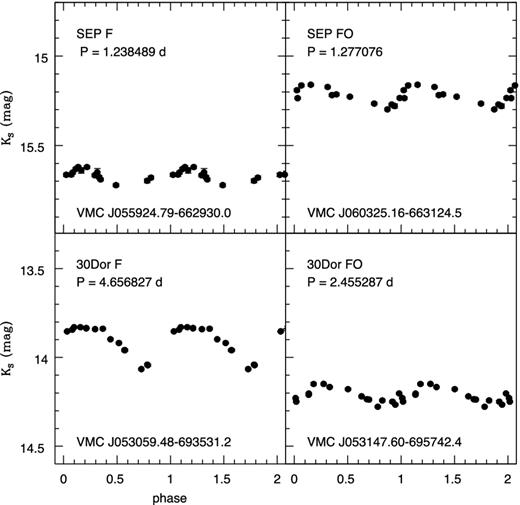
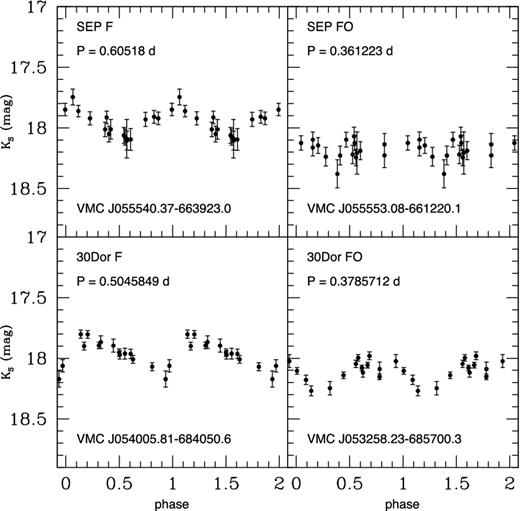
Full 12-epoch time series were obtained for 19 VMC tiles, as of 2013 July: 10 in the LMC, four in the SMC, three in the Bridge and two in the Stream. Fig. 1 shows the typical errors of the Ks-band single-epoch data from the VSA aperture photometry for CCs (black and cyan points) and RR Lyrae stars (grey and blue points) in the VMC tiles LMC 6_6 and 8_3, respectively. The latter tile lies in a low crowding, peripheral area of the LMC; tile LMC 6_6 is centred instead on the well-known 30 Dor star-forming region where the high crowding boosts up the photometric errors in comparison with the outer fields. Two distinct sequences are visible among RR Lyrae stars in tile LMC 8_3 (blue points, see zoomed box). The upper one corresponds to concatenation mode (shorter observing time, see Paper I) observations. To this sequence also belong observations obtained on the 25-10-10 and the 22-12-09; during the 25-10-10 night the seeing was lower than in other nights. During the 22-12-09 night there is no particular issue, apart for a zero-point smaller respect to other nights. RR Lyrae stars in tile LMC 6_6 (grey points) also show the same dichotomy, even if it is less evident in Fig. 1; moreover an upper thin sequence is visible. This corresponds to observations obtained on the 17-11-2009 when the zero-point was also lower than in other nights. Among the sparse fields is tile LMC 8_8 that includes the Gaia SEP (GSEP) region, an area of about 1 square degree in size, that the Gaia astrometric satellite (Lindegren & Perryman 1996; Lindegren 2010) will repeatedly observe for calibration purposes at the start of the mission. Examples of the VMC Ks-band light curves for CCs and RR Lyrae stars in the 30 Dor region (lower panel) and in the SEP field (upper panel) are shown in Figs 2 and 3, respectively. The severe crowding conditions make the analysis of the RR Lyrae stars in the 30 Dor field much more complicated and time consuming than in the SEP field and any other peripheral field of the LMC. For these stars, we used light curves obtained from the point spread function (PSF) photometry technique (Rubele et al. 2012) applied on the single-epoch data as described in Moretti et al. (in preparation). In general, we will use the aperture photometry processed through the VISTA pipeline for the RR Lyrae stars in the outer tiles, and a homogenized PSF photometry (see details in Rubele et al., in preparation) for the highly crowded tiles. The small error bars in the bottom panels show that the PSF photometry is very effective in this crowded field. Moreover, the errors in the upper panel are smaller or larger according to the observing conditions (see Fig. 1).
Typical VMC Ks-band light curves of a fundamental-mode (F) and a first-overtone mode (FO) CCs in the 30 Dor region (lower panels) and in the SEP field (upper panels). The errors on the individual Ks data points are as in Fig. 1.
Typical VMC Ks-band light curves of fundamental-mode (F) and first-overtone (FO) RR Lyrae stars in the 30 Dor region (bottom panels) and in the SEP field (upper panels).
The time sampling of the VMC survey along with the significantly reduced amplitude of the light variation in the Ks passband allow us to obtain very precise estimates of the mean Ks magnitude of the MS pulsating variable stars (R12b, R13) but we have to rely on variable star catalogues produced by the microlensing surveys (Sections 2.1) for identification, coordinates and pulsation properties (period, epoch of maximum light, parameters of the Fourier decomposition of the visual light curves). Unfortunately, parts of the VMC survey's footprint is not presently covered by the microlensing surveys, leaving us to rely on the VMC data alone for the identification. The average magnitudes in the Ks-band, derived using a spline interpolation of the data for the CCs and the fit with templates (Jones, Carney & Fulbright 1996) for the RR Lyrae stars, are then used to construct PL, PLC and PW relations that, thanks to their small intrinsic dispersions, can provide individual distances to the investigated variable stars and in turn information on the 3D structure of the MS.
Optical catalogues: the microlensing surveys
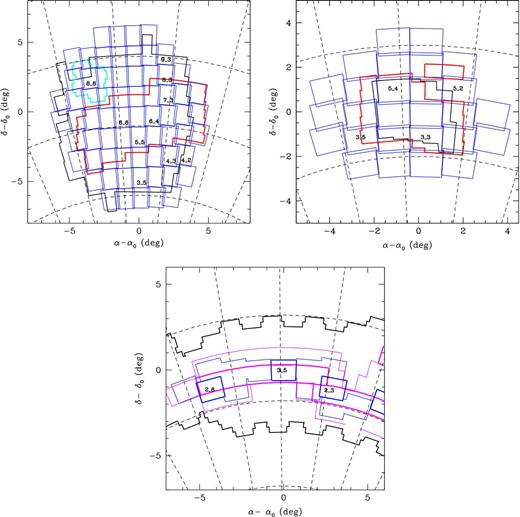
The LMC/SMC microlensing surveys have detected and characterized tens of thousands RR Lyrae stars, CCs, binaries and Long Period Variables (LPVs). So far, the largest spatial coverage of the LMC is that obtained by the second generation of the EROS microlensing experiment (hereinafter EROS-2, Tisserand et al. 2007). EROS-2 time series data were collected in two passbands, a blue channel with λ = (420–720) nm, that overlaps to the V and R standard bands, and a red channel with λ = (620–920) nm, that roughly matches the mean wavelength of the Cousins I band (Tisserand et al. 2007). OGLE (Udalski et al. 1997), of which the most extended area coverage is so far that obtained during the third phase (hereinafter OGLE III) uses instead standard BJohnson (BJ), VJohnson (VJ) and ICousins (IC) filters. Furthermore, the median seeing of the OGLE III images is better than the one of EROS-2 images. It allows a better stars separation and measurement in highly crowded fields. For these reasons, the use of the OGLE III data was preferred wherever those data were available (e.g., in the regions covering the LMC central bar), while we are using the EROS-2 data in the outer parts of the LMC that are not yet covered by other surveys. For the SMC, the areas covered by EROS-2 and OGLE III are very similar, hence we will mainly use as a reference for our study the OGLE III data. Fig. 4 shows the sky coverage of different surveys in different regions of the MS. The distribution of VMC (blue boxes), OGLE III and IV (red and cyan contours, respectively) and EROS-2 (black line) field of view (FoV) are shown for the LMC (upper-left panel) and the SMC (upper-right panel). The OGLE III catalogues of variable stars are publicly available at the web site,4 and contain light curves for 24 906 RR Lyrae stars and 3361 CCs in the LMC, and 2475 RR Lyrae and 4630 CCs in the SMC. For each object, the catalogue provides right ascension, declination, mean Johnson–Cousins V, I magnitudes, period, I-band amplitude, along with the Fourier parameters R21, ϕ21, R31 and ϕ31 of the I-band light curves (Soszyński et al. 2009). On the other hand, the EROS-2 catalogues of RR Lyrae stars and Cepheids are not public yet, but they were kindly made available to us by the EROS-2 collaboration. It should be noted that OGLE III has published catalogues of confirmed CCs and RR Lyrae stars for both the LMC and the SMC (Soszyński et al. 2008, 2009, 2010a,b) whereas for EROS-2 we only have catalogues of candidate Cepheids and RR Lyrae stars, that we individually checked, as described in Section 4.
Upper panels: sky coverage of the LMC (left) and SMC (right) for EROS-2 (black), OGLE III (red) and OGLE IV (cyan). VMC tiles are indicated in blue; tiles already completely observed are labelled. Lower panel: Map of the Bridge area. The sky coverage of OGLE IV (black), VMC (blue) and STEP (magenta) are shown. Thicker lines show the VMC and STEP areas completely observed as of 2013 July in both surveys; VMC tiles already completely observed in the Bridge area are labelled.
A number of the most peripheral VMC tiles in both the LMC and the SMC and, most noteworthy, the entire Bridge region between the two Clouds, are not covered yet by any of the previous microlensing surveys. However, optical time series data will be provided both in the SMC and in the Bridge area by the survey ‘SMC in Time: Evolution of a Prototype interacting late-type dwarf galaxy’ (STEP; P.I. V. Ripepi; see Ripepi et al. 2006) which is being carried out with the Very Large Telescope Survey Telescope VST.5 Furthermore, the OGLE IV6 survey, started in 2010, is in progress. Once completed it will almost entirely cover the whole FoV of the VMC survey. The lower panel of Fig. 4 shows the sky coverage in the Bridge area of the OGLE IV (black contours), VMC (blue boxes) and STEP (magenta boxes) surveys. Thicker lines mark tiles already completely observed.
Finally, no pulsating variables are known in the Stream. It is supposed to be mainly gaseous but recently the presence of a stellar Stream counterpart was predicted and suggested (Besla, Hernquist & Loeb 2013; Bagheri, Cioni & Napiwotzki 2013; Noël et al. 2013). This makes it crucial to find a method for selecting variable stars from the VMC data alone (Cross et al. 2012).
Combining OGLE, EROS and VMC data for the variable stars
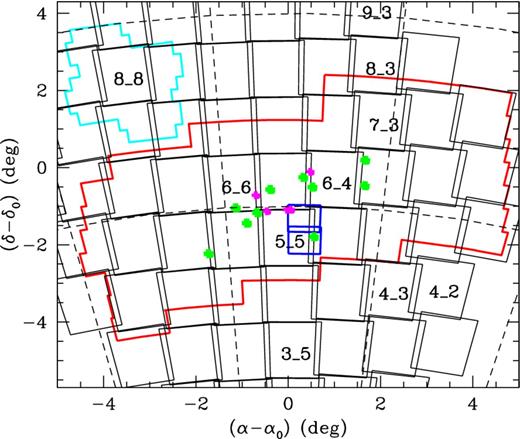
Figs 4 and 5 shows the location of the 10 tiles completely observed in the LMC as of 2013 July, with respect to the OGLE III and the recently published first OGLE IV data. The discussion in the following sections will refer mainly to the tiles LMC 5_5, 6_4, 6_6, 8_3 and 8_8, for which fully processed and catalogued single-epoch data are already available through the VSA, and, more specifically to the tiles LMC 6_6 (30 Dor field), 8_3 and 8_8 (SEP field).
Location of the ten LMC tiles completely observed by VMC as of July 2013 with respect to the OGLE III and OGLE IV (red and cyan contours, respectively) fields. Tiles LMC 5_5, 6_4, 6_6 and 7_3 are entirely covered by the OGLE III observations. Tile LMC 8_8 is entirely covered by OGLE IV, and also for about 70 per cent by EROS-2. Tile LMC 8_3 is entirely covered by EROS-2 and only for about 30 per cent by OGLE III. EROS-2 covers entirely tiles LMC 3_5 and 4_3, roughly 40 per cent of tile LMC 9_3, and only a very tiny portion of tile LMC 4_2 (see also Fig. 4). Also marked are the LMC regions where a number of RR Lyrae stars were studied spectroscopically by Clementini et al. (2003) and Gratton et al. (2004) (blue rectangles), Borissova et al. (2004, 2006, 2009) (green boxes), and Szewczyk et al. (2008) (magenta boxes).
In order to test our procedures, for the tiles LMC 6_6 and 8_8, we have used both the catalogues of candidate variables provided by EROS-2 and the catalogues of RR Lyrae stars and Cepheids published by OGLE III and IV. For the other tiles, we have used the OGLE catalogues when available, otherwise we have exploited the EROS-2 data. We have cross-matched the optical catalogues against the VMC deep tile (vmcSource table) catalogues using the VSA utilities. Specifically, we used the VMC tiles coordinates as in Paper I, the VMC LMC tile dimension of 1| $_{.}^{\circ}$|201 in RA, 1| $_{.}^{\circ}$|475 in Dec., and the angular coordinates as described in van der Marel & Cioni (2001) to select the optical data, then we used the Cross-ID tool available in the VSA (Cross et al. 2012) to match the optical and the VMC infrared catalogues. A small pairing radius of 0.5 arcsec was adopted for tiles LMC 5_5, 6_4 and 6_6 to reduce the number of misidentifications in these rather crowded regions of the LMC. It was increased to 1.0 arcsec for the outer LMC tiles 8_3, 8_8, which are less affected by crowding. Table 1 summarizes the numbers of CCs and RR Lyrae stars discovered by the microlensing surveys in the tiles discussed here, and the numbers of their VMC counterparts. The incomplete optical coverage of some tiles explains the small number of known variables.
Statistics of RR Lyrae stars and CCs within the VMC tiles: each column lists the number of variables found by the microlensing surveys, the number of the recovered VMC counterparts and the fraction of variables with VMC counterparts. The pairing radii were 0.5 arcsec for the inner LMC regions, and 1 arcsec for the outer regions (see Section 2.2 for details).
| Tile . | OGLE III . | EROS-2 . | OGLE IV . | |||
|---|---|---|---|---|---|---|
| . | RRL . | CC . | RRL . | CC . | RRL . | CC . |
| 5_5 | 2753 (2255) 82 % | 214 (207) 97 % | - - - | - - - | - - - | - - - |
| 6_4 | 3446 (2543) 74 % | 402 (393) 98 % | - - - | - - - | - - - | - - - |
| 6_6 | 2040 (1637) 80 % | 327 (321) 98 % | - - - | - - - | - - - | - - - |
| 8_3 | 133a (127) 95 % | 52a (52) 100 % | 262 (258) 98 % | 126 (125) 99 % | - - - | – - - |
| 8_8 | - - - | - - - | 109b (109) 100 % | 9b (9) 100 % | 223 (219) 98 % | 19 (19) 100 % |
aOGLE III covers only a tiny portion corresponding to about 1/4 of tile LMC 8_3.
bEROS-2 covers only about 2/3 of tile LMC 8_8.
The recovery of infrared counterpart of RR Lyrae stars varies from 74 per cent in the crowded inner tiles to 98 per cent in the outer ones. The recovery rates for the intrinsically brighter CCs are higher: 98 per cent in the central tiles and 100 per cent in the outer ones. Tests performed on tile LMC 6_6 show that the lower completeness of the internal fields is mainly due to Cepheids not recovered in the VSA VMC catalogue because they are at the edges of the tile. In fact, even in this most crowded tile the completeness rises to 100 per cent in the internal part of the tile. The lower completeness for the RR Lyrae stars is instead mainly due to the high crowding in the internal regions and nebular gas emissions which limit the detection of variables as faint as the RR Lyrae stars. In these conditions, the PSF photometry shows more accuracy and efficiency than the VSA aperture photometry, increasing the number of RR Lyrae stars with VMC Ks photometry. Indeed, in the central part of tile LMC 6_6 the completeness of the VSA catalogue for RR Lyrae stars is 82 per cent, but it rises to 86 per cent for the PSF catalogue. Increasing the pairing radius from 0.5 to 1 arcsec, would also increase the number of cross-matches up to about 90 per cent. However, the comparison of optical and infrared light curves, and the position in the (Ks, I–Ks) CMD reveal that 47 of 51 additional detections obtained using a pairing radius between 0.5 and 1 arcsec, are not true RR Lyrae stars. Therefore, using a pairing radius of 0.5 arcsec in the crowded regions is preferred because it yields a more reliable sample.
THE CENTRAL FIELDS OF THE LMC
A number of different studies, besides the microlensing surveys, have targeted the RR Lyrae stars in the central region of the LMC both photometrically and spectroscopically. Clementini et al. (2003) and Gratton et al. (2004) presented visual photometry and spectroscopy for more than a hundred RR Lyrae stars in two fields located close to the bar of the LMC (blue rectangles in Fig. 5). They measured average magnitudes, local reddening and individual metallicities for the RR Lyrae stars. In particular, they inferred a mean metallicity for the RR Lyrae stars in this region of the LMC of [Fe/H] = −1.48 ± 0.03 dex, with σ = 0.29 dex on the Harris (1996) metallicity scale. Tile LMC 5_5 contains both fields observed by Clementini et al. (2003) and Gratton et al. (2004). We will use the metallicities in those papers to study the PLKZ relation of the RR Lyrae stars in tile LMC 5|$\_5$|. Borissova et al. (2004, 2006) measured radial velocities for 87 LMC RR Lyrae stars and metallicities for 78 of them. These targets are located in 10 fields (green rectangles in Fig. 5) spanning a wide range of distances, out to 2| $_{.}^{\circ}$|5 from the centre of the LMC. One of these fields is contained in the 30 Dor tile. They inferred a mean metallicity value [Fe/H] = −1.53 ± 0.02 dex with a dispersion of σ = 0.20 ± 0.02 dex using the Gratton et al. (2004) technique, and showing that the RR Lyrae stars in the central part of the LMC form a rather homogeneous metal-poor population. We will use the metallicity values obtained by Borrisova et al. for the RR Lyrae stars in the 30 Dor field (Moretti et al., in preparation). For the RR Lyrae stars in the tiles for which there are no spectroscopic measurements, metal abundances will be estimated from the Fourier parameters of the V-band light curves according to the technique devised by Jurcsik & Kovács (1996) and Morgan, Wahl & Wieckhorst (2007) for fundamental-mode and first-overtone RR Lyrae, respectively, and adopting the new metallicity calibrations obtained by Nemec et al. (2013).
Near-infrared PL relations for the RR Lyrae stars in the central part of the LMC have been obtained by a number of different authors. For example, Szewczyk et al. (2008) obtained deep near-infrared J- and K-band observations of six fields, three of which overlap, located in the LMC bar (magenta rectangles in Fig. 5). They found consistent values for the distance modulus of the LMC using a number of different theoretical and empirical calibrations of the PLKZ relation, and adopt as their final value 18.58 ± 0.03 (statisical) ± (0.11) (systematic) mag, in good agreement with most independent determinations of the distance to this galaxy. Borissova et al. (2009) investigated the metallicity dependence of the near-infrared PL relations for RR Lyrae stars combining near-IR photometry and Borissova et al. (2004, 2006) spectroscopically measured metallicities for 50 RR Lyrae stars. They found a very mild dependence on metallicity of the PL in the K band, and inferred from their near-IR PLKZ relation an LMC distance modulus of 18.53 ± 0.13 mag. They point out that their distance modulus relies on the trigonometric parallax of RR Lyrae itself. We will use these works as a reference in our studies of the near-infrared PLZ relation for the RR Lyrae stars that will be described in subsequent papers.
THE OUTER FIELDS OF THE LMC
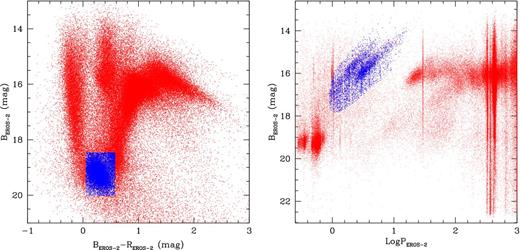
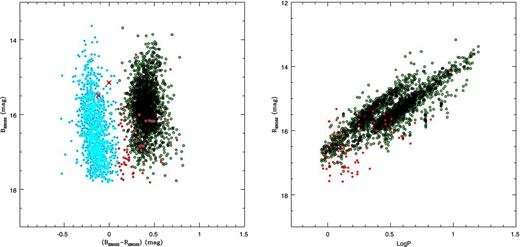
For the study of the variable stars in the outer fields of the LMC, which were not covered by OGLE III and for which the OGLE IV data are not available yet we are extensively using the EROS-2 data, kindly provided by the EROS collaboration in the form of lists of ‘candidate’ RR Lyrae stars and Cepheids, separately. The detection of variable stars in EROS-2 was performed by an automatic pipeline based on the Analysis of Variance (AoV) method and software developed by Beaulieu et al. (1997) and Schwarzenberg-Czerny (2003): stars with AoV statistics ≥20 were considered candidate variables (see Marquette et al. 2009 and references therein for further details). The left-hand panel of Fig. 6 shows the (BEROS, BEROS − REROS) CMD obtained from the EROS-2 catalogue of the LMC candidate variables (red points). The candidate RR Lyrae stars were extracted by selecting in this CMD objects with the 18.46 < BEROS < 20.03 mag, and 0.05 < BEROS − REROS < 0.58 mag (blue points). The selection of the CCs was based instead on the EROS-2 Period versus BEROS-magnitude diagram (see right-hand panel of Fig. 6) by considering objects with ∼13.39 < BEROS < ∼17.82 mag, and ∼0.89 < P < ∼15.85 d for the period (blue points).
Left-hand panel: BEROS, BEROS − REROS CMD of LMC candidate variable stars from the EROS-2 data (red points). A blue box marks the region populated by the RR Lyrae candidates; Right-hand panel: distribution of the EROS-2 candidate variables in the LMC (red points) in the LogP, BEROS plane. Blue points mark the candidate CCs.
These selection criteria returned a list of 16 337 candidate RR Lyrae stars and 5800 candidate Cepheids over the whole sky area covered by EROS-2 in the LMC.
Tile LMC 8_8: EROS-2 data
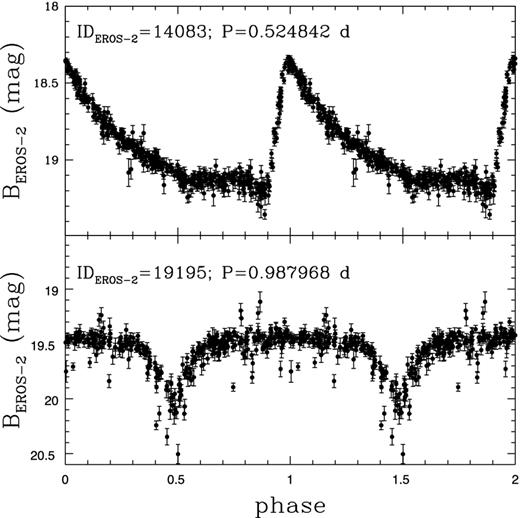
The EROS-2 candidate RR Lyrae stars and Cepheids in the SEP field were extracted by selecting from the EROS-2 catalogue objects that lie in the corresponding region (see Appendix for details). The selection returned a list of 14 CC candidates, all of which have a VMC counterpart, and 123 candidate RR Lyrae stars of which 122 have a VMC counterpart within 1 arcsec.7 To check classifications and periods, we studied the optical light curves of these objects with the GRaphical Analyser of TIme Series (gratis) package, custom software developed at the Bologna Observatory by P. Montegriffo (see e.g., Clementini et al. 2000). The visual inspection of the light curves allowed us to clean the samples of candidate RR Lyrae stars and Cepheids from spurious sources and to identify wrong periods, as for instance in the case of star IDEROS2 = lm0383l16657, for which PEROS-2 is twice the actual period. Fig. 7 shows the light curve of two sources classified as RR Lyrae candidates according to the selection criterion described above: a confirmed RR Lyrae star on the top, and a contaminant binary on the bottom. We checked the EROS-2 period (PEROS-2) and obtained our own period estimates (P|$_{\small {gratis}}$|) for all the EROS-2 candidate Cepheids and for a sub-sample of 24 RR Lyrae stars in the SEP field. We generally found a very good agreement between PEROS-2 and P|$_{\small {gratis}}$|, with difference, on average, on the fifth decimal place, thus we have adopted PEROS-2 for the remaining stars. Although we did not calculate P|$_{\small {gratis}}$| for all candidate RR Lyrae stars and Cepheids in the SEP field, we visually inspected the light curves of all of them using the gratis package and the PEROS-2 as input. With gratis, we also determined the epoch of maximum light for each BEROS-band light curve. This information was later used along with the period to fold the Ks-band light curves as described in R12a. The visual inspection of the light curves for 14 EROS-2 CC candidates in the SEP area, confirmed nine CCs: one fundamental-mode (F), seven first-overtone mode (FO), and one double-mode Cepheid, in agreement with results published in Marquette et al. (2009); three turned out to be eclipsing binaries (ECLs), and the remaining two were found to have very small amplitudes (of the order of about 0.1 mag in the EROS-2 bands and of 0.02–0.03 mag in the Ks band). Period and luminosity place these two stars in the Cepheid's domain, but their classification is uncertain (see Section 4.2). Final classification and period for the candidate Cepheids in the SEP tile are summarized in Table 2. On the other hand, the analysis with gratis revealed that the sample of 123 EROS-2 candidate RR Lyrae stars in the SEP field contained (see Table 3) 79 fundamental-mode (RRab), 23 first-overtone (RRc), 7 double-mode (RRd) RR Lyrae stars, 4 ECLs, 2 short period (‘s.p.’ in Table 3) variables with light curves similar to RR Lyrae stars but having shorter periods and bluer colours, one object with singular shape of the light curve (‘s.s.’ in Table 3) and 7 variables that according to EROS-2 have periods between 37 and 1103 d. The latter appear to have very noisy and often irregular light curves with BEROS within 19–20 mag, and period aliases of 0.33, 0.50 and 0.99 d. Some of these objects may indeed be long period variables, we flagged them as non-classified (‘n.c.’) objects in Table 3.
Upper panel: BEROS-band light curve of a confirmed fundamental mode RR Lyrae star in the SEP; Lower panel: Light curve of a binary system found among the sample of EROS-2 candidate RR Lyrae stars in the SEP field.
Counteridentification (VMC–OGLE IV–EROS-2) and properties of the Cepheids in the LMC 8_8 tile (SEP; see the text for details).
| VMC_ID . | OGLE IV_ID . | Type . | Mode . | POGLEIV . | EROS_ID . | PEROS . | Type . | Mode . |
|---|---|---|---|---|---|---|---|---|
| . | . | OGLE IV . | OGLE IV . | (d) . | . | (d) . | R12b+t.w. . | R12b+t.w. . |
| VMC-J055406.28−661228.2 | LMC563.21.27 | DCEP | F/FO | 3.419 44 | – | – | – | – |
| VMC-J055432.96−664223.0 | LMC563.04.13 | DCEP | FO | 4.9929 | – | – | – | – |
| VMC-J055530.29−660557.7 | LMC563.20.38 | DCEP | F | 3.870 411 | lm0507l6104 | 3.87046 | DCEP | F |
| VMC-J055555.41−663609.8 | LMC563.03.7925 | DCEP | FO | 1.481 971 | – | – | – | – |
| VMC-J055613.39−662234.0 | LMC563.10.6631 | DCEP | FO | 1.027 533 | lm0371k18509 | 1.027683 | DCEP | FO |
| VMC-J055635.79−654742.0 | LMC563.27.87 | DCEP | FO | 1.188 903 | lm0505n6123 | 1.188733 | DCEP | FO |
| VMC-J055638.35−660302.7 | LMC563.19.6609 | DCEP | FO | 1.214 799 | lm0507m20129 | 1.214786 | DCEP | FO |
| VMC-J055657.28−660732.0 | LMC563.19.84 | DCEP | FO | 0.863 285 | – | – | – | – |
| VMC-J055709.22−655129.4 | LMC563.27.66 | DCEP | FO | 0.841 186 | – | – | – | – |
| VMC-J055711.14−655116.0 | LMC563.27.67 | DCEP | FO | 1.044 417 | lm0505n10348 | 1.044436 | DCEP | FO |
| VMC-J055721.61−655125.6 | LMC563.27.27 | DCEP | 2O | 1.455 45 | – | – | – | – |
| VMC-J055922.16−665709.8 | LMC570.16.6654 | DCEP | FO | 1.683 923 | lm0382l10126 | 1.683674 | DCEP | FO |
| VMC-J055942.93−670346.8 | LMC562.26.40 | DCEP | FO | 1.907 626 | lm0384k15682 | 1.907595 | DCEP | FO |
| VMC-J060318.83−665244.3 | LMC570.14.6292 | DCEP | FO | 3.228 064 | lm0383l20185 | 3.227865 | DCEP | FO |
| VMC-J060415.65−663933.8 | LMC570.22.5193 | DCEP | FO | 0.879 84 | – | – | – | – |
| VMC-J060532.15−665638.4 | LMC570.12.6008 | DCEP | F | 3.083 327 | – | – | – | – |
| VMC-J060325.19−663124.4 | – | – | – | – | lm0381l13722 | 1.277076a | DCEP | F/FO |
| VMC-J055535.45−670217.3 | LMC562.29.61 | OTHER | Spots | 3.8280 | lm0375k12090 | 3.902331 | DCEP | n.c.b |
| VMC-J060117.37−665319.5 | LMC570.15.6150 | OTHER | Spots | 4.0807 | lm0382n17908 | 4.085779 | DCEP | n.c.b |
| VMC-J055924.79−662930.0 | LMC563.08.60 | ECL | – | 1.238 5056 | lm0380l11651 | 1.238489 | ECL | – |
| VMC-J055711.52−664418.6 | LMC563.02.523 | ECL | – | 1.207 677 | lm0373m20395 | 1.207672 | ECL | – |
| VMC-J055518.02−670541.2 | LMC562.29.97 | ECL | – | 2.158 649 | lm0375k19793 | 2.158691 | ECL | – |
| VMC-J060011.48−661037.3 | LMC571.06.49 | DCEP | FO | 1.904 68 | – | – | – | – |
| VMC-J060322.75−660145.9 | LMC571.04.5309 | DCEP | FO/2O | 0.708 377 | – | – | – | – |
| VMC-J060433.05−660915.3 | LMC571.04.11 | DCEP | FO | 4.857 46 | – | – | – | – |
aThe analysis of the EROS-2 light curves revealed that this is a double-mode Cepheid with a secondary period of 1.768 788 d, in good agreement with Marquette et al. (2009).
bThe periods and luminosities place these two variable stars in the Cepheid domain and thus they were classified as such in R12. However, the EROS-2 light curves show a very small amplitude of the order of about 0.1 mag.
Counteridentification (VMC–OGLE IV–EROS-2) and properties of the RR Lyrae stars in the VMC LMC 8_8 tile (SEP; see the text for details). This table is published in its entirety only in the electronic edition of the Journal.
| VMC_ID . | OGLE IV_ID . | Type . | P_OGLE IV . | EROS_ID . | Type . | P_EROS . |
|---|---|---|---|---|---|---|
| . | . | OGLE IV . | (d) . | . | This work . | (d) . |
| VMC-J055330.63−662350.3 | LMC563.12.1169 | RRab | 0.556 1077 | lm0370m20974 | RRab | 0.556178 |
| VMC-J055342.51−663748.3 | LMC563.04.8357 | RRab | 0.729 109 | lm0372m4284 | RRab | 0.729118 |
| VMC-J055346.14−662741.1 | LMC563.12.996 | RRc | 0.384 9272 | lm0370n8721 | RRc | 0.38492 |
| VMC-J055348.75−664012.1 | LMC563.04.8711 | RRab | 0.652 8193 | – | – | – |
| VMC-J055352.14−663543.3 | LMC563.04.8914 | RRc | 0.354 4958 | lm0370n10812 | RRc | 0.354487 |
| VMC-J055410.19−665926.6 | LMC562.30.1447 | RRab | 0.617 039 | lm0374m5838 | RRab | 0.617036 |
| VMC-J055419.33−662744.6 | LMC563.12.994 | RRab | 0.652 377 | lm0370n8898 | RRab | 0.652404 |
| VMC-J055421.20−662324.8 | LMC563.12.1192 | RRc | 0.331 3268 | lm0370m20171 | RRc | 0.331325 |
| VMC-J055431.93−670253.3 | LMC562.30.1223 | RRab | 0.505 9999 | lm0374m13678 | RRab | 0.505996 |
| VMC-J055433.20−664324.0 | LMC563.04.1161 | RRab | 0.640 376 | lm0372m13082 | RRab | 0.640384 |
aAccording to OGLE IV star LMC563.09.6173 is a Galactic RR Lyrae star.
bEROS-2 period of the star is 1.328 165 d, which is an alias of the actual period. For this star, we list in the PEROS column the period of 0.664 0825 d we derived from our analysis of the star light curve with gratis.
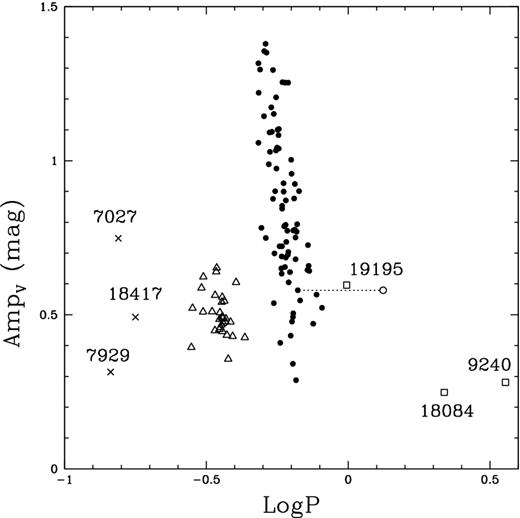
LogP < −0.6 and LogP > 0.2 – the analysis of the light curves revealed that the former are short period variables (black crosses; flags s.p. and s.s. in Table 3) and the latter are ECLs (empty squares, ECL in Table 3);
−0.6 ≤ LogP ≤ −0.3 and AV ≤ 0.7 mag – these are first-overtone (RRc) RR Lyrae stars (empty triangles);
−0.3 ≃ LogP ≃ 0.1 – these are fundamental mode (RRab) RR Lyrae stars (filled points).
Period-amplitude diagram in the V band of the EROS-2 candidate RR Lyrae stars in the SEP field. Objects deviating from the RRab (filled circles) and RRc (open triangles) distributions are short period variables (crosses), and ECLs (squares). An open circle marks an RRab star for which EROS-2 period is an alias. The star perfectly falls on the RRab distribution when the correct period, half of the EROS-2 value, is adopted.
The classification based on the period diagram fully confirms the classification obtained through the visual inspection of the light curves, and shows that this method can be successfully used to obtain a first check and classification of the EROS-2 candidate RR Lyrae stars, that can then be refined by visual inspection of the objects most deviating from the main distributions of RRc and RRab stars in the Bailey diagram. This is, in fact, the procedure we will adopt to analyse the sample of EROS-2 candidate RR Lyrae stars in the tiles covered only by EROS-2. Only two objects (namely, idEROS-2: lm0385k3074 P ∼ 0.40 d, and lm0507k.19195 P ∼ 0.99 d) are classified, respectively, as RRc and RRab by the LogP, AV diagram, but were found to be binary systems by the visual inspection of the light curves. This corresponds to a ∼ 2 per cent residual contamination.
To summarize, the final catalogue of bona-fide RR Lyrae stars identified in the portion of the SEP tile covered by EROS-2 includes 79 RRab, 23 RRc and 7 RRd variables for a total number of 109 confirmed RR Lyrae stars.
Tile LMC 8_8: comparison of the OGLE IV and EROS-2 data
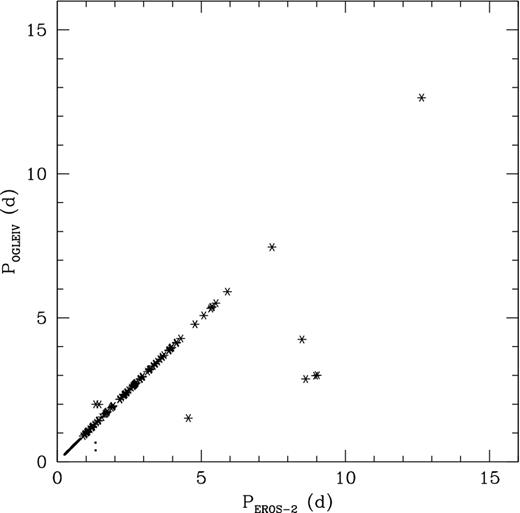
OGLE IV data for the variables in the SEP field were published by the OGLE team while we were writing this paper, thus making it possible for us to include them in our analysis. The so called GSEP field (cyan contours in Figs 4 and 5; Soszyński et al. 2012) is covered by four OGLE IV pointings and extends over a total area of about ∼ 5.3 deg2, of which the central one square degree corresponds to the region that Gaia will repeatedly observe during commissioning. The OGLE collaboration opted to make the GSEP field data available after only two years of observation because of the potential these data can have for the Gaia mission. The data set consists of V and I bands photometry for 6789 variable stars, with a number of data points between 338 and 351 in I, and about 29 epochs in V. The GSEP field sample includes 132 CCs, 686 RR Lyrae stars, 2819 LPVs, 1377 eclipsing variables, two supernovae and nine supernova candidates in the background sky. Tile LMC 8_8 is fully covered by the OGLE IV GSEP, of which it represents the central 1.2 square degrees (hence a portion corresponding to about 1/5 of the total GSEP area) and, according to OGLE IV, it contains 19 CCs, all having a VMC counterpart, and 223 RR Lyrae stars, of which 219 have a VMC counterpart (see columns 6 and 7 of Table 1). EROS-2 covers only 2/3 of tile LMC 8_8. In the portion where OGLE IV and EROS-2 data overlap, it is possible to compare directly the results obtained by the two microlensing surveys. Tables 2 and 3 provide the cross-identification (namely, OGLE IV and EROS-2 identification numbers) and summarize the properties of the Cepheids and RR Lyrae stars observed in this region in common between EROS-2 and OGLE IV. We also give in the tables the VMC identification number for all variables that have a VMC counterpart. The bottom part of each table gives instead the cross-identification between OGLE IV and VMC for Cepheids and RR Lyrae stars in the portion of tile LMC 8_8 that is not covered by EROS-2. In the region in common OGLE IV detected 16 CCs (all having a VMC counterpart), of which eight were detected also by EROS-2, that also identified in this area a further source (lmc0381l13722, VMC-J060325.19-663124.4) that we found to be a double-mode Cepheid with no counterpart in OGLE IV. In the common region, there are also two sources with very small amplitude that OGLE IV classified as ‘spotted stars’ while R12b classified as CCs according to their position in the infrared PL. Furthermore, in the common area OGLE IV identified 153 RR Lyrae stars, of which 151 have a counterpart in VMC, to compare with the 109 confirmed RR Lyrae stars detected in the same region by EROS-2. We also note that four of the 109 RR Lyrae stars for which we confirmed the EROS-2 classification do not have a counterpart in the OGLE IV catalogue of variable stars in the whole GSEP field (see Table 3). Fig. 9 shows the comparison between PEROS-2 and POGLEIV for 345 RR Lyrae (black points) stars and 94 CCs (black asterisk) in common between the two surveys in the GSEP area. There is general good agreement between the two period determinations, with only a few exceptions: LMC570.15.7157, LMC562.05.10232, LMC562.21.10078 (OGLE IV Ids); the F-mode CCs: LMC562.13.11358, LMC570.05.38, LMC562.05.9009, LMC562.04.66, LMC563.15.8125; and the FO mode CC: LMC562.27.37. For all of them POGLEIV is the correct value. For the F/FO mode CC LMC562.25.11257, and for the RRc star LMC562.02.8742 PEROS-2 and 0.5 × PEROS-2, respectively, better fit the EROS-2 data. Of these sources, only LMC570.15.7157 falls inside the VMC tile LMC 8_8.
Comparison between PEROS-2 and POGLEIV for RR Lyrae stars (points) and CCs (asterisk) in the OGLE IV GSEP area in common between the two surveys (see the text for details). Note that the errors on the periods are smaller than the point dimensions.
EROS-2 data in the VMC tile LMC 8_3
The tile LMC 8_8 field is not the best place to fine-tune the method of analysis of the CCs, because it contains too few Cepheids. Among the LMC outer tiles already completely observed and catalogued, tile LMC 8_3 hosts many CCs (see Table 1) and it is much better suited for this purpose. Furthermore, the lower portion of this tile is covered by the OGLE III survey (Fig. 5), making possible a direct comparison between the two surveys. The EROS-2 catalogues of tile LMC 8_3 contain, respectively, 310 candidate RR Lyrae stars and 201 candidate CCs. We analysed the optical light curves of all these sources with the gratis package. For the RR Lyrae stars we also used the LogP, AV diagram to refine our classification, as described at the end of Section 4.1, obtaining in turn a clean sample of 262 bona-fide RR Lyrae stars, of which 258 have a VMC counterpart within 1 arcsec. The visual inspection of the light curves of the 201 candidate Cepheids returned a sample of 126 bona-fide CCs of which 125 have a VMC counterpart within 1 arcsec.8 The EROS-2 sample contains also 58 binaries, 4 candidate LPVs, and 13 variables with very small amplitudes (generally around 0.1 mag or lower). As mentioned previously, OGLE III covers only the lower 1/4 of tile LMC 8_3 and identified 52 CCs, of which 36 are in common with EROS-2 and 16 do not have a counterpart in the EROS-2 catalogue of CC candidates; 4 of these 16 stars have a counterpart in the general catalogue of EROS-2 stars but were not classified as CC candidates. Thus, the total sample of CCs in this tile adds to 142, of which 141 have a counterpart in the VMC catalogue, corresponding to a 99 per cent completeness of the VMC survey with respect to the number of Cepheids identified by both EROS-2 and OGLE III.
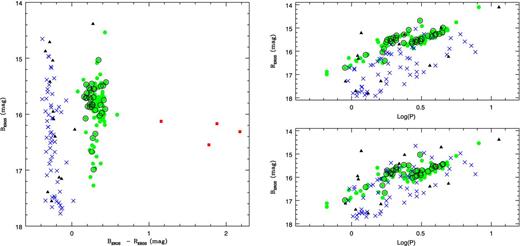
Tests performed on tiles LMC 8_3 and 8_8 show that the CC candidates selected by EROS-2 using the PL distribution in the right-hand panel of Fig. 6 are mainly contaminated by binaries. Based on this result, we have investigated whether we could find methods to clean the candidate Cepheid sample without checking visually all the light curves, and found that the EROS-2 CMD is well suited for the purpose, as also pointed out by Spano et al. (2011) in their Fig. 8. The left-hand panel of Fig. 10 shows the BEROS, BEROS − REROS CMD of EROS-2 CC candidates in the region corresponding to tile LMC 8_3. In the CMD sources classified as binary systems (ECLs) after visual inspection of the light curve are very well separated and definitely bluer (BEROS − REROS < 0.1 mag) than sources confirmed to be CCs (green points). Furthermore, both binaries and CCs appear to be constrained in small BEROS − REROS colour intervals in this tile. A number of small amplitude variables (black filled triangles in Fig. 10) also fall in the region occupied by the binaries. As suggested by the amplitudes smaller than 0.1 mag, the typical periods and the blue colours, they likely are a mixture of main sequence (MS) variables like β Cepheids, Be stars, slowly pulsating B variables (see, e.g. Baldacci et al. 2005 and references therein, for a description of the characteristics of these different types of MS variables). Four LPVs (filled red squares) also lie well apart, at colours redder than BEROS − REROS ∼ 1 mag in the CMD of Fig. 10. Spano et al. (2011) analysed light curves for 856 864 variable stars in the EROS-2 data base obtaining a final list of 43 551 LPVs in the LMC. We matched our catalogue of 5800 EROS-2 CC candidates against Spano et al.'s LPV catalogue and found 296 objects in common. All but one have colours BEROS-2 − REROS-2 > 1 mag. The 4 LPVs found in tile LMC 8_3 are all included in the catalogue of LPVs published by Spano et al. (2011). The LPVs observed by VMC will be studied further elsewhere.
Left-hand panel: BEROS, BEROS − REROS CMD of EROS-2 CC candidates in tile LMC 8_3. Blue crosses, green filled circles and black filled triangles represent binary systems, CCs, and small amplitude variables, respectively. Red filled squares are LPVs. Black empty circles are 36 CCs located in the lower portion of tile LMC 8_3 which is covered also by OGLE III, confirming their classification as CCs. Right-hand panel: PL relations in the REROS (upper right) and BEROS (lower right) bands of the EROS-2 CC candidates in tile LMC 8_3. LPVs were omitted. Symbols and colour coding are as in the left-hand panel. See the text for details.
The right-hand panel of Fig. 10 shows the PL relations in the REROS (upper panel) and BEROS (lower panel) bands of the EROS-2 CC candidates in tile LMC 8_3 (the LPVs have been omitted). The confirmed CCs are distributed along the two loci occupied by first-overtone and fundamental-mode pulsators, respectively. The binaries significantly contaminate the Cepheids’ BEROSPL, while appear to better separate from Cepheids in the REROSPL. Furthermore, the bona-fide Cepheids basically remain confined around their PLs with only a slightly larger dispersion of the BEROS–band relationship, the binaries and the vast majority of the small amplitude variables instead shift systematically away from the Cepheids going from the BEROS to the REROSPL and can thus easily be disentangled from Cepheids. In summary, by combining the information from the BEROS, BEROS − REROS CMD and the BEROS, REROSPLs it should be possible to separate quite easily bona-fide CCs from binaries and small amplitude variables.
Cleaning the LMC sample of EROS-2 CC candidates
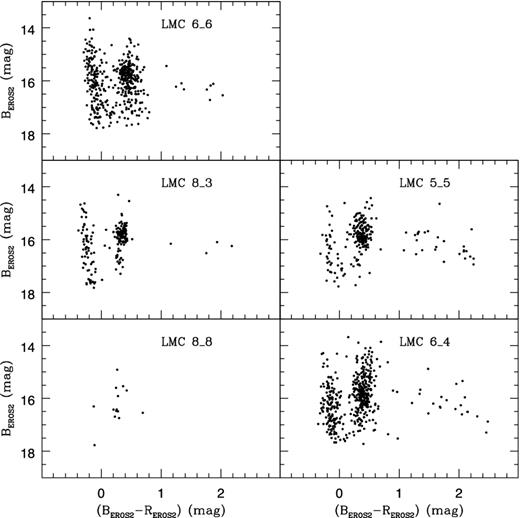
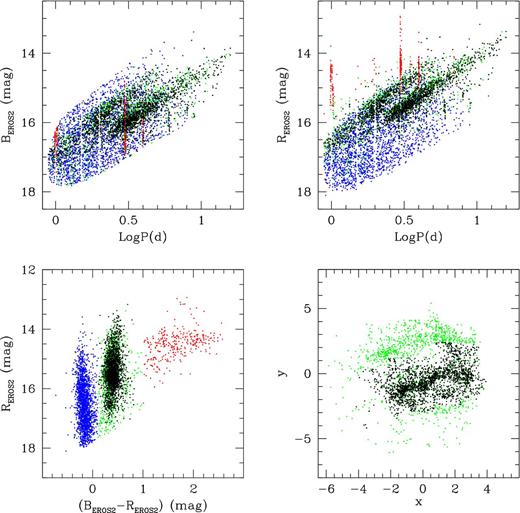
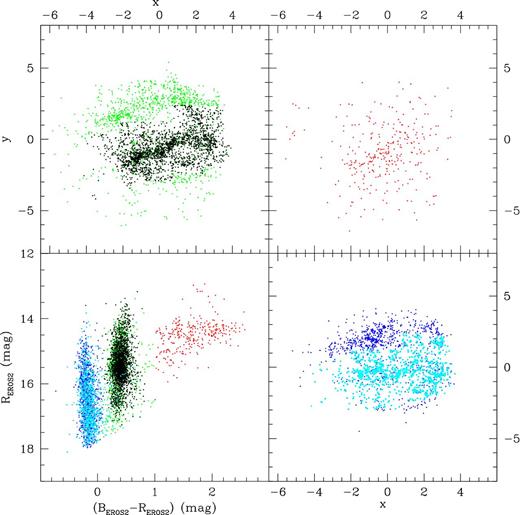
Fig. 11 shows the BEROS, BEROS − REROS CMD of the EROS-2 CC candidates in the five VMC LMC tiles completely catalogued as of 2013 July. The separation between binaries, Cepheids and LPVs is clearly visible in all tiles and, as expected, it is more clear-cut in the less crowded tiles. Furthermore, while the distributions of binaries and Cepheids remain sufficiently well separated, their mean colours are redder in tile LMC 6_6 (30 Dor) due to a large reddening. The range in luminosity spanned by the binaries in the tile LMC 6_6 also appears to be larger likely due to the presence of more massive binaries in this star-forming region. As a general rule, we expect that sources with 0.1 <(BEROS − REROS) < 1 mag are likely to be bona-fide CCs, sources with (BEROS − REROS) < 0.1 mag are likely to be binary systems, and sources with (BEROS − REROS) ≥ 1 mag are LPVs. According to the afore-mentioned colour-cuts out of the 5800 EROS-2 CC candidates in the LMC 3484 (60.1 per cent) very likely are bona-fide CCs, 2003 (34.5 per cent) likely are ECLs and 313 likely are LPVs. The results obtained with this procedure are shown in Fig. 12, where we have plotted in the lower-left panel the BEROS, BEROS − REROS CMD of the whole sample of EROS-2 CC candidates in the LMC using different colours for the different types of variables, and in the upper panels the corresponding BEROS, REROSPLs. Finally, the lower-right panel of Fig. 12 shows the sky distribution of the LMC CCs selected using the colour-cut in the CMD, they trace very clearly the LMC central bar as well as the overdensity of Cepheids above the bar (see Clementini 2011 and discussion in Section 6). However, we are aware that the above colour separations may sometimes be too crude and especially for tiles where the reddening is large and patchy, as for instance in tile LMC 6_6, there may be sources with colours between the two distributions that may as well belong to one or the other groups, and thus will need to be checked visually.
BEROS, BEROS − REROS CMDs of EROS-2 CC candidates in the five LMC tiles completely catalogued as of 2013 July 2013. Tile numbers are labelled. Clearly visible is the separation between binaries, Cepheids and LPVs.
Upper panels: PL relations in BEROS (left) and REROS (right) bands of the EROS-2 CC candidates in the LMC. Blue, green and red points mark, respectively, ECLs, CCs and LPVs, according to our colour-selection criteria. The LPVs fell accidentally in the sample due to the use of aliases of their actual periods (correct periods for these stars were published by Spano et al. 2011). Black points represent CCs in the central part of the LMC for which a firm classification is provided by OGLE III. Lower-left panel: REROS, BEROS − REROS CMD for EROS-2 candidate CCs in the LMC, colour-coding is the same as in the upper panels. Lower-right panel: sky distribution of EROS-2 and OGLE III Classical Cepheids in the LMC; colour-coding is the same as in the upper panels.
In order to better assess the robustness of our procedures and verify that the CCs selected on the basis of the colour-cuts in the CMD are no longer contaminated by spurious sources, we have compared our selection of the EROS-2 candidate CCs in the LMC with the OGLE III catalogues of CCs and ECLs in the central region of the LMC. The EROS-2 catalogue of LMC CC candidates contains a total number of about 5800 sources, this number reduces to 5487 if only objects with colour bluer than 1.0 mag are selected (i.e. after discarding the LPVs). Of these 5487 objects, 3484 have a counterpart in the OGLE III catalogues of CCs and ECLs when a pairing radius of 1 arcsec is adopted in the cross-match. Of the remaining 2003 sources without a counterpart in the OGLE III catalogues, roughly 1500 lie outside the FoV covered by OGLE III.
The left-hand panel of Fig. 13 shows the CMD (in the EROS-2 bands) of the 3484 objects with a counterpart in OGLE III. This sample contains 2357 CCs and 1062 binaries both according to the colour-cut criteria and the OGLE-III classification. There are only two objects (red crosses in Fig. 13) that we would classify as binaries based on their colour and are instead CCs according to OGLE III and the visual inspection of the light curves. These are stars lm0551n.20500 and lm0036k.8214 of the EROS catalogue, and correspond to OGLE-LMC-CEP-0962 and OGLE-LMC-CEP-2595, respectively. The latter has a very clean light curve, whereas OGLE-LMC-CEP-0962 has variable mean luminosity. As pointed out in the remarks of the OGLE III catalogue, the classification as CC is uncertain. On the other hand, there are 67 sources (red filled points in Fig. 13) that we have classified as Cepheids according to their colour that are instead binaries both according to OGLE III and the visual inspection of the EROS-2 light curves. This corresponds to a 3 per cent contamination of the Cepheid's sample. 33 of these binaries have colour between 0.1 and 0.2 mag, suggesting that stars with such colours need visual inspection to be properly classified.
Left-hand panel: CMD of the 3484 EROS-2 CC candidates that have a counterpart either in the CC or in the ECL OGLE III catalogues. Blue points represent EROS-2 CC candidates with colour BEROS-2 − REROS-2 < 0.1mag. Cyan circles represent EROS-2 CC candidates with an OGLE III counterpart classified as ECL. Green points represent EROS-2 CC candidates with colour 0.1 < (BEROS − REROS) < 1.0 mag. Black circles represent EROS-2 CC candidates with an OGLE III counterpart classified as CC. Red crosses mark two CCs, that fall in the region of the CMD mainly occupied by binaries. Red filled points are binaries falling in the region of the CMD prevalently occupied by Cepheids (67 objects). Right panel: PL in the REROS-2 band of the sources with 0.1 < (BEROS − REROS) < 1.0 mag.
The right-hand panel of Fig. 13 shows the PL in the REROS-2 band of the sources with 0.1 < (BEROS − REROS) < 1.0 mag. Clearly seen are two separate sequences formed by the fundamental and the first-overtone mode CCs. Part of the binaries that still contaminate the CC sample (red filled points) deviate quite significantly and can be eliminated with a sigma-clipping procedure. This would allow us to further reduce the residual 3 per cent contamination of the CC sample. In conclusion, the application of colour-cuts in the CMD appears to be a quite robust criterion that combined with the analysis of the scatter in the PL relations allows us to extract a sample of bona-fide CCs more than 97 per cent clean from contaminating sources. A 3 per cent contamination, in any case is not expected to affect significantly the CC PLK relations in regions where only the EROS-2 data are available.
Binaries among the EROS-2 CC candidates
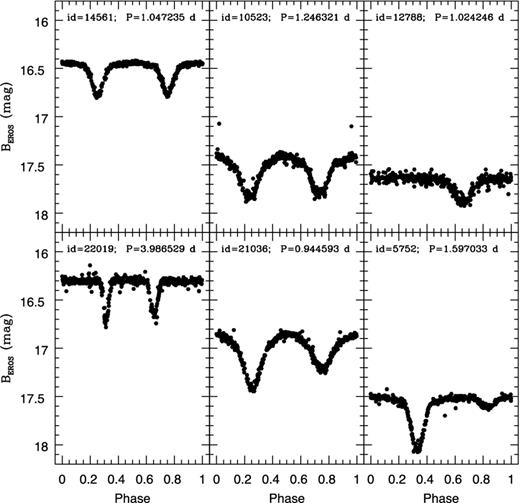
ECLs are binary stars where components undergo mutual eclipses. The light curves are characterized by periods of practically constant light with periodic drops in intensity during the eclipses. They can be contact, detached and semidetached binaries containing components of different types e.g., giants, dwarfs, MS stars and hence of different age, colours and magnitudes; for this reason they are not in general used as population tracers. The sample of ECLs contaminating the EROS-2 catalogue of CC candidates in the LMC appears to follow a PL relation similar to the Cepheid PL but with a higher dispersion (see Figs 6, 10 and 12). A few examples of light curves, for different types of binaries in our sample, are shown in Fig. 14. A common feature in spite of those binaries having rather different morphological types is their blue colour (BEROS-REROS < 0.1 mag), hence they appear to be systems formed by pairs of hot main sequence O, B stars; we then expect that these systems trace a young population with age ∼10 Myr (see discussion in Section 6). Their light curves often show the typical shape of a deformed surface (see, e.g. star 10523 in Fig. 14). To keep a star in contact with the critical lobe, at fixed mass ratio for increasing separation a larger star is needed; since these binaries are on an MS this implies a higher luminosity, hence there might be a relation between luminosity and period.
Typical light curves for different types of binaries contaminating the EROS-2 candidate CC sample.
In other cases, the light curve reveals a very eccentric detached system, as for instance in the case of star 22019 in Fig. 14, and one could make an attempt to compute the system eccentricity. Other light curves show what probably is a reflection effect around the secondary minimum, indicating a large temperature difference between the components. We defer a more detailed discussion of our particular sample of hot binaries to a further paper (Muraveva et al., in preparation) where we analyse and classify them using the Fourier parameters of the light curve decomposition.
COMPARISON WITH THE STAR FORMATION HISTORY RESULTS
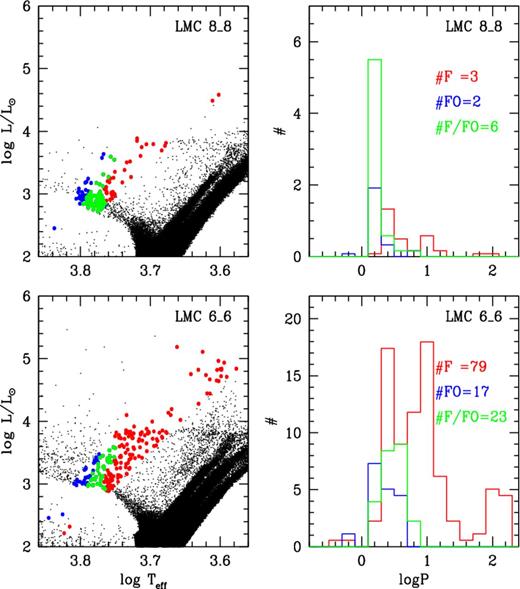
A comparison can be performed, on a tile-by-tile basis, of the properties and number density of the variable stars with the SFH recovered from the non-variable stars in the same tile. For instance, the SEP and 30 Dor regions differ significantly not only in terms of number and type of variables they contain but also in the properties of the parent non-variable stellar populations. According to the present analysis there are 19 CCs (14 FO, 2 F, 2 F/FO, 1 FO/2O and 1 2O) in the SEP tile, and 321 CCs in the 30 Dor region (of which 162 pulsate in the F mode, 136 pulsate in the FO, 8 are F/FO and 15 are FO/2O). Preliminary simulations indicate that the very different number of Cepheids in these two LMC fields can be explained by the significantly different SFH histories occurred in the SEP and 30 Dor regions. Using VMC data, Rubele et al. (2012) derive the SFH for 11/12 of the tile LMC 8_8, and for two small sub-regions of the tile LMC 6_6. They find that the tile LMC 8_8 has only a very tiny fraction of its star formation at ages younger than 200 Myr. This lack of young star formation explains the lack of F-mode Cepheids with periods longer than LogP = 0.6 in the SEP field, as well as their concentration at even smaller periods (see Fig. 15 upper panels). Filtering the best-fitting models from Rubele et al. (2012) with the theoretical Cepheid instability strips from Marconi, Fiorentino & Caputo (2004), we expect nine F and nine FO Cepheids in this tile; the numbers observed are certainly weighted more towards FO than predicted, but the total number is almost the same. The 30 Dor field instead is found to have a significant star formation activity at all recent ages, which explains the large numbers of Cepheids with large periods. If we extrapolate the SFH derived from the two small sub-regions to the entire 30 Dor tile, we find expected numbers of 103 and 39 for F and FO pulsators, respectively (see Fig. 15 lower panels). These numbers are smaller than the observed ones, especially for the FO Cepheids. We find a qualitative agreement between the observed period distributions, and those expected from the SFH analysis. Fewer Cepheids are predicted by the models, however, this could be due to the partial inactivity, for stars younger than 0.6 Gyr, of the regions studied in Rubele et al. (2012). These regions were selected for their low differential extinction but the average star formation rate for younger stars in 30 Dor is probably higher than those measured in the selected areas.
Results obtained from the SFH analysis in tiles LMC 8_8 (upper panels) and 6_6 (lower panels). Left-hand panels represent the syntethic CMD with red, blue and green points indicating F, FO and F/FO Classical Cepheids. Right-hand panels show the distribution of predicted Classical Cepheids with the period; colour coding as in left-hand panels.
SPATIAL DISTRIBUTION OF THE MAGELLANIC VARIABLE STARS
EROS-2 data
Fig. 16 shows the spatial distribution of the three main types of variables (CCs, binaries and LPVs) contained in our EROS-2 catalogue of candidate CCs in the LMC. They trace the spatial distribution of their parent populations, namely, a young population with the Cepheids (green points) and the hot binaries (blue points) and intermediate-age/old stars with the LPVs (red points). The LPVs, that accidentally fell in our sample (see Section 4.4), spread all over the EROS-2 FoV with a feeble overdensity in the internal regions; the whole catalogue of the EROS-2 LPV in the LMC is studied by Spano et al. (2011). Like the CCs, the hot ECLs are mainly concentrated towards the LMC bar, but show a more structured distribution than the CCs. These objects are indeed hot young MS stars, which are more clustered than CCs, and are located in the regions not occupied by CCs. This could suggest, that the distribution of hot binaries shows the places of recent (∼10 Myr) star formation activity. Furthermore, investigation about this issue will be developed in a forthcoming paper (Muraveva et al., in preparation).
Lower-left panel: (REROS, BEROS − REROS) CMD of the EROS-2 CC candidates in the LMC. Blue, green and red circles indicate respectively hot ECLs, CCs and LPVs, according to our colour selection criteria (see the text for details). Upper-left panel: spatial distribution of the CCs; upper-right panel: distribution of the LPVs and binary systems (lower-right panel) that contaminate the list of EROS-2 CC candidates in the LMC. x and y are related to α and δ according to equations described in the Appendix.
EROS-2, OGLE III and OGLE IV data
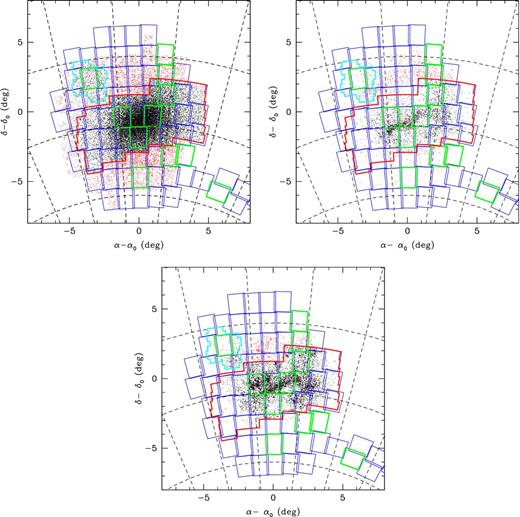
Finally, in Fig. 17 we compare the structure of the LMC as traced by RR Lyrae stars (upper-left panel), CCs (upper-right panel) and hot ECLs (lower panel) obtained by combining results for the LMC variables from the OGLE (black points; Soszyński et al. 2008, 2009, 2012), and the EROS-2 surveys (red points; see Section 4). To extract the sub-set of hot binaries from OGLE III general catalogue of ECLs (Graczyk et al. 2011), we first cross-matched the EROS-2 hot binaries against OGLE ECL catalogue. In this way, we could define the region occupied by the hot ECLs in the (V, V-I) plane, this corresponds to sources with V magnitudes in the range of 12.5–18.5 mag and V − I colours in the range of −0.35–0.4 mag.
Distribution of bona-fide RR Lyrae stars (upper-left), CCs (upper-right) and hot ECLs (lower-left) in the LMC, according to the OGLE III, OGLE IV and EROS-2 surveys. Black points represent sources with OGLE data; red points represent EROS-2 confirmed variables of the three different types that do not have an OGLE counterpart within 5 arcsec. α0 = 81| $_{.}^{\circ}$|0 and δ0 = −69| $_{.}^{\circ}$|0. Contours are colour coded as in Fig. 4. Green rectangles underlines tiles already observed as of 2013 July.
These distributions appear to be significantly different. This is not surprising given the different stellar populations traced by these types of variables (see Introduction). The RR Lyrae stars have a larger density in the central region of the LMC; however, they are still present in the peripheral areas covered almost exclusively by EROS-2. Their distribution is smooth and likely traces the LMC halo. On the contrary, both the CCs and ECLs are strongly concentrated towards the LMC bar and seem to almost disappear moving outside the region covered by the OGLE III observations (red contour). Fig. 17 shows that the two distributions appear remarkably similar but that, as one would expect from Galactic examples, the hot young massive binaries are more sharply concentrated towards the most recent areas of star formation; in particular the overdensity of hot binaries near the 30 Dor region, does not have a counterpart in the CC distribution. EROS-2, having a much larger coverage of the LMC than OGLE III, further highlights the difference between RR Lyrae star and Cepheid distributions and also reveals a feature not captured by OGLE III because of the smaller FoV: as already noted in Clementini (2011) based on a preliminary analysis of the EROS-2 data, the distribution of the EROS-2 Cepheids clearly confirms the existence in the LMC of an overdensity of CCs displaced about 2° above the central bar, and running almost parallel to it, to which it connects at its western edge. Evidences for an overdensity of CCs above the main bar of the LMC were already known from the studies of Schmidt-Kaler (1977) which were based on observations of the LMC CCs by Payne-Gaposchkin (1974) (see fig. 11 in Schmidt-Kaler 1977) and, more recently, by Nikolaev et al. (2004) whose study is based on the MACHO survey sample of LMC CCs (see fig. 1 of Nikolaev et al. 2004). They are interpreted as the signature of a north-west spiral arm of the LMC. The distribution of CCs in the OGLE IV GSEP field (cyan contours in Fig. 17) also shows an increase in the south-eastern part of the field, confirming the overdensity of Cepheids highlighted by the EROS-2 data (Clementini 2011). A similar overdensity is also seen in the distribution of extended objects (star clusters and associations) in the MCs (Bica et al. 2008 and references therein). We expect that the VMC data, combined with the microlensing data, both EROS-2 and the forthcoming OGLE IV, will allow us to revisit and fully characterize this feature by better measuring its location and displacement along the line of sight by means of our PL relations based on multi-epoch Ks data. This will provide stronger constraints on the theoretical models of the LMC structure as well as of the MS formation since the LMC central bar and the Cepheids’ overdensity above may be dynamical features that do not resemble classical bars/spiral arms found in spiral galaxies.
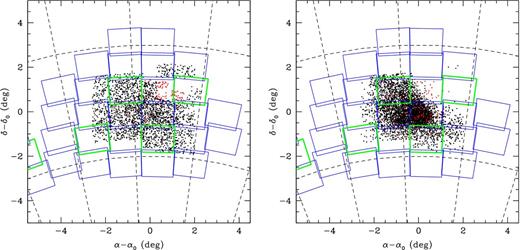
For completeness, Fig. 18 shows the distribution of OGLE (black points) and EROS-2 (red points) variables in the SMC area. As in the LMC, the CCs (right-hand panel) are more clustered in the central part of the galaxy, while the RR Lyrae stars (left-hand panel) are more homogeneously distributed, although projection effects make evidence less clear-cut than in the LMC. On the other hand, in the SMC the number of CCs (4630 according to OGLE III) is about twice the number of RR Lyrae stars (2475). This is consistent with the larger gas content and more recent star formation in the SMC compared to the LMC.
Same as Fig. 17 but for the RR Lyrae stars (left-hand panel) and CC (right-hand panel) in the SMC where α0 = 12| $_{.}^{\circ}$|5 and δ0 = −73| $_{.}^{\circ}$|0.
At present no optical data are available for the area corresponding to the Bridge between the two Clouds. However, both STEP@VST and OGLE IV have already observed the Bridge area and discovered there both RR Lyrae stars and Cepheids. Analysis of the light curves and a full characterization of the variable stars in these tiles is in progress.
SUMMARY AND CONCLUSIONS
We have presented the strategy we are applying to the visual and near-infrared data of RR Lyrae stars and Cepheids in the MS that are being observed by the VMC survey. In particular, we have presented the properties of the VMC data for RR Lyrae and CCs in some already observed fields showing examples of light curve and describing the data acquisition. We compared the optical (EROS-2, OGLE III and OGLE IV) and infrared (VMC) data in five LMC fields studying the completeness of the VMC survey with respect to the optical catalogues. We analysed the optical light curves for CC and RR Lyrae stars in the tile LMC 8_8 using both the EROS-2 and OGLE IV data. Comparison between the expected numbers of CC from the SFH studies and the observed data is performed in two LMC tiles. Finally, we compared the distribution in RA and Dec. of both variable stars. The analysis described in this paper clearly shows that RR Lyrae stars and Cepheids sample regions (halo, bar, spiral arms) of the MS that are differently located in space. We are now reaching the level of accuracy and detail to disentangle the fine structure of the MS and thus separate systematics from geometrical effects that influence these primary indicators of the cosmic distance ladder.
MIM thanks the Royal Astronomical Society and the University of Bologna for grants to spend five months at the University of Hertfordshire during the spring-summer 2010. C. Maceroni and M. Cignoni are warmly thanked for their help with the interpretation of the binaries contaminating the Cepheid sample. MIM wishes to thank S. Leccia, R. Molinaro and F. Cusano, for useful scientific and technical discussions and Radek Poleski for his comments and suggestions. This work made use of EROS-2 data, which were kindly provided by the EROS collaboration. The EROS (Expérience pour la Recherche d'Objets Sombres) project was funded by the CEA and the IN2P3 and INSU CNRS institutes. We acknowledge the OGLE team for making public their catalogues. We thank the UKs VDFS comprising the VISTA pipeline at the Cambridge Astronomy Survey Unit (CASU) and the VISTA Science Archive at Wide Field Astronomy Unit (Ed- inburgh) (WFAU) for providing calibrated data products under the support of the STFC. Financial support for this work was provided by PRIN-INAF 2008 (P.I. M. Marconi) and by COFIS ASI- INAF I/016/07/0 (P.I. M. Tosi). RdG acknowledges partial research support from the National Natural Science Foundation of China (NSFC) through grant 11073001. R.G. is a Post-doctoral Fellow – Pegasus of the Fonds Wetenschappelijk Onderzoek (FWO) – Flanders.
Based on observations made with VISTA at ESO under programme ID 179.B-2003.
Research Fellow of the Alexander von Humboldt Foundation.
The ensemble of 16 non-contiguous images of the sky produced by an observation with the VISTA IR camera (Emerson & Sutherland 2010) is called ‘pawprint’. A ‘tile’ is instead a filled area of the sky fully sampled by combining six offset pawprints.
Typical average luminosities of the RR Lyrae stars are 〈Ks〉 ∼ 18 mag and 18.2 mag in the LMC and SMC, respectively.
The only missing star has a possible VMC counterpart at distance ∼1.7 arcsec, which appears to be a blend after visual inspection of the VMC images.
The candidate CC IdEROS-2 = lm0310k4094 lies 1.1968657 arcsec from a possible VMC counterpart, and the comparison of Ks and EROS-2 optical light curves confirms the star counteridentification.
REFERENCES
APPENDIX A
SUPPORTING INFORMATION
Additional Supporting Information may be found in the online version of this article:
Table 3. Counteridentification (VMC–OGLE IV–EROS-2) and properties of the RR Lyrae stars in the VMC LMC 8_8 tile (SEP; see the text for details) (Supplementary Data).
Please note: Oxford University Press are not responsible for the content or functionality of any supporting materials supplied by the authors. Any queries (other than missing material) should be directed to the corresponding author for the article.


