


Abstract
In this study we present three-dimensional radiative cooling hydrodynamical simulations of galactic winds generated particularly in M82-like starburst galaxies. We have considered intermittent winds induced by supernova (SN) explosions within super star clusters randomly distributed (in space and time) in the central region of the galaxy (within a radius of R = 150 pc) and were able to reproduce the observed M82 wind conditions with its complex morphological outflow structure. We have found that the environmental conditions in the disc in the nearly recent past are crucial to determine whether the wind will develop a large-scale rich filamentary structure, as in M82 wind, or not. If a sufficiently large number of super stellar clusters are built up in a starburst mainly over a period of a few million years, then the simulations reproduce the multiphase gas observed in M82-like winds, i.e. with filaments of sizes about 20–300 pc, velocities of ∼200–500 km s−1, densities in the range 10−1–10 cm−3, embedded in a hot, low-density gas with a density smaller than 10−2 cm−3 and a velocity of ∼2000 km s−1. Otherwise, a ‘superbubble-like’ wind develops, with very poor or no cold filamentary structures. Also, the numerical evolution of the SN ejecta has allowed us to obtain the abundance distribution over the first ∼3 kpc extension of the wind and we have found that the SN explosions change significantly the metallicity only of the hot, low-density wind component for which we obtained abundances ∼5–10 Z⊙ in fair consistency with the observations. Moreover, we have found that the SN-driven wind transports to outside the disc large amounts of energy, momentum and gas, but the more massive high-density component reaches only intermediate altitudes smaller than 1.5 kpc. Therefore, no significant amounts of gas mass are lost to the intergalactic medium and the mass evolution of the galaxy is not much affected by the starburst events occurring in the nuclear region.
1 INTRODUCTION
The evolution of the interstellar medium (ISM) at galactic scales depends on the stellar feedback at the larger scales, and vice versa. In fact, massive stars exert a profound influence over the baryonic component of the galaxy. At the same time, the collective effect of supernova (SN) explosions, stellar winds and radiation pressure may drive galactic winds (GWs; see e.g. Mathews & Baker 1971; Heckman, Armus & Miley 1990; Veilleux, Cecil & Bland-Hawthorn 2005). GWs influence the multiphase conditions of the ISM (McKee 1995) as well as the dynamical and chemical evolution of the galaxy and the thermodynamics and enrichment of the intergalactic medium (IGM; see e.g. Heckman et al. 1990; Shapiro, Giroux & Babul 1994; Aguirre et al. 2001). They are particularly important for starburst (SB) galaxies whose intrinsically large star formation rate (SFR) provides the perfect environment for gas outflow to develop.
There has been an extensive investigation in the literature on SB GWs (see below). Our aim here is to extend these studies exploring the evolution of these winds in the surrounds of the galaxy. We will address questions which are not yet clearly understood such as: (i) how does the feedback of the stars of the nuclear region shape the wind? (ii) how much mass is thermally driven? (iii) how are the different phases of the gas connected? (iv) what is the fraction of cold structures built up in the winds? and (v) how does the GW impact the chemical evolution of the galaxy? In order to try to answer these questions, we have adopted the galaxy M82 as a reference to obtain appropriate initial conditions, although the results here presented may be applied to other GWs and outflows in general.
M82 is an SB galaxy, located at about 3.9 Mpc away, with a disc of radius ∼5 kpc and mass ∼1010 M⊙. Although this galaxy has been classified as an irregular type II, several observations (Mayya, Carrasco & Luna 2005; Barker, de Grijs & Cerviño 2008; Strickland & Heckman 2009) revealed the presence of a bar (∼1 kpc) and spiral arms (observed in near-infrared). The main feature of this galaxy is a GW with filamentary structures extending up to ∼3 kpc above the disc and an Hα cap, i.e. a large nebular surrounding feature probably associated with the wind, at a height of about 10 kpc (Devine & Bally 1999; Lehnert, Heckman & Weaver 1999; Engelbracht et al. 2006; Strickland & Heckman 2009). Many studies indicate that this galaxy has experienced a tidal interaction with the spiral galaxy M81, resulting in a large amount of gas that is being piped into M82's core over the last ∼200 Myr. The most recent and important interaction was happened ∼2–5 × 10⁸ yr ago, causing an intense SB which lasted about 50 Myr with an SFR of ∼10 M⊙ yr−1. Then two more subsequent SBs occurred, and the last one (about 4–6 Myr ago) may have formed at least one of the observed largest central star clusters (Barker et al. 2008).
The SB region in the core of M82 has a diameter of ∼1 kpc and is optically defined by portions with high surface brightness labelled A, C, D and E by O’Connell & Mangano (1978). These regions correspond to sources of X-rays, infrared and radio emission. The bipolar GW seems to be concentrated within A and C regions and is possibly being driven mostly by SN energy injections. The SFR leads to a current SN rate of ≥0.1 yr−1. The central region has a mass of ∼7 × 10⁸ M⊙, pressure of ≥10−9 dyne cm−2, temperature of ∼104–106 K and densities of ∼103–104 cm−3 (Cottrell 1977; O’Connell & Mangano 1978; Schaaf et al. 1989; Westmoquette et al. 2007, 2009a). The SNe inject mass and energy at rates of ∼1 M⊙ yr−1 and ∼2 × 1042 erg s−1, respectively (Strickland & Heckman 2009). Recent observations revealed that within a radius of 500 pc there are about 200 super stellar clusters (SSCs) with an average size of ∼5.7 pc and mass (of stars) between 104 and 106 M⊙ (Melo et al. 2005). The projected separation between each of the young SSCs is smaller than 30 pc, with a minimum value of 5 pc and a mean separation of ∼12 pc. The density of young SSCs is very high in the M82 SB galaxy, with a global value inferred by Melo et al. (2005) of 620 kpc−2, about six times larger than that observed in the nuclear regions of other SB galaxies (see e.g. NGC 253; Watson et al. 1996). The 20 brightest clusters have ages of ∼5–10 × 106 yr (McCrady, Gilbert & Graham 2003; Strickland & Heckman 2009).
The bipolar wind of M82 galaxy has a conical geometry with a total opening angle of ∼30° (Ranalli et al. 2008). It has an X-ray luminosity of ∼1040 erg s−1, temperatures between ∼10 and 108 K (including the diffuse and warm material, dust and molecular gas) and a maximum velocity of the cold filaments (perpendicular to the disc) of ∼600 km s−1.
The cold and hot gas metallicities in M82 are uncertain. Optical and infrared observations suggest for the cold gas a solar metal abundance, while the X-ray observations give an abundance for the hot gas ≤ one-third the solar value (Strickland & Stevens 2000).
To understand the complexity of M82-like GWs, many analytical and numerical two- and three-dimensional studies were performed, most of which were applied to M82 itself (Chevalier & Clegg 1985; Tenorio-Tagle & Munoz-Tunon 1998; Strickland & Stevens 2000; Tenorio-Tagle, Silich & Muñoz-Tuñón 2003; Cooper et al. 2008; Rodríguez-González et al. 2008b; Strickland & Heckman 2009). Chevalier & Clegg (1985) were the first authors to propose a simple analytical model of a steady and adiabatic wind for M82. The same model was later revisited by several authors considering the radiative losses of the ejected gas with simplified assumptions. Tenorio-Tagle & Munoz-Tunon (1998) performed two-dimensional simulations of a biconical wind with radiative cooling, considering accreted matter from the external environment in order to determine the minimum mass of stars and gas in the SB that was needed to offset the accreted material. Strickland & Stevens (2000) and, more recently, Strickland & Heckman (2009), helped by two-dimensional axisymmetric simulations, studied the dependence of the wind dynamics, morphology and X-ray emission with the distribution of the ISM and the star formation (SF) history in the SB regions and studied also the distribution of the matter in dense clouds. Their results indicated that GWs, although efficient at transporting large amounts of energy to outside of the galaxies, are inefficient at transporting mass. Tenorio-Tagle et al. (2003) investigated also by means of two-dimensional simulations the formation of filaments in a wind driven by SNe from several star clusters, while Cooper et al. (2008) used three-dimensional (3D) simulations to study for the first time the formation of the wind in an inhomogeneous disc. They found that the presence of an inhomogeneous ISM in the disc may have an important effect on the morphology of the wind itself and on the distribution of the filaments. Finally, Rodríguez-González et al. (2008a,b) also by means of 3D simulations have modelled the filaments in a GW as the result of the interaction between the winds from a distribution of SSCs and derived the condition necessary for producing a radiative interaction between the cluster winds, as in M82. In general, all these numerical studies indicate a coexistence in the wind of a low-density, high-temperature gas which expands freely and occupies a large volume with a cooler gas (with a filamentary structure which emits Hα lines) that expands more slowly and occupies a small fraction of the total volume. These models also predict a velocity for the hot phase (T ≤ 108 K and n ≥ 10−4 cm−3) of ∼1000–2240 km s−1, and for the cold phase (T ≤ 104 K and n < 102 cm−3) of ∼600 km s−1, in agreement with the observations.
In this paper, these previous analyses will be extended through a detailed numerical study of an SN-driven M82-like wind in the surrounds of the ejection region of the galaxy. We perform fully 3D hydrodynamical simulations with radiative cooling in a gas in collisional ionization equilibrium. The cooling function is computed taking into account the metal abundances both in the ISM and in the SN ejecta. As in the previous studies of Tenorio-Tagle & Munoz-Tunon (1998), Tenorio-Tagle et al. (2003) and Rodríguez-González et al. (2008b), in our model the wind is generated by the ejected energy of the SNe hosted in the SSCs which are randomly distributed in time and space within a nuclear region of radius 150 pc. However, in contrast to those studies, we employ a 3D galactic disc geometry with a multiphase stratified and rotating ISM which is particularly important to assess realistically the multiphase complex wind's non-axisymmetric structures. Furthermore, with a more realistic treatment of the gas radiative cooling we will be able to track the formation, evolution and stability of the dense and cold structures (filaments), which are formed as a result of the interactions between the dense radiatively cooled shells of the several supernova remnants (SNRs) generated in the SB, and coexisting in equilibrium with the high-temperature, low-density wind component, as well as to determine more appropriately the fraction of the whole volume of the wind which is occupied by this cold phase. Also, the evolution of the SN ejected matter (which is traced by a separated continuity equation as a passive scalar) will allow us to obtain for the first time in numerical simulations of GWs important information on the chemical evolution, as well as of the Hα and the soft X-ray emission of the wind, and the metal contamination of the IGM due to the wind itself.
In the following sections we will outline the main characteristics of our model (Section 2) and the results obtained from the numerical simulations, mostly highlighting the formation process of the filaments, the chemical evolution of the wind and the distribution of the most abundant species outside of the disc (Section 3). Finally, in Section 4 we will present a brief discussion and draw our conclusions, and in Section 5 a summary of the main results found in this work.
2 THE MODEL
2.1 Setup for an M82-like SB wind
Parameters for the galaxy setup obtained from M82.
| Mstar | Mdisc | ω0 | a | b | cs, T, disc | cs, T, halo | erot | zrot | ρdisc, 0 | ρhalo, 0 |
|---|---|---|---|---|---|---|---|---|---|---|
| (M⊙) | (M⊙) | (pc) | (pc) | (pc) | (cm s−1) | (cm s−1) | (kpc) | (cm−3) | (cm−3) | |
| 2 × 10⁸ | 2 × 10⁹ | 350 | 222 | 75 | 30 × 105 | 300 × 105 | 0.95 | 5 | 20 | 2 × 10⁻³ |
2.2 Energy injection
The SB activity in M82 is centred in the nuclear region with a diameter of ∼500 pc. As described above, within this region there are a number of prominent and high-surface-brightness clumps containing hundreds of young massive SSCs (O’Connell et al. 1995; Melo et al. 2005). In our study we assume that the kpc-scale bipolar superwind observed in different wavelengths (Shopbell & Bland-Hawthorn 1998; Stevens & Hartwell 2003; Strickland & Heckman 2007) is driven by the SN explosions occurring in the SSCs, and that the total luminosity injected into the ISM is |$\sum _1^{\cal N_{\rm SSC}} L_i= 10^{42}$| erg s−1, where Li is the luminosity of a single SSC and |${\cal N}_{\rm ssc}$| is the total number of SSCs. We also assume that |${\cal N}_{\rm ssc}$| ranges between a minimum of 10 and a maximum of 100 and consider an inner nuclear region within a radius (RSB) of 150 pc where this activity takes place. We further consider that the total number of SSCs may be formed in an SF process along 1 or 10 Myr, depending on the model. Therefore, for each cluster we assume an average luminosity of |$L_i = 10^{42}/{\cal N}_{\rm ssc}$| erg s−1, and since every SN injects E0 = 1051 erg, we have |${\cal N}_{{\rm SN},{\rm c}} = 10^{42}(t_{\rm b}/E_0 {\cal N}_{\rm ssc}) = 10^6/{\cal N}_{\rm ssc}$|, where |${\cal N}_{{\rm SN},{\rm c}}$| is the total number of SNe per cluster, and where we assume that each single cluster is formed in an instantaneous burst which is characterized by SN activity occurring over a time of tb = 30 Myr (i.e. the lifetime of the less massive SN II progenitor star) and by an SN heating efficiency of HE = 100 per cent (Melioli & de Gouveia Dal Pino 2004), where the heating efficiency, HE, corresponds to the fraction of the SN explosion energy that remains effectively stored in the ISM gas (as kinetic and thermal energies) and is not radiated away.1 Therefore, an SSC injects mass and energy at rates of |$\dot{M} = M_{\rm ej}$||$10^{42}/(E_0 {\cal N}_{\rm ssc}$|) and |$L_{\rm w} = 10^{42}/{\cal N}_{\rm ssc}$|, respectively, where Mej= 16 M⊙ is the mean mass released by a single SN explosion. According to Marcolini et al. (2007), we also assume that each SN explosion injects 3 M⊙ of metals into the ISM. Finally, to set the clusters spatially and temporally within the core of the galaxy, we associate randomly with each ith cluster a position Pi = (ri, ϕi), where 0 < ri < 150 pc and 0 < ϕi < 2π, and a time ti in the range 0 < ti < 1 Myr or 0 < ti < 10 Myr depending on the model.
A summary of all the parameters adopted for the intermittent wind models studied here is given in Table 2 and Fig. 1 shows histograms representing the number of SN explosions during the first 10 Myr for each model.
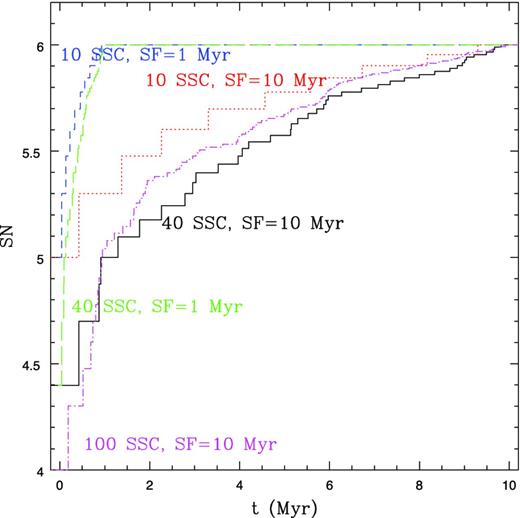
Number of SN explosions in the first 10 Myr for each model. Solid (black) line: SC40-10; dashed (blue) line: SC10-01; long-dashed (green) line: SC40-01; dotted (red) line: SC10-10 and dot-dashed (magenta) line: SC100-10.
Wind parameters used in our hydrodynamic simulations for five different models. For each model, (a) number of SSCs, (b) duration of the SF process (in Myr), (c) injected luminosity per SSC (in erg s−1), (d) injected matter per SSC (in M⊙ yr−1), (e) total energy injected after the first 5 Myr (in units of 1055 erg) and (f) physical dimensions of the box (in kpc).
| Model | No. of SSCs | SF (Myr) | |$\dot{E}$|/SSC (erg s−1) | |$\dot{M}$|/SSC (M⊙ yr−1) | E5 (1055 erg) | Box size (kpc) |
|---|---|---|---|---|---|---|
| SC10-10 | 10 | 10 | 1041 | 5 × 10⁻² | 3.2 | 1.5 × 1.5 × 1.5 |
| SC10-01 | 10 | 1 | 1041 | 5 × 10⁻² | 7.3 | 1.5 × 1.5 × 1.5 |
| SC40-10 | 40 | 10 | 2.5 × 1040 | 1.25 × 10⁻² | 1.6 | 1.5 × 1.5 × 1.5 |
| SC40-01 | 40 | 1 | 2.5 × 1040 | 1.25 × 10⁻² | 7.2 | 1.5 × 1.5 × 3.0 |
| SC100-10 | 100 | 10 | 1040 | 5 × 10⁻³ | 2.1 | 1.5 × 1.5 × 1.5 |
2.3 Numerical methodology
To simulate the evolution of the superwind driven by SN explosions in an M82-like SB galaxy, we use a modified version of the numerical adaptive mesh refinement hydrodynamical code yguazu (Raga, Navarro-González & Villagrán-Muniz 2000; Raga et al. 2002; Melioli et al. 2008, 2009) that integrates the gas dynamic equations with the flux vector splitting algorithm of Van Leer (1982). It also includes a parametrized cooling function in the energy equation that allows the gas to cool from ∼107.5 to 104 K with errors smaller than 10 per cent and which is calculated implicitly in each time step for each grid position. The 3D binary, hierarchical computational grid is structured with a base grid and with a number of nested grids whose resolution doubles going from one level to the next one. We have run the models with a maximum resolution of 5.8 pc per cell.2 For one model (SC40-01), which we take as the reference model, we have adopted five grid levels covering a box with physical dimensions of 1.5 × 1.5 × 3.0 kpc in the x, y and z directions, respectively, while for all the remaining models we have considered a box with physical dimensions of 1.5 × 1.5 × 1.5 kpc. The maximum dimensions of the computational domain for each model are also presented in Table 2. The energy associated with each SSC is injected as thermal energy in a single cell of the highest grid level of the box. In order to account for the metal abundance injected by the SN explosions into the system, we have introduced an extra separated continuity equation into the code in the form dρz/dt + ∇ · (ρzv) = Sz, where ρz is the metal density and Sz is the SN metal source. This also allows us to easily track the metallicity evolution in the wind.
3 RESULTS
In this section we present the results for the different models listed in Table 2, exploring a set of SSC parameters aiming mostly at the examination of the injected energy, the multiphase ISM and the chemical evolution of the system. All the models, except the reference one (SC40-01), were evolved for 5 Myr right after the first stars in an SSC (with masses 120 M⊙) have begun to explode, which is an appropriate time to investigate the global properties of the wind build-up, from the first SN explosions up to a nearly steady-state phase reached after ∼3.5 Myr. The reference model, instead, was evolved for 8.5 Myr, in order to follow the gas outflow evolution up to a height of 3 kpc. The results here obtained may be directly compared with observations of GWs in order to determine, for instance, the best set of initial conditions able to drive their outflows.
Table 3 summarizes the global energy budget for all the models after the reference times t = 3.5 and 5 Myr. These energies will help us to understand the wind evolution in the discussion below.
Energy budget (in units of 1055 erg) at t = 3.5 Myr (E3.5) and t = 5 Myr (E5). For each model, (a) energy injected by the SN explosions, (b) total energy stored into the system, (c) total kinetic energy, (d) vertical (or poloidal) kinetic energy, (e) total thermal energy, (f) total energy lost by radiative cooling and (g) fraction of the injected SN energy which is radiated away.
| Model | ESN, 3.5 | Esy, 3.5 | |$E_{{\rm k}_{{\rm tot}},3.5}$| | |$E_{{\rm k}_{z},3.5}$| | Eth, 3.5 | Elost, 3.5 | Erad, 3.5 (per cent) |
|---|---|---|---|---|---|---|---|
| SC10-10 | 2.20 | 1.10 | 1.28 | 0.45 | 0.20 | 1.50 | 68 |
| SC10-01 | 5.60 | 2.35 | 2.00 | 0.98 | 0.33 | 4.10 | 73 |
| SC40-10 | 0.86 | 1.18 | 0.98 | 0.20 | 0.19 | 0.53 | 62 |
| SC40-01 | 4.90 | 2.80 | 2.46 | 1.50 | 0.39 | 2.95 | 60 |
| SC100-10 | 1.10 | 1.14 | 0.95 | 0.10 | 0.23 | 0.81 | 74 |
| Model | ESN, 5 | Esy, 5 | |$E_{{\rm k}_{{\rm tot}},5}$| | |$E_{{\rm k}_{z},5}$| | Eth, 5 | Elost, 5 | Erad, 5 (per cent) |
| SC10-10 | 3.20 | 1.75 | 1.49 | 0.42 | 0.26 | 2.30 | 72 |
| SC10-01 | 7.30 | 2.15 | 1.90 | 1.09 | 0.30 | 6.00 | 82 |
| SC40-10 | 1.60 | 1.25 | 1.08 | 0.26 | 0.17 | 1.20 | 75 |
| SC40-01 | 7.20 | 2.70 | 2.35 | 1.30 | 0.35 | 5.35 | 74 |
| SC100-10 | 2.10 | 1.30 | 1.04 | 0.28 | 0.26 | 1.65 | 79 |
3.1 Model SC10-10
The first model (SC10-10) considers 10 SSCs formed along 10 Myr, each of them having a total stellar mass of 107 M⊙, a total SN number of 105 and a mean separation of ∼50 pc. With such configuration, the SN explosions occurring in the first SSCs have more than sufficient energy to drive an outward propagating shock wave which sweeps up the ISM very quickly. In fact, as a single SN explosion generates an SNR, the whole set of SN explosions due to the first SSCs generates several SNRs which interact with each other still in the nuclear region of the disc and drive an outward propagating large-scale shock front. This sweeps up the ISM into a thin and dense shell that envelopes a large, hot, low-density cavity. Such structure, usually denominated superbubble, has also been detected in former numerical studies of GW formation (see e.g. Tomisaka, Habe & Ikeuchi 1981; Tomisaka & Ikeuchi 1986). It is maintained at a high temperature and a low density due to the continuous injection of SN energy. New superbubbles generated by later SSCs will expand into such a rarefied ISM without forming new dense shells and thus suffering negligible radiative losses. Therefore, with the setup of model SC10-10, almost all the SN energy is transferred to the ISM without being radiated away and the result is a highly energized superbubble driven by the energy ejected from each SSC, without forming a wind with filamentary structures immersed in it. Nonetheless, at least the shock-compressed external shell that develops in the beginning is radiatively cooled and suffers fragmentation due to the combination of the development of the Kelvin–Helmholtz (K-H) and Rayleigh–Taylor (R-T) instabilities as the dense gas of the shell is pushed into the rarefied gas of the disc halo (e.g. de Gouveia dal Pino & Benz 1993; Melioli, de Gouveia dal Pino & Raga 2005).
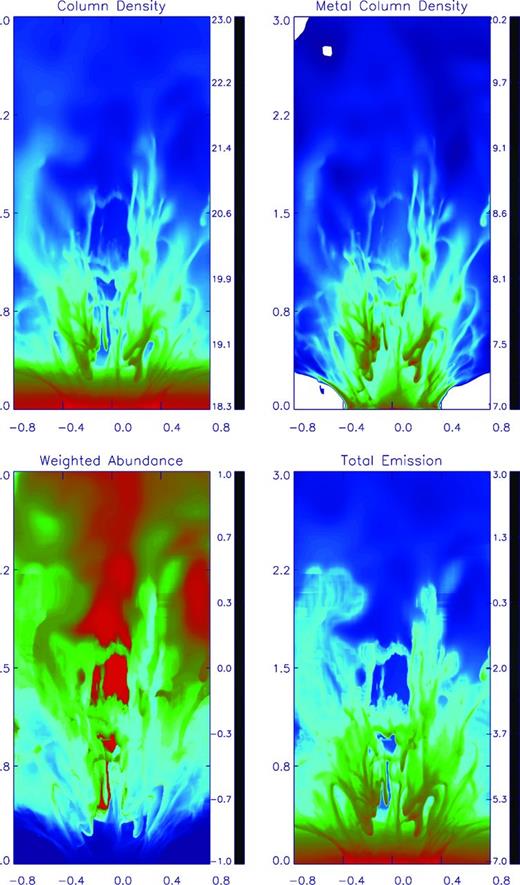
This is the resulting scenario that we see in Fig. 2 after 3.8 Myr when the upper part of the wind has already left the computational domain. The top-left panel shows the gas column density and we note that only dense structures are formed along the expanding shocked shell. No filaments or clouds are formed within the wind flow and consequently the gas of the disc carried out by the wind and lost to the IGM is essentially the interstellar gas swept by the first generation of SN explosions. This is also suggested by the top-right and bottom-left diagrams of Fig. 2. The low-density phase of the wind, which is enriched by the metals ejected by the SNe, has a high abundance ∼10 times larger than the solar abundance. Nonetheless, most of the metals remain in the nuclear region of the galaxy. In this case, we also note that the thermal energy radiated by the wind comes from the external shell, characterized by a temperature of ∼104 K (bottom-right panel of Fig. 2).
![Model SC10-10: colour-scale map of the gas column density (top-left panel), the metal column density (top-right), the total weighted abundance [i.e. ∑ymaxy = 0ρZ(x, z)/∑ymaxy = 0ρ(x, z), where ρZ(x, z) and ρ(x, z) are the metal and total gas density in the space coordinates x, y, respectively] (bottom-left) and the total emission (bottom-right) at a time of t = 3.8 Myr. The column density is shown in units of cm−2, the abundance is normalized by the solar abundance and the emissivity is in erg s−1. All the quantities are expressed in log-scale. In this model, the SSCs have a mass of 107 M⊙, an SN number of 105 and are formed in an SB process of 10 Myr.](https://oup.silverchair-cdn.com/oup/backfile/Content_public/Journal/mnras/430/4/10.1093/mnras/stt126/2/m_stt126fig2.jpeg?Expires=1716434225&Signature=Qr5KQ36KO33cCxHIQPGfUtqScX~~1YJADbm1G9MlJbUDZCBFXB40o9AnnDRdsJ81IKCYhvgGcS2mAi3WHwr~Srr9u1eKC0uZOQS7R6tPNhoTRrH~27cf9gma3i4pU3EtBdUCMkoHRIRIsqSSaVGjWFizaNsADzRs5VAUhCApsYdG4rE4g-v0ulF6Zx48~iGyfyGNCRecI8PcyP-o2lLt87re~sOmXf0wR6ZCRrOtMZkYASyco6ICk9j2jt6~dpnfB7VOmF58y57x~QY7vjyFsZu8t1NWGAz~zojGR0FbfscVRsiFpaptkliFNCbS0bMcn3JANKxsKHr81tDmxYVyqw__&Key-Pair-Id=APKAIE5G5CRDK6RD3PGA)
Model SC10-10: colour-scale map of the gas column density (top-left panel), the metal column density (top-right), the total weighted abundance [i.e. ∑ymaxy = 0ρZ(x, z)/∑ymaxy = 0ρ(x, z), where ρZ(x, z) and ρ(x, z) are the metal and total gas density in the space coordinates x, y, respectively] (bottom-left) and the total emission (bottom-right) at a time of t = 3.8 Myr. The column density is shown in units of cm−2, the abundance is normalized by the solar abundance and the emissivity is in erg s−1. All the quantities are expressed in log-scale. In this model, the SSCs have a mass of 107 M⊙, an SN number of 105 and are formed in an SB process of 10 Myr.
Therefore, the results above suggest that when the gas outflow is generated by only a few very massive SSCs, most of the soft and/or hard X-ray emission will be detected only behind the shocked regions of the shell-like structure around the GW, provided that the reverse shock where the wind impacts the outward propagating shock is right behind the latter.
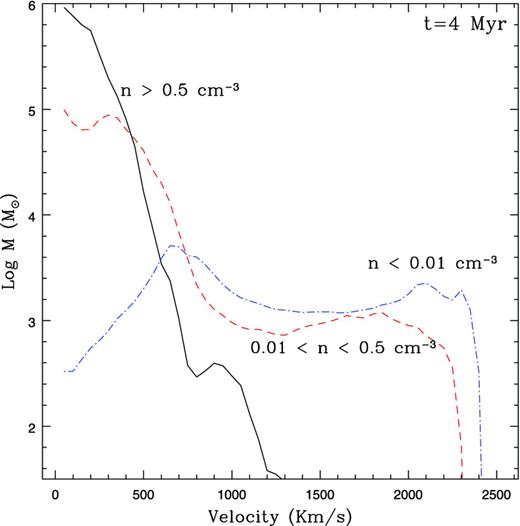
Investigating carefully the features of the gas, we realize that in model SC10-10 there are two well-separated gas phases. The first one associated with the internal part of the superbubble which has a density smaller than 10−1 cm−3, a temperature of ∼107 K and a velocity between 100 and 2000 km s−1. The other gas phase is associated with the external shell of the superbubble, with a density larger than 10−1 cm−3, a temperature of ∼104 K and a velocity normal to the disc direction of ∼1500 km s−1. These features can also be distinguished in Fig. 3, where we have plotted the gas mass as a function of its vertical velocity, for three different ranges of gas densities, and in Fig. 4, where the total mass of each phase with a vertical velocity of ≥50 km s−1 is plotted as a function of z (the height above the disc). We observe that the intermediate phase, characterized by a density of ∼10−1–10−2 cm−3, has a similar mass to the high-density phase, of ∼3 × 10⁵ M⊙. Its velocity follows the velocity distribution of the high-density phase up to ∼500 km s−1, and then follows the distribution of the low-density phase. This means that its evolution does not occur separately from the other phases. In the disc (where the velocities are smaller), this phase is related to the high-density phase, while in the wind (where the velocities are larger), it is connected to the low-density phase. Fig. 3 also highlights the presence of a new generation of accelerated shells which are represented by the peak velocities between 1200 and 1700 km s−1. It is well separated from the high-density gas, which has velocities between 50 and 900 km s−1 and is probably distributed along the external shell pushed by the outflow. The total mass of this new generation of shells is small, because almost all the gas of the nuclear region has been already swept by the first generation of SN explosions, and therefore, no filaments or structures are driven along the wind.
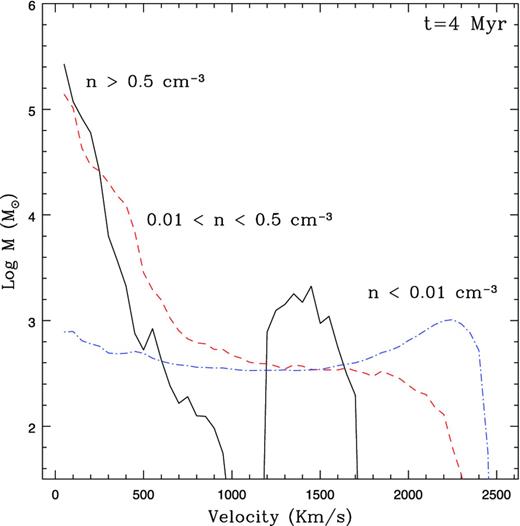
Model SC10-10: gas mass distribution as a function of the vertical velocity for three different phases of the gas at t = 3.8 Myr. Solid line: gas with a number density larger than 1 cm−3; dashed line: gas with a number density between 10−2 and 1 cm−3; dot-dashed line: gas with a number density smaller than 10−2 cm−3. The velocity is expressed in km s−1 and the mass is in units of solar mass (in log-scale). In this model, the SSCs were formed over a period of 10 Myr.
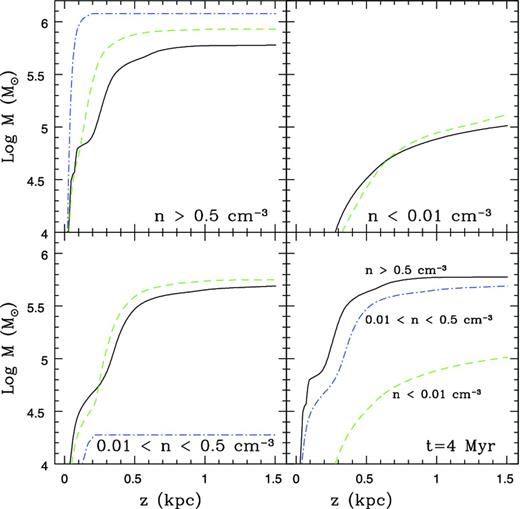
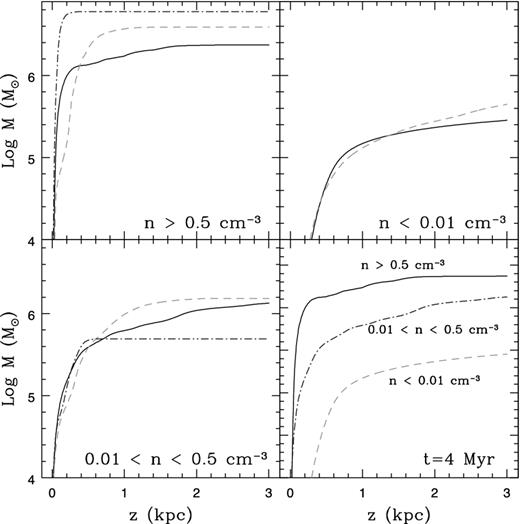
Model SC10-10: total gas mass distribution as a function of z (height above the disc) at three different times: t = 1.5 Myr (dashed line), t = 2.5 Myr (dot-dashed line) and t = 3.8 Myr (solid line). Top-left panel: gas with a number density larger than 1 cm−3; top-right panel: gas with a number density between 10−2 and 1 cm−3; bottom-left panel: gas with a number density smaller than 10−2 cm−3. Bottom-right panel: comparison between the total gas mass at t = 3.8 Myr in the high- (solid line), intermediate- (dashed line) and low-density (dot-dashed line) phases of the gas. Mass is expressed in M⊙ (log-scale) and z is in kpc.
The results above indicate that the SN-driven gas outflow from the nuclear region of a galaxy with only a few highly massive SSCs radiates about 68 per cent of the total energy injected by the SNe. In fact, after 3.5 Myr, when the wind has already filled completely the physical domain of our simulation, the sum of the kinetic and thermal energies of the system is ∼1.5 × 1055 erg, i.e. almost twice the energy of the system at t = 0, corresponding to 8.5 × 1054 erg, while the total energy injected by the SN explosions is about 2.2 × 1055 erg. Therefore, nearly 2/3 of the SN energy is radiated away (mainly in the nuclear region and in the external shell), and the remaining 1/3 goes to the kinetic energy (20 per cent of the total injected energy) and thermal energy (10 per cent of the total injected energy) of the gas. This result is consistent with the evolution of the multiphase ISM shown in Fig. 4. Over the simulated period, the amount of gas with a cooling time shorter than the dynamical time represents ∼60 per cent of the total gas flow and thus assuming that the SN energy is spread approximately uniformly, it is reasonable to believe that all the energy in the shells is radiated away, while the remaining energy in the low- and intermediate-density gas phases increases the gas pressure, and consequently, the thermal and kinetic energy of the GW.
3.2 Model SC10-01
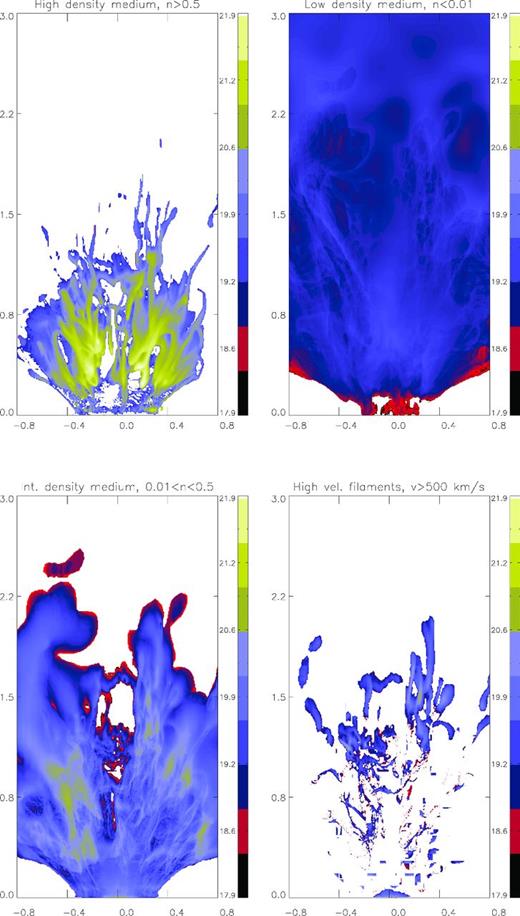
The second model (SC10-01) considers, as in the previous one, 10 SSCs with a stellar mass of 107 M⊙, an SN number of 105 and a mean separation of ∼50 pc. However, in this case we assume that all the super clusters are formed along 1 Myr only, and therefore, in contrast with the first model, every SSC develops a hot bubble surrounded by a thin dense shell at about the same epoch. The SN explosions occurring in the SSCs have sufficient energy to drive the bubble expansion at the same time that the collisions between the shells lead to the formation of an interconnected network of dense filaments permeated by tunnels containing a very hot, tenuous ISM. In fact, the SNRs generated by the SN explosions propagate into an ambient medium with a density of ≥1 cm−3, and enter in the radiative phase in a time shorter than 3 × 10⁴ yr (McCray 1987), that is, at radii smaller than ∼20 pc (Melioli et al. 2006). Therefore, their external shells are expected to become very dense (nsh/n ≥ 10) and cold (T ≤ 104 K) before interacting with each other. Collisions among them lead to the formation of very dense filaments (up to 1000 times denser than the hot gas) and dense surfaces (up to 100 times denser than the hot gas) in times between 105 and 106 yr according to our simulation. R-T and K-H instabilities are also able to fragment these structures and produce new filaments, in a process that can continue during all the SN activity, until the average gas density of the SB is ≥10−1 cm−3 (see e.g. McCray 1987; Melioli et al. 2006). In spite of the initial formation of filaments and dense structures, the superbubble resulting from the interaction of the individual SSC bubbles evolves as in model SC10-10, and when the external shell fragments due to R-T and K-H instabilities, the hot gas is able to escape from the galaxy without carrying very large amounts of metals or disc gas. Nonetheless, Fig. 5, which maps the column density edge-on distributions of each gas phase in different velocity ranges, clearly shows that a bunch of filaments and a large amount of metals are launched together with the hot and low-density gas (top-left and top-right panels of Fig. 5) and consequently, a large fraction of energy is radiated away by the filaments themselves.
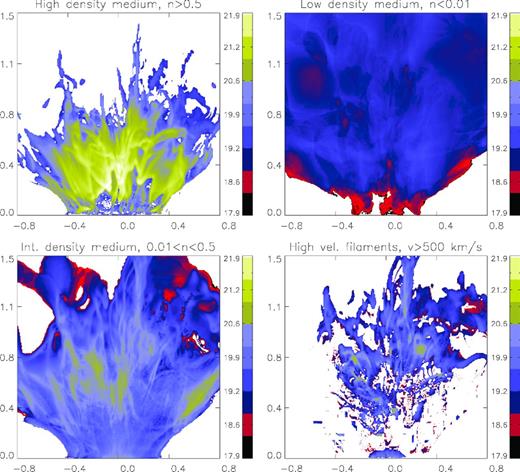
Model SC10-01: map of the gas column density for different density and velocity ranges at a time of 3 Myr. Top-left panel: n ≥ 0.5 cm−3 and v ≥ 50 km s−1; top-right panel: 0.01 ≤ n ≤ 0.5 cm−3 and v ≥ 50 km s−1; bottom-left panel: n ≤ 0.01 cm−3 and v ≥ 50 km s−1; bottom-right panel: n ≥ 0.5 cm−3 and v ≥ 300 km s−1. The column density is expressed in cm−2. The ‘white’ portions in each panel represent regions with a total column density smaller than 8 × 1017 cm−2.
3.3 Model SC40-10
Now we are going to analyse the results of our simulations considering an SB region with intermittent injection of mass and energy from a larger number of SSCs (40) having a stellar mass of 2.5 × 10⁶ M⊙, an SN number of 2.5 × 10⁴ and a mean separation of ∼40 pc. In this case, we assume, as in model SC10-10, that the SSCs are formed over a time of 10 Myr (model SC40-10).
The resulting gas outflow is very similar to the one obtained in model SC10-10 but it has a number of filaments up to a height of ∼600 pc. Also in this case, despite the high metal abundance of the wind flow (∼10 Z⊙), most of the metals ejected by the SNe remain in the disc, and only a small fraction is transported to outside of the system together with the large external shell formed by the activity of the first SSCs. Finally, the gas emission of the central region (up to 500 pc) is about 1000 times larger than the emission of the wind and 100 times larger than the emission of the external shell. Therefore, in such a case, we expect an X-ray emission coming only from the SB core of the galaxy and a weak radio and infrared emission from the shell fragments at ∼1.5 kpc from the disc, characterized by a maximum temperature of ∼104 K.
Although the main features of the wind are different from those observed in M82, we note that an increase in the number of SSCs from model SC10-10 to model SC40-10 favours the formation of a multiphase gas in the latter. The dense, cold gas phase shows a peak between velocities of 600 and 800 km s−1, corresponding to a total gas mass of about 3000 M⊙ in accelerated filaments in the nuclear region. At the same time, both the intermediate- and low-density gas are accelerated up to velocities of 2000 and 2300 km s−1, respectively, and the intermediate (warm)-phase velocity distribution overlaps with that of the denser (cold) phase until 800 km s−1, which corresponds to the maximum velocity of the filaments.
To understand better the multiphase gas distribution, as before, we have analysed the edge-on column density of each gas phase, which shows that in the first 500 pc the cold (high-density), warm (intermediate-density) and hot (low-density) gas phases are completely mixed up. Above 500 pc, instead, the phases are decoupled, and no clouds or filaments are observed together with the low-density launched flow.
In this model, the energy radiated away is about 75 per cent of the total energy injected by the SNe. After 5 Myr, the sum of the kinetic and thermal energies of the system is ∼1.25 × 1055 erg, while the total injected energy is ∼1.6 × 1055 erg. This means that about 3/4 of the SN energy is lost by radiative cooling, while the remaining 1/4 goes into the kinetic energy (15 per cent of the total injected energy) and thermal energy (10 per cent of the total injected energy) of the gas. Also in this case, the energy distribution is consistent with the composition of the multiphase ISM. After 4 Myr, the amount of gas in the intermediate- and high-density phases represents ∼65 per cent of the total gas flow, but we note that earlier this fraction was larger than 80 per cent. This means that the energy was radiated away with high efficiency and proportionally to the total amount of gas with a density larger than 0.01 cm−3.
3.4 SC40-01 – the reference model
The fourth model (SC40-01) considers 40 SSCs (as in model SC40-10) with a stellar mass of 2.5 × 10⁶ M⊙, an SN number of 2.5 × 10⁴ and a mean separation of ∼40 pc, but with the formation of the SCCs over 1 Myr only. This model, which we denominate our reference model, due to the larger energy power injected (see Table 3) is able to produce and launch a multiphase wind to greater distances. For this reason, we have run this simulation in a larger box domain with physical dimensions of 1.5 × 1.5 × 3 kpc.
As described in model SC-10-01, the larger number of SSCs and the shorter time (1 Myr) at which they begin to be active (which lead to a larger injected energy power) have created the conditions to produce an environment with rich filamentary structure and with a thermal pressure large enough to drive both the low- and high-density phases of the wind very quickly to large distances. In a few Myr, a multiphase ISM is launched in the IGM and a GW with a large number of dense structures embedded in a hot, low-density gas develops. Fig. 6 shows this situation. Above the disc, at z ≫ 300 pc, the edge-on column density distribution shows the presence of a network of elongated filaments in the direction of the rarefied flow. Due to their high density (in spite of their low abundance), the filaments carry with them a large amount of metals and therefore, in this case, represent an efficient mechanism to transport the chemical species ejected by the SN explosions above the disc. Also, the metal abundance in the wind is large, between 5 and 10 Z⊙, and these values are in agreement with those obtained in previous studies of M82 wind (Strickland & Heckman 2009). The launched multiphase medium radiates energy at all heights (see Fig. 6, bottom-right panel) and thus may be observed both in X-ray and radio wavelengths.
Model SC40-01: the same as in Fig. 2, at t = 3.5 Myr, except that here we consider 40 SSCs forming over 1 Myr with a mass of 2.5 × 10⁶ M⊙ and an SN number of 2.5 × 10⁴.
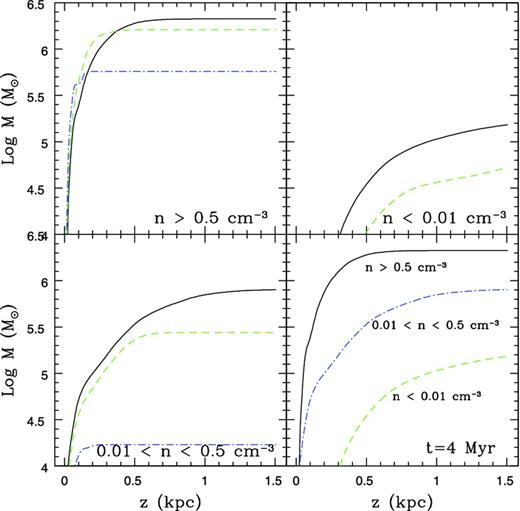
If we look at the velocity distribution of the different gas phases (Fig. 7), we note that gas at high density with velocities between 150 and 800 km s−1 has mass almost 10 times larger than in previous models. This means that the dense (cold) phase is being launched from the SB region along with the hot phase in the wind. This trend is confirmed by the multiphase evolution shown in Fig. 8. The dense, intermediate- and low-density gas phases are completely superimposed, each one with its own velocity. In particular, the high-velocity clumps and fragments are spread and embedded all over the wind. The total mass of the high-density phase in the flow is ∼4 × 10⁶ M⊙, while the gas of intermediate density has a mass of ∼1.5 × 10⁶ M⊙, and the gas of low density has ∼5 × 10⁵ M⊙ (Fig. 9). The high-density gas in the wind is therefore ∼2/3 of the total GW mass, while only 8 per cent of the GW mass is due to the hot and high-velocity, low-density gas. Due to the large fraction of high-density gas in the flow, most of the injected energy is lost by radiative cooling. After 5 Myr, the total energy of the system is 2.7 × 1055 erg, while the total injected SN energy is 7.2 × 1055 erg. Since the initial energy is 8.8 × 1054 erg, this implies that the energy radiated away by radiative cooling is ∼5.35 × 1055 erg, that is, ∼74 per cent of the injected energy.
Model SC40-01: the same as in Fig. 3, except that here we consider 40 SSCs forming over 1 Myr with a mass of 2.5 × 10⁶ M⊙ and an SN number of 2.5 × 10⁴.
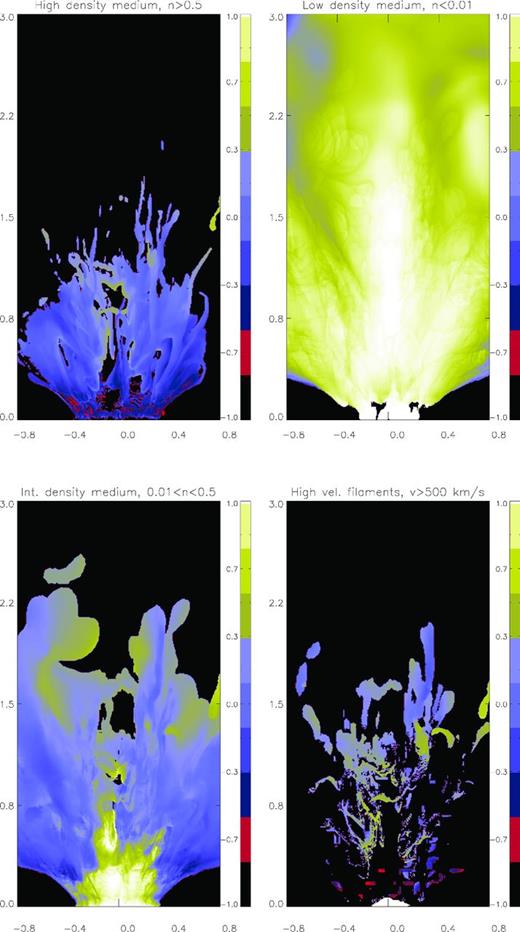
Model SC40-01: map of the gas column density for different density and velocity ranges, at a time of 4.5 Myr. Top-left panel: n ≥ 0.5 cm−3 and v ≥ 50 km s−1; top-right panel: 0.01 ≤ n ≤ 0.5 cm−3 and v ≥ 50 km s−1; bottom-left panel: n ≤ 0.01 cm−3 and v ≥ 50 km s−1; bottom-right panel: n ≥ 0.5 cm−3 and v ≥ 300 km s−1. The column density is expressed in cm−2.
Model SC40-01: the same as in Fig. 4, except that here we consider 40 SSCs built up over 1 Myr with a mass of 2.5 × 10⁶ M⊙ and an SN number of 2.5 × 10⁴ at a time of 1.5 Myr (dashed line), 3.3 Myr (dot-dashed line) and t = 4 Myr (solid line).
As the main features of the GW in M82 seem to be similar to those obtained in this reference model (Sc40-01), we can investigate in more detail the physical conditions of the energized gas in this model. Fig. 10 depicts the face-on gas density, temperature, pressure and vertical-velocity distributions at an earlier time t = 2.5 Myr, at a height of 50 pc above the disc where the coexistence of different phases is better highlighted. A straightforward feature in this figure is the presence of multiphase structures with high temperature (T ≥ 107 K), pressure (p/k ∼ 4 × 10⁷) and density (n ∼ 5 × 102 cm−3) coexisting with an underlying high-velocity (v ∼ 2000 km s−1), low-density (n ≤ 10−2 cm−3) wind. These values are similar to those inferred from recent observations (see e.g. Westmoquette et al. 2009a,b). Moreover, looking at the vertical velocity distribution3 we see that the filaments produced in the core move in the wind with a velocity between ∼100 and 800 km s−1, while the gas with high thermal pressure that drives the superwind moves in different streams and channels with a typical velocity of ∼2000 km s−1. Considering that the escape velocity of the M82 wind is ∼400 km s−1 (e.g. Strickland & Heckman 2009), we can conclude that only the low-density gas and a little fraction of the filaments may really escape from the galaxy.
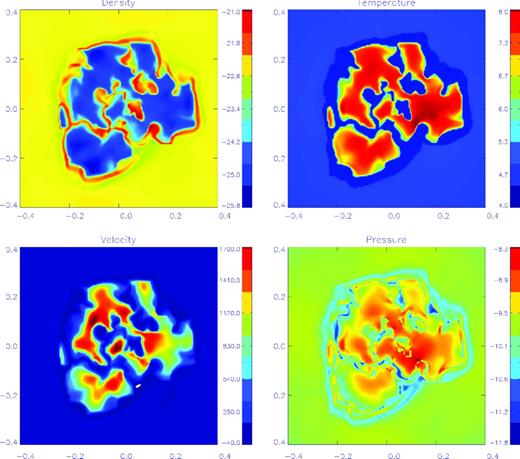
Model SC40-01: colour-scale map of the face-on M82 gas density (top-left panel), temperature (top-right), vertical-velocity (bottom-left) and pressure (bottom-right) distributions, at a height of 50 pc above the disc and at a time of t = 2.5 Myr. The density is shown in units of g cm−3, the temperature in K, the pressure in dyne cm−2 and the velocity in km s−1.
Finally, in Fig. 11 we show the average abundances for each gas phase of the flow. The faster and smaller density phase, with a velocity between 500 and 2000 km s−1, is characterized by a high metal abundance, ∼10 times larger than the solar abundance. On the other hand, the slower and denser phase, with a velocity between 100 and 800 km s−1, representing ∼70 per cent of the total flow mass, has a metal abundance between one and four times the solar value.
Model SC40-01: map of the average metal abundance for different density and velocity ranges, at a time of 4.5 Myr. Top-left panel: n ≥ 0.5 cm−3 and v ≥ 50 km s−1; top-right panel: 0.01 ≤ n ≤ 0.5 cm−3 and v ≥ 50 km s−1; bottom-left panel: n ≤ 0.01 cm−3 and v ≥ 50 km s−1; bottom-right panel: n ≥ 0.5 cm−3 and v ≥ 300 km s−1. The abundance is expressed in units of solar abundance.
3.5 Model SC100-10
The last model (SC100-10) considers 100 SSCs built up over 10 Myr with a stellar mass of 106 M⊙, an SN number of 104 and a mean separation of ∼25 pc. In this case, as in models SC10-10, SC10-01 and SC-40-10, the numerical simulation was performed in a box domain with dimensions of 1.5 × 1.5 × 1.5 kpc.
The results are similar to those of model SC40-01. The larger number of SSCs combined with a smaller power injected per SSC (which are formed for longer time) generates an ambient medium which is rich in filaments and with a high thermal pressure that accelerates the filaments and clouds to high velocities together with the hot wind flow. Also in this case the multiphase ambient with dense structures embedded in the hot, low-density gas provides alone 70 per cent of the total flow mass (Fig. 12).
Model SC100-10: the same as in Fig. 4, except that here we consider 100 SSCs with a mass of 106 M⊙ and an SN number of 104 at a time of 2.5 Myr (dashed line), 3.5 Myr (dot-dashed line) and t = 5 Myr (solid line).
The main difference with regard to the previous model (SC40-01) is the process of clump formation. In model SC40-01, after 2 Myr the filamentary structure has a total mass of ∼6 × 10⁶ M⊙, while after 5 Myr it decreases to ∼3.5 × 10⁶ M⊙. In model SC100-10, on the other hand, the filamentary mass increases with time from 6 × 10⁵ M⊙ at t = 2 Myr to ∼2.3 × 10⁶ M⊙ at 5 Myr. Around 4 Myr the total mass of the filaments is about the same in both models, but in model SC40-01, a large amount is quickly produced and then partially ablated by the wind flow, while in the second case (model SC100-10), the filaments are produced more slowly as the superbubbles expand and collide. This different evolution of the denser gas phase also affects the radiative cooling. For model SC100-10, after 5 Myr the total energy of the system is 1.3 × 1055 erg, while the injected SN energy is 2.1 × 1055. This means that the energy radiated away is ∼1.65 × 1055 erg, or ∼80 per cent of the total injected energy, therefore, a little larger than that in model SC40-01.
4 DISCUSSION AND CONCLUSIONS
In this study, we have investigated the formation of GWs driven by SN explosions, with particular focus on the M82 galaxy.
Several driving processes of GWs have been proposed over the last few years, including thermal pressure due to SN heating (Larson 1974; Dekel & Silk 1986; D’Ercole & Brighenti 1999; Mac Low & Ferrara 1999; Strickland & Stevens 2000; Melioli et al. 2008, 2009; Hill et al. 2012), radiation pressure on dust grains (Martin 2005; Murray, Quataert & Thompson 2005; Nath & Silk 2009), cosmic ray pressure (Breitschwerdt, McKenzie & Voelk 1991; Everett et al. 2008; Uhlig et al. 2012) and supersonic turbulence (Scannapieco & Brüggen 2010). In most of these processes, SNe are the main source of energy injection which is then reprocessed. In the particular case of SB galaxies, where the SFR is high, we expect that the SN energy dominates all the other processes and therefore, in the present study we have only considered the role that SN shock fronts play in the evolution of the ISM (at small scales) and in the GW evolution (at large scales). In the central SB of M82, there are a large number of SSCs which are permeated by a complex distribution of gas with different densities, pressures and temperatures. As expected, most of our 3D radiative cooling hydrodynamical numerical simulations generated outflows with a complex morphology which captured the main features of an M82-like wind, i.e. a rich cold filamentary structure embedded in a hot, low-density gas (see models SC-10-01, SC-40-01 and SC-100-10), starting right in the nuclear region and therefore in agreement with the observations (see e.g. Westmoquette et al. 2009a).
Although previous works have already studied the M82 wind taking into account the effects of radiative losses, here we have performed a detailed analysis exploring the effects of different initial conditions in order to assess the connection between the characteristics of the SB environment and the main features of an M82-like wind. More specifically, we tested the effects of two relevant parameters in the evolution of an SB GW: the total number of SSCs which are randomly distributed in space and time in the SB nuclear region (and their stellar mass) and the rate of SF (or in other words, the build-up rate of the SSCs), which ultimately trace the evolution of the SN-injected power in the wind (see below).
In the following we discuss and summarize the main results obtained, particularly emphasizing the evolution and characteristics of the multiphase environment, the energy budget of the system, the GW metal abundance, and the mass and metals lost by the galaxy to the IGM.
4.1 Multiphase wind environment
To study the formation and evolution of a multiphase environment, we have considered three typical gas phases which are mainly distinguished by their density. We denominated high-density phase the gas with a number density of n ≥ 0.5 cm−3, intermediate-density phase the gas with a density between 10−2 and 0.5 cm−3 and low-density phase the gas with a density of n ≤ 10−2 cm−3. Considering in all models the same final total injected SN luminosity of 1042 erg s−1, but with different injection rates over the first 10 Myr (see Fig. 1), we have shown that GWs are built up with a low-density gas component with typical velocities between 50 and 2200 km s−1 and with a high-density gas component with velocities between 50 and 800 km s−1.
The SB region contains a total amount of gas of ∼3 × 10⁷ M⊙, but only a fraction of this gas is accelerated by the SN explosions and driven into the wind flow, while the remaining part is pushed to the outskirts of the SB environment (i.e. to the external regions of the disc) and part remains among the SSCs in a turbulent state.
Because in all models the SB region is very quickly filled with the superbubbles produced by the first SSCs, the SB mass injected in the wind is nearly the same in all models, ∼65 per cent of the total mass at the beginning of the SN activity, i.e. ∼2 Myr, settling then to about 75 per cent at the end of the simulations, at 5 Myr. However, depending on the model, the diffuse gas may be either converted in dense filaments and clumps due to the compression and radiative cooling of the swept material by the SN shock waves or just ejected from the SB region in a hot, low-density wind surrounded by a thin, dense shell. This is consistent with the results found by Tenorio-Tagle et al. (2003) and Rodríguez-González et al. (2008a,b). In both cases a GW develops, but with a distinct morphology. In the first case we have ‘filamentary-like’ GWs, as observed in M82 and also in models SC10-01, SC40-01 and SC100-10, while in the second case we have ‘superbubble-like’ GWs where the superbubble expands until its external supershell fragments allowing the hot gas to flow into the IGM and where the only structures are those generated by the fragmentation of the supershell, as in models SC10-10 and SC40-10. We note that, regardless of the total power injected which is the same for all models (1042 erg s−1), the spatial and temporal distribution of the SSCs within the SB region and thus the first million years of SN activity (Fig. 1) are determinant factors to allow the formation of a rich filamentary structure in the wind. If the SSCs form fast enough and if they are in a sufficiently large number, then several SN shells evolve overall in the region and can interact nearly simultaneously, building up a rich filamentary structure which is dragged by the wind.
Considering the discussion above, we may try to establish the physical conditions which are necessary to form a multiphase ISM and an M82-like GW. We have found that a larger number of clumps and filaments are mainly generated during the first interactions of the SN superbubbles when their volume filling factor is ff ≤ 1 and a large fraction of unperturbed gas is still in the nuclear region. Therefore, it is the number of active SSCs before ff becomes ff = 1 that determines whether the wind will be a ‘filamentary’ or a ‘superbubble-like’ wind. Our results indicate that ff becomes equal to unity at t = 1 Myr for model SC10-10, at t = 0.6 Myr for model SC10-01, at t = 1.3 Myr for model SC-40-10, at t = 0.65 Myr for model SC40-01 and at t = 1.9 Myr for model SC-100-10. At these times, the number of active SSCs is 3 for SC10-10, 7 for SC10-01, 4 for SC40-10, 26 for SC40-01 and 23 for SC100-10. This means that the larger the number of SSCs formed before ff becomes ff = 1, the more complex and rich the wind filamentary structure will be. When the number of active SSCs is ≥7–10 and ff ≤ 1 (which corresponds to a mean separation between simultaneously active SSCs of ≤ 80 pc), a multiphase environment is built up in the central region of the galaxy favouring the formation of a filamentary wind, as in M82.
The resulting filaments have extensions between ∼50 and 500 pc, thickness of ∼30 pc, densities between 1 and 10 cm−3, temperatures of about 104 K, pressures between 10−11 and 10−12 dyne cm−2 and velocities between ∼100 and 800 km s−1. Outside of the disc, because the wind has a velocity of ∼2200 km s−1, they are impacted by the hot gas with relative velocities of 1500–1800 km s−1, and therefore, the temperature may increase up to 107 K. Just a little fraction of these filaments escape from the galaxy, and, based on the results of this work, this corresponds to only ∼10 per cent of the gas in the high-density phase, that is, about 5 × 10⁵ M⊙. This result suggests that although the wind can be efficient to inject energy into the halo, it seems to be less efficient to inject disc mass (see also Section 4.4).
We can conclude that the environmental conditions at the base will determine the main large-scale features of the GW morphology, and particularly, whether filaments and a multiphase environment will develop or not in the wind. If a large number of SSCs form before the SNe-driven hot superbubbles fill out the entire nuclear volume of the galaxy, then an M82-like wind, with a rich filamentary structure, develops. On the other hand, if only a few highly massive SSCs form in the SB region, then the SNe will drive a superbubble-like wind with no filaments and with all the phases of the gas (high, intermediate and low density) well separated from each other.
The results above also suggest that the features of the wind mainly depend on the recent SF history of the SB rather than all earlier SB episodes which occurred before ∼50 Myr. In fact, although many observations indicate that intense episodes of SF occurred in M82 also about 100 Myr ago (see e.g. de Grijs, O’Connell & Gallagher 2001), the simulations indicate that the present wind energy and morphology are essentially due to the recent activity occurring along a few Myr of the younger SSC lifetime. Remnants of fossil SF activity had been swept long ago by the strong power driven by previous SN explosions and are possibly in the outer regions of the wind or have already evaporated. For this reason, it is sufficient to consider only the last ∼10 Myr of the SB lifetime in order to assess the main features of the large-scale wind structure in the galaxy surrounds, as in the models discussed here.
4.2 Energy budget
The energy injected by the explosions of SNe from a single SSC has a heating efficiency of HE ∼ 100 per cent (where, as remarked in Section 2.2, HE corresponds to the ratio between the kinetic plus thermal energies stored in the gas and the energy injected by the SN explosions; Melioli & de Gouveia Dal Pino 2004). This is because the radiative losses are important only if tcool ≤ tint (where tcool and tint are the gas radiative cooling time and the interaction time of the SNRs, respectively), and in the case of single SSC the SNe occur so close in space and time that this relation is almost never fulfilled. But what fraction of the total energy of the superbubbles goes to drive bulk gas motions and generate a large-scale wind? In all the models, we have found that the energy lost by radiative cooling is proportional to the ratio between the mass of the high-density gas component and the total mass of the GW. Since this value ranges between 70 and 82 per cent, we verify that only a fraction between 20 and 30 per cent of the SN energy goes into the kinetic energy of the gas to drive the GW (Fig. 13). Therefore, in contrast to the results obtained for the formation of a multiphase environment, the fraction of energy available for the build-up of the GW is about the same for all the models independent of the temporal and space distribution of the SSCs and of the SN power injection during the first Myr.
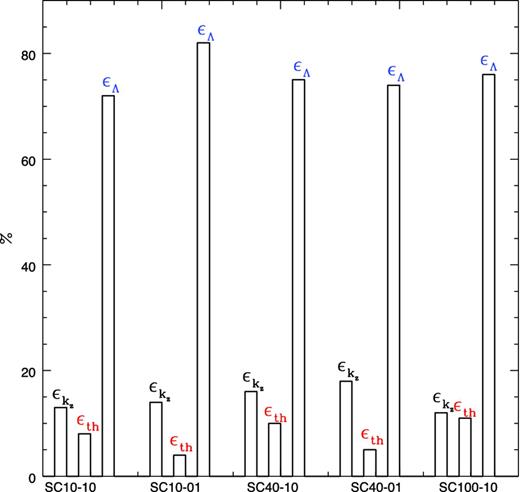
SN energy distribution for the different models studied here after a time of 5 Myr. |$\epsilon _{{\rm k}_z}$|: fraction of the total SN energy stored in the gas as vertical (or poloidal) kinetic energy; ϵth: fraction of the total SN energy stored in the gas as thermal energy; ϵΛ: fraction of the total SN energy lost by radiative cooling.
The injected energy that is not radiated away provides most of the kinetic energy to the gas in the high-density phase (filaments and clouds) and the thermal energy to the gas in the intermediate- and low-density phases. These energies are spatially distributed as depicted in Fig. 14 for model SC40-01.
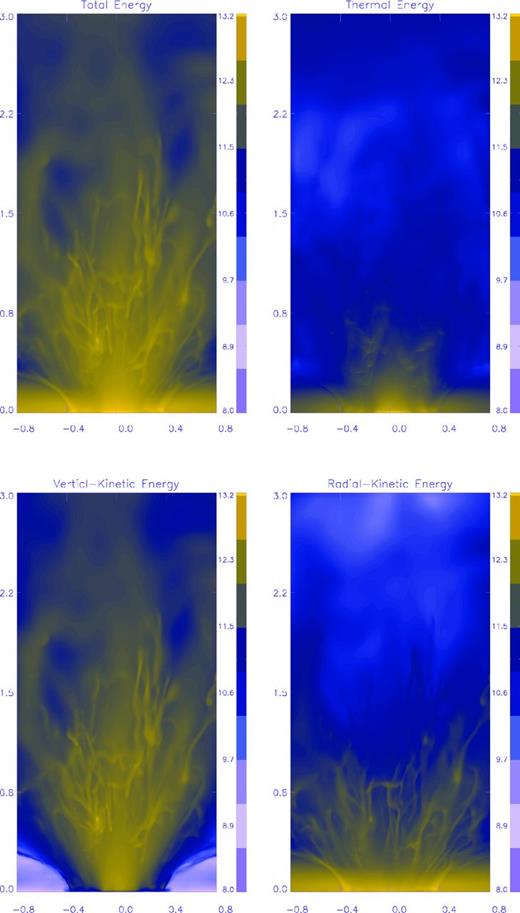
Model SC40-01: map of the energy ‘column density’ (i.e. the energy density integrated in the transverse direction to the wind) at a time of 3.5 Myr. Top-left panel: total energy; top-right panel: thermal energy; bottom-left panel: vertical or poloidal kinetic energy; bottom-right panel: radial kinetic energy. The energy column density is expressed in erg cm−2.
With the results of the reference model (SC40-01) presented in Fig. 9, we obtain an average temperature for the low-density gas of T ∼ 107 K and an average velocity for the high-density gas of vf ∼ 500 km s−1, where we have considered ϵth ∼ 5 per cent and ϵk ∼ 18 per cent (see Fig. 13). This is in agreement with Chevalier & Clegg (1985) who predicted that for a thermalization efficiency of about 10 per cent, the wind fluid should have a temperature in a range between 107 and 108 K even if it had been slightly mass loaded with cold ambient gas. We note that although the wind model of Chevalier & Clegg (1985) is adiabatic, these authors introduced two parameters in their model (α and β) in order to incorporate the effects of radiative cooling both from the SN ejecta and dense gas, so that a comparison of their model with the present ones is appropriate. However, as pointed out by Strickland & Heckman (2009), such temperatures are hotter than the usually observed warm ionized, soft X-ray emitting plasma in GWs. Thus, hard X-ray observations are still required in order to confirm or not the predictions of the models.
Based on the results above of the energy distribution during the wind evolution, we can conclude that an M82-like GW could be generated in two steps. The first one can be characterized by the formation of superbubbles due to SN activity in each SSC with an SN heating efficiency of HE ∼ 100 per cent (Melioli & de Gouveia Dal Pino 2004). The second step is characterized by large-scale interactions of the superbubble shells with an HE (including the thermal and the kinetic energy contributions) of ∼20 per cent only. In this scenario, about 80 per cent of the SN energy is radiated away mainly by the denser structures embedded in the GW.
4.3 Chemical evolution
Our simulations show that a large fraction of the metals injected into the ISM by the SNe are in the filaments located near the galactic disc (see the upper-right panel of Fig. 6). In fact, the metal abundance in this high-density gas component is small, but the total amount of metals it contains is similar to the metal mass contents in the low-density component.
Regardless of the model, the high-density, high-velocity structures have a maximum abundance close to the solar one, while the low-density phase is characterized by a maximum abundance of ∼10 Z⊙. Examining the maps of Fig. 11 for our reference model SC40-01, we can determine an average abundance, |$\bar{Z}$|, for each gas phase. For the high-density phase, we obtain |$\bar{Z_{\rm h}} \sim 0.5$| Z⊙, for the intermediate-density phase |$\bar{Z_{\rm i}} \sim 1.2$| Z⊙, while for the low-density phase we have |$\bar{Z_{\rm l}} \sim 4.5$| Z⊙. Each gas phase regulates the chemical evolution of the different parts of the system. The high- and intermediate-density phases, with their filaments and clumps, are unable to escape from the galaxy and are thus responsible for retaining in it an important fraction of the metals ejected by the SN explosions. In fact, the total amount of ejected metals after 8 Myr is ∼2 × 10⁵ M⊙, but the amount which escapes from our physical domain is only ∼8 × 10⁴ M⊙ and the remaining portion is retained in and around the galactic disc. The total mass of metals in the high- and intermediate-density phases are, respectively, |$M_{{\rm h}}\times \bar{Z_{\rm h}}$| and |$M_{{\rm i}}\times \bar{Z_{\rm i}}$|, that is, ∼4 × 10⁴ M⊙ of metals for each phase, which represents ∼2/3 of the metals stored in the galaxy. The remaining 1/3 of the chemical species is in the low-density phase, and is therefore, the only fraction of metals that is transported to outside of the galaxy to enrich the IGM.
Based on the results above, we can conclude that the SN explosions in an M82-like SB galaxy change significantly the metallicity only of the low-density wind component. In our simulations, this component has a resulting metal abundance between 5 and 10 Z⊙. The injected metals by the SNe do not affect significantly the metallicity of the high- and intermediate-density phases of the wind, a result which is in contrast to what occurs, for instance, in the clouds built up in galactic fountains (Melioli et al. 2008, 2009).
4.4 Mass-loss
Our results suggest that during the early phases of expansion, the GW transports to above the disc a large amount of energy, momentum and gas, but at the same time the high-density component (of clouds and filaments) is able to reach only intermediate altitudes and does not escape from the system. As a consequence, no significant amount of gas mass is lost in the IGM, except for an important fraction of metals and SN ejecta that flow along with the high-velocity, low-density gas in the GW. In our reference model (SC40-01), for instance, the GW reaches a nearly steady-state evolution after 4–5 Myr and until that moment the mass lost by the system is about 0.6 M⊙ yr−1 only. In fact, as stressed in the previous section (Section 4.3), the only gas phase which is able to flow freely into the IGM is the low-density phase. However, due to its very low density, the total gas mass in this phase represents only 5 per cent of the total mass of the GW (see Fig. 9). We note that this value is only slightly smaller than that indicated by Strickland & Heckman (2009).
Based on the results above, we can conclude that the mass evolution of the galaxy is not substantially affected by the SB events observed in the core of M82.
5 SUMMARY
The main conclusions of this work can be summarized as follows.
The environmental conditions at the base will determine the main large-scale features of the GW morphology. If a sufficiently large number of SSCs are built up before the SNe-driven hot superbubbles fill out the entire nuclear volume of the galaxy, then an M82-like wind, with a rich filamentary structure, develops. In quantitative terms, a multiphase wind is built up, as in M82, if the number of SSCs is ≥7–10 while ff is still ≤1.
About 80 per cent of the SN energy is radiated away mainly by the high-density structures which are formed from the fragmentation of the superbubble shells (see e.g. model SC40-01).
The SN explosions in an M82-like galaxy change significantly the metallicity only of the low-density wind component. In our simulations, this component has a resulting metal abundance between 5 and 10 Z⊙, while the metallicity of the high- and intermediate-density components is around the solar abundance (i.e. ∼0.5–1 Z⊙). Also according to our results, about 1/3 of the total mass in metals is in the low-density component, and therefore, this is the only fraction that can be transported to the IGM.
During the early phases of expansion, the GW transports to outside the disc large amounts of energy, momentum and gas, but the more massive high-density component (which is composed of clouds and filaments) is able to reach only intermediate altitudes (typically smaller than 1.5 kpc), and therefore, does not escape from the system. As a consequence, no significant amounts of gas mass are lost to the IGM and the mass evolution of the galaxy is not much affected by the SB events occurring in the nuclear region.
CM acknowledges support from a post-doctoral fellowship from the Brazilian agency FAPESP (grant 2011/22078-6). EMGDP acknowledges partial support from FAPESP (2006/50654-3) and from CNPq (grant no. 300083/94-7).
We note that due to the short lifetime of the SB, almost all the injected energy in the wind is due to SNe II only. For this reason, in this study we neglect the contributions due to Type I SN explosions.
We have also performed several tests with a larger resolution of 2.9 pc per cell for 2 Myr and found that the results were very similar to those with a 5.8 pc resolution per cell. For this reason, we adopted the latter scheme for the study presented here as it allowed us to save computation time without losing information and quality in the results.
We have examined several cuts along and in the normal directions of the flow which are not presented here.
