


Abstract
We have analysed the photometric data obtained with the STEREO spacecraft for 558 non-magnetic chemically peculiar (CP) stars to search for rotational and pulsational variability. Applying the Lomb–Scargle and the phase dispersion minimization methods, we have detected photometric variability for 44 objects from which 35 were previously unknown. The new objects are all bright stars on the ecliptic plane (magnitude range 4.7 < V < 11.7) and will therefore be of great interest to studies of stellar structure and evolution. In particular, several show multiple signals consistent with hybrid δ Scuti and γ Doradus pulsation, with different periodicities allowing very different regions of the stellar interior to be studied. There are two subgroups of stars in our sample: the cool metallic line Am (CP1) and the hot HgMn (CP3) stars. These objects fall well inside the classical instability strip where δ Scuti, γ Doradus and slowly pulsating B-type stars are located. We also expect to find periods correlated to the orbital period for CP1 objects as they are mostly members of binary systems. For CP3 stars, rotationally induced variability is still a matter of debate. Although surface spots were detected, they are believed to produce only marginal photometric amplitudes. So, periods from several hours to a few days were expected for these two star groups. The STEREO/HI-1 data are well matched to studies of this frequency domain, owing to the cadence of approximately 40 min and multiple epochs over four and a half years. The remaining 514 stars are likely to be constant in the investigated range from 0.1 to 10 d. In some cases, the presence of blending or systematic effects prevented us from detecting any reliable variability and in those cases we classified the star as constant. We discuss our results in comparison to already published ones and find a very good agreement. Finally, we have calibrated the variable stars in terms of the effective temperature and luminosity in order to estimate masses and ages. For this purpose, we used specifically developed calibrations for CP stars and, when available, Hipparcos parallaxes. All but two objects cover the stellar mass range from 1.5 to 5 M⊙ and are located between the zero- and terminal-age main sequence.
1 INTRODUCTION
In the first paper of this series (Wraight et al. 2012, hereafter WFN12), we presented photometric time series of 337 magnetic chemically peculiar (CP) stars from the NASA’s twin STEREO spacecraft. In total, 82 objects were identified as variable caused by rotation in the presence of surface spots (Mikulášek et al. 2011).
As a further step, the light curves of non-magnetic CP stars of the upper main sequence were analysed. The sample consists of cool metallic line Am (CP1) and the hot HgMn (CP3) stars. Most CP1 and CP3 stars are members of a binary system in which the rotation of the stars has been slowed down by tidal interaction. The members of these groups have stellar masses from 1.5 to 5 M⊙ and are located between the zero-age main sequence (ZAMS) and terminal-age main sequence (TAMS). Thus, they fall well inside the classical instability strip where δ Scuti, γ Doradus and slowly pulsating B-type (SPB) stars are found. Indeed, these types of pulsators were found among CP1 and CP3 stars (Alecian et al. 2009; Smalley et al. 2011). The STEREO/HI-1 data have a cadence of approximately 40 min, and multiple epochs over four and a half years. Therefore, these data sets are perfectly suited to find the predicted periods of variability.
We have analysed photometric data, obtained with the STEREO spacecraft, of 558 stars listed in the Renson & Manfroid (2009) catalogue as known or suspected CP1/3 objects and identified 44 variable stars from which 35 were previously unknown. This catalogue is the most comprehensive available, although the collected observations are rather inhomogeneous and little is known of many of the stars in our sample. It is therefore important to constrain which stars are constant, within our detection limits, in order to focus immediate future efforts on the variable stars. Therefore, although 399 stars were clearly constant or the data were of insufficient quality or quantity for analysis, 115 stars are also listed that were examined in as much detail as the 44 variable stars. In some cases, weak signals were observed at low statistical significance, or systematic effects may have prevented the detection of low-amplitude variability; however, many appear also to be constant within the sensitivity of STEREO/HI-1. These stars may be constant, or variable with an amplitude below the sensitivity of STEREO/HI-1, variable with a periodicity outside the range 0.1–10 d, variable in a part of the spectrum which STEREO/HI-1 is not sensitive to or rotational variables seen pole-on.
2 OBSERVATIONS AND DATA ANALYSIS
In the following, we give a short overview of the observations and the applied data analysis. This should serve as a guideline for the understanding of the apparent limitations of the result. For further details, the reader is referred to the description in WFN12.
The observations were obtained by the twin STEREO spacecraft using the Heliospheric Imager cameras (STEREO/HI-1A and STEREO/HI-1B).
Each image has a field of view of 20° × 20° with a pixel scale of 70 arcsec pixel−1, centred 14° away from the Sun's limb. A single filter, with a spectral response mostly between 6300 and 7300 Å, is used. The integration time was 40 s with a summed image cadence of 40 min. In general, an object remains in the field of view of the STEREO/HI-1A/B imagers for 19/22 d. In summary, each data set covers a total span of four and a half years, with about 20 d continuous observations per HI camera, and gaps of about 1 yr.
The light curves were cleaned by removing all data points more than four standard deviations away from the weighted mean magnitude. Polynomial detrending is then carried out using a fourth-order polynomial in order to correct for any existing residual trends.
The time series analysis was performed in several stages. First, synthetic light curves are constructed and the least-squared error of the model compared to the actual light curve is measured. Then the period and amplitude was iteratively determined. The periodograms and light curves were visually inspected, primarily to extract from the sample the objects which appeared clearly constant. Additionally, we classified as constant those stars which were so faint that any signal would be likely due to noise or if systematic effects were so extreme that the data were unusable. The same classification was given to the stars for which the lack of data prevented the reliable detection of any variability. The list of those 399 stars is given in Table 1.
Basic properties of the CP1 and CP3 stars identified as constant or for which the quality of the data prevented the detection of any variability.
| Name | # R09 | RA | Dec | V | Spectral | CP | υsin i |
|---|---|---|---|---|---|---|---|
| (°) | (°) | (mag) | type | class | (km s−1) | ||
| HD 294 | 20 | 1.91666 | 1.09421 | 8.25 | A0,NA | CP1 | |
| HD 1169 | 230 | 4.02257 | 8.11554 | 7.60 | A8–F2,NA | CP1 | |
| HD 3644 | 985 | 9.78988 | −3.99267 | 8.91 | A0–A7,NA | CP1 | |
| HD 4570 | 1230 | 11.91140 | −4.49765 | 9.34 | A2–F1,NA | CP1 | |
| HD 11386 | 2850 | 28.01060 | 10.81060 | 7.70 | A7–F2,NA | CP1 | |
| HD 11636 | 2970 | 28.66000 | 20.80800 | 2.64 | A4,NA | CP1 | 71.6(4.0/4) |
| HD 12869 | 3280 | 31.64140 | 22.64830 | 5.03 | A1–A7,NA | CP1 | 15.0(7.1/2) |
| HD 13248 | 3440 | 32.44400 | 13.17580 | 7.72 | A0,NA | CP1 | |
| HD 14688 | 3680 | 35.63830 | 16.87030 | 6.79 | A0,NA | CP1 | 55.0(8.3/1) |
| HD 15385 | 3870 | 37.30700 | 23.46900 | 6.19 | A5–F1,NA | CP1 | 22.8(5.8/3) |
This table in its complete form is only available online.
The final stages of the detailed analysis were done with peranso.1 Two algorithms were applied, to cross-check each other and avoid duplicating weaknesses. In each case, we searched for periods between 0.1 and 10 d, although in a few individual cases a search was made outside this range. The Lomb–Scargle method (Scargle 1982) was employed in the period domain, whereas the phase dispersion minimization (PDM) method (Stellingwerf 1978) was employed in the frequency domain. The latter are using Θ, defined in Stellingwerf (1978), which gives a direct indication of the significance of a certain period. We then examined the significant features in the periodogram produced with each method to extract the most likely period, its uncertainty and the epoch of the first maximum in the STEREO light curve.
3 RESULTS
As a result, we obtained
399 stars without a reliable detection (Table 1),
115 constant stars (Table 2) and
44 variable stars (Table 3).
Basic properties of the CP1 and CP3 stars identified as constant or probably constant after the individualized analysis. The relevant references are given at the end of Table 3.
| Name | # R09 | RA | Dec. | V | Spectral | CP | Period | σperiod | Analysis | Literature | υsin i |
|---|---|---|---|---|---|---|---|---|---|---|---|
| (°) | (°) | (mag) | type | class | (d) | (d) | remarks | period | km s−1 | ||
| HD 1651 | 355 | 5.20745 | −0.87109 | 9.28 | A6–A9,NA | CP1 | 1.3231 | 0.0004 | W | S11:0.066 | |
| BD+06 63 | 720 | 8.06457 | 6.92384 | 9.91 | A0,NA | CP1 | B | ||||
| HD 9862 | 2430 | 24.10950 | 3.78577 | 8.66 | A2,NA | CP1 | C | ||||
| HD 23325 | 5940 | 56.27720 | 24.26350 | 8.70 | A4–F0,NA | CP1 | B | 75.0(11.3/1) | |||
| HD 23408 | 6000 | 56.45670 | 24.36780 | 3.87 | B7,He-weak,Mn | CP3 | BS | 35.8(2.3/4) | |||
| HD 23924 | 6126 | 57.42050 | 23.34160 | 8.13 | A3–A7,NA | CP1 | B | 80.0(12.0/1) | |||
| HD 27045 | 6910 | 64.31530 | 20.57860 | 4.92 | A3–F3,NA | CP1 | B | 69.0(7.1/2) | |||
| HD 27429 | 7046 | 65.10460 | 18.74260 | 6.09 | F2,Cr,Sr | CP1? | C | 145.0(21.8/1) | |||
| GSC 02390−01591 | 8829 | 79.98280 | 30.38030 | 10.70 | A3,NA | CP1? | 2.3503 | 0.0012 | BW | ||
| HD 242858 | 8916 | 80.49290 | 29.80600 | 9.73 | A2,NA | CP1? | C |
This table in its complete form is only available online.
Properties of the CP1 and CP3 stars identified as photometrically variable.
| Name | # R09 | RA | Dec. | V | Spectral | CP | Period | σperiod | MJD | Analysis | Literature | υsin i | Teff | log L/L⊙ | M/M⊙ | τ |
|---|---|---|---|---|---|---|---|---|---|---|---|---|---|---|---|---|
| (°) | (°) | (mag) | type | class | (d) | (d) | maximum | remarks | period | (km s−1) | (K) | (dex) | ||||
| HD 2523 | 600 | 7.28586 | 11.32020 | 8.10 | A8–F2,NA | CP1 | 0.5668 | 0.0001 | 54167.607 | B | 7050(–/1) | 0.77(0.11) | 1.51(0.06) | 0.37(0.29) | ||
| HD 7374 | 1850 | 18.53180 | 16.13350 | 5.97 | B9,Si,Hg,Mn | CP3 | 2.8240 | 0.0019 | 54187.360 | B | C98:2.8 | 24.2(0.8/4) | 12 811(68/4) | 2.18(0.10) | 3.40(0.15) | 0.31(0.25) |
| HD 21437 | 5350 | 52.00580 | 20.46430 | 6.89 | A3–F3,NA | CP1 | 0.7981 | 0.0002 | 54208.748 | B | ||||||
| HD 23607 | 6050 | 56.83060 | 24.13910 | 8.28 | A4–F2,NA | CP1 | 1.8526 | 0.0007 | 54213.398 | BS | S09+W:0.047 | 10.0(1.5/1) | 7981(91/3) | 2.16(0.45) | ||
| HD 23950 | 6130 | 57.47950 | 22.24410 | 6.07 | B9,Si,Hg,Mn | CP3 | 3.2509 | 0.0020 | 54216.059 | B | C98:1.1 | 82.5(3.8/4) | 12 504(245/4) | 1.97(0.11) | 3.11(0.17) | 0.03(0.18) |
As mentioned in Section 2, Table 1 lists all stars that were immediately classified as constant, but it also includes stars for which the photometry was clearly affected by systematic effects and/or by blending, making the detection of any periodicity impossible. Table 2, on the other hand, includes all stars for which our analysis did not identify the presence of variability.
Each table lists
column 1: star name,
column 2: identification number by Renson & Manfroid (2009),
columns 3 and 4: equatorial coordinates in degrees,
column 5: average V magnitude,
column 6: spectral classification and chemical peculiarity given by Renson & Manfroid (2009) and
column 7: CP classification.
The derived CP classification is a combination of the catalogue of Ap, HgMn and Am stars by Renson & Manfroid (2009) as well as the extensive list of spectral types by Skiff (2012). If contradicting classifications within these references were found, a question mark was set.
Table 3 lists the variable objects:
columns 8 and 9: genuine period and its uncertainty;
column 10: MJD of the epoch for the first recorded maximum;
column 11: flag indicating the possible presence of blending (B), systematic (S) effects or an exceptionally strong signal (‘*’; see WFN12, for more details);
column 12: period found in the literature with reference.
For each star in this table, we generated a classical periodogram using the PDM method (Fig. 6, online only) and a phase-folded light curve (Fig. 7, online only). We use Θ as a direct indication of the periods’ significance.
4 DISCUSSION
Recently, Smalley et al. (2011) presented SuperWASP photometric data of 1600 CP1 stars at a precision level of 1 mmag. They found about 200 objects which where identified as pulsating δ Scuti, γ Doradus and/or hybrids. Their target selection criteria were substantially similar to ours. We cross-matched the two samples and identified 36 objects for which we were not able to derive any variability, eight stars which we classified as constant, and one common variable. We further investigated the reason for the apparent inconsistency. Fig. 1 shows the periods versus the amplitudes for those 44 objects. Most of these stars have periods and amplitudes below our instrumental sensitivity. However, we also looked for very short period variability by extending the period search down to 0.064 d when using the Lomb–Scargle method and further to 18/d when using PDM. As a result, our periodograms are mostly featureless not showing any significance.
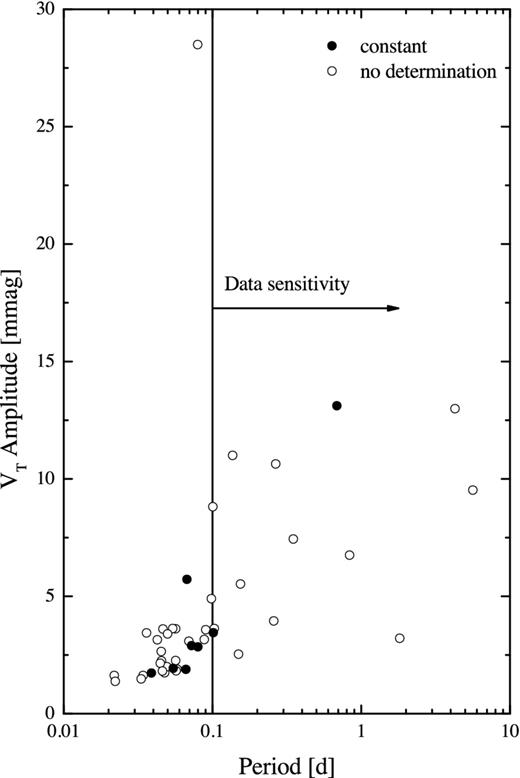
Periods and amplitudes of 44 variables identified by Smalley et al. (2011) for which no significant frequency was found in this work.
In the context of the CP1 stars we analysed, the signal for TYC 1876-325-1 (0.1038 d) is the only one where the weak signal found seems likely to have originated in the target star, while the weak signals for HD 243093 (2.8426 d) and HD 146053 (1.2202 d) seem more likely to have originated in a neighbouring star, although neither of these two stars has a variable star recorded in their vicinity. If we compare the signals extracted for these two stars with those recorded as such in WFN12, only the signal from HD 146053 might be strong enough, but the likelihood of blending discouraged us from reporting it.
Fig. 2 shows the γ Doradus stars published by Smalley et al. (2011) and our variables in the temperature–period domain. As a temperature limit for the γ Doradus domain, we adopted log Teff < 3.9, which also includes all types of hybrid pulsators (Balona et al. 2011). Stars hotter than that are most certainly not members of this variable star group. The amplitudes of the γ Doradus type pulsation in that paper (fig. 6 therein) are found to be up to 25 mmag. The symbol sizes are proportional to the amplitudes which are all below 25 mmag.
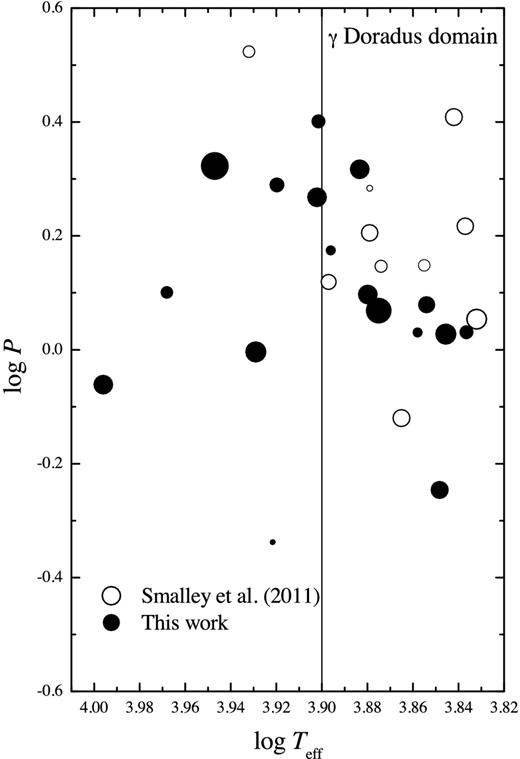
The γ Doradus stars taken from Smalley et al. (2011) and our variables in the temperature–period domain. The symbol sizes are proportional to the amplitudes. Objects which are hotter than log Teff > 3.9 are not pulsators but show variability due to multiplicity.
In the following, we discuss individual stars from Table 3 which deserve special attention.
AAO+23 222, AAO+25 242 and AAO+28 487: The found amplitudes for these stars are between 30 and 41 mmag. Due to the lack of photometric measurements, we were not able to calibrate the effective temperatures for these objects. Even if they fall into the domain of γ Doradus pulsators (Fig. 2), their amplitudes are too large (Balona et al. 2011).
HD 23607: Fox Machado et al. (2006) analysed the pulsational characteristics of this Pleiades member in more details. In 1997, a STEPHI campaign was dedicated to this star. Up to now, no long-term variations have been reported in the literature. Our deduced period of 1.8526 d is compatible with an orbit due to undetected multiplicity or γ Doradus pulsation. However, the periodogram shows numerous frequencies shorter than 1 d supporting hybrid δ Scuti–γ Doradus characteristics. HD 23607 lies just on the edge (Fig. 2) where these objects can be found.
HD 23950: This star has the highest υsin i of all objects among our variable sample with 82.5 ± 3.8 km s−1. Winzer (1974) published a period of 1.1 d which was flagged with a question mark. Our time series analysis results in a period of 3.2509 d. As described in WFN12, we calculated the equatorial velocity (Veq) from the formula of the oblique rotator model on the basis of Teff and log L/L⊙. Taking the above-mentioned periods, we get Veq of ∼95 and ∼32 km s−1, respectively. In contrast to the shorter period, the longer period is clearly not compatible with the oblique rotator model and could be interpreted as an SPB characteristics.
HD 27628: A well-known δ Scuti type pulsator (V775 Tau) and member of the Hyades (Perryman et al. 1998). The orbital period published by Griffin (2012) is twice the variability we derived from the STEREO data.
HD 31592, HD 39078 and HD 104321: These stars have periods between approximately 1 and 2 d, but are too hot for being γ Doradus pulsators.
HD 42066 and HD 56152: For each star, we detected two clear frequencies in the domain of the γ Doradus pulsators. However, both stars are too hot (Fig. 2), and the amplitude for HD 42066 is too large for such kind of variability. This might be a sign of long-period pulsations in close binaries which are tidally excited (Handler et al. 2002). These two stars are, therefore, very interesting targets for spectroscopic follow-up observations in order to get radial velocity data.
HD 49606: We find a period of 2.2661 d, whereas in the literature values of 1.10503 and 3.35 d are published. From our periodogram, we conclude that the shorter period does not seem to be present, but there are several peaks around 3.3 d, although they are less significant than the ones listed in Table 3.
HD 122911, HD 144844, HD 202671 and HD 211838: For these objects, we found at least one frequency typical for δ Scuti and one for γ Doradus type pulsation. Therefore, these objects might be hybrid pulsators.
HD 138124: With two detected clear frequencies, we conclude that this object is a γ Doradus pulsator.
HD 244698: Smalley et al. (2011) published two δ Scuti like frequencies with amplitudes of 1.35 and 1.69 mmag, respectively. Its periodogram shows also some very low amplitude frequency in the range where we find a significant period of 0.9993 d. However, the Θ value is just on the detection limit.
In order to locate the variable stars from Table 3 in the Hertzsprung–Russell (HR) diagram, we compiled Johnson UBV, Strömgren and Geneva photometry from the General Catalogue of Photometric data (Mermilliod, Mermilliod & Hauck 1997). These data were used to derive the effective temperature on the basis of the calibrations given by Netopil et al. (2008). The final Teff, listed in Table 3, is the average Teff obtained calibrating the different colours, while the standard deviation and the number of averaged temperature values are given in parentheses. When available, we adopted the spectroscopic Teff listed in Netopil et al. (2008), and these cases are indicated with a ‘99’ instead of the number of averaged temperatures. Similarly to WFN12, also a spectral energy distribution (SED) fitting was performed in order to obtain an additional temperature estimate. However, no correction was applied since CP1/3 objects do not show anomalous colours. The stars, for which the latter method was the only possibility to deduce reddening, are flagged with ‘50’ in the Teff column of Table 3 (see WFN12, for details).
If available, parallaxes from the Hipparcos catalogue (van Leeuwen 2007) were used to determine the luminosity (log L/L⊙) on the basis of the Johnson V magnitude and the interstellar reddening E(B − V) determined via the different photometric systems or via SED fitting, using a total-to-selective absorption ratio of R =3.1. Since, according to Netopil et al. (2008), the bolometric correction for CP1/3 stars do not differ from normal ones, we used the tabulated corrections listed by Flower (1996). As next step, we determined the stellar mass and fractional age (τ – fraction of main-sequence lifetime completed) using the evolutionary tracks for solar metallicity given by Schaller et al. (1992).
Fig. 3 shows the final HR diagram for all stars listed in Table 3 and for which we derived both Teff and log L/L⊙. The two CP groups are clearly distinct according to their Teff. All, but two objects, HD 85040 and HD 104321, lie well between the ZAMS and TAMS. We have investigated the two outliers in more details.
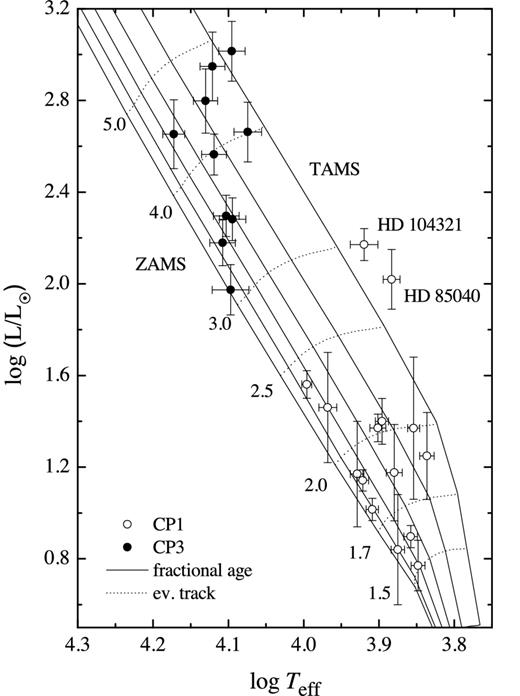
Hertzsprung–Russell diagram for the CP1 (open circles) and CP3 (filled circles) stars listed in Table 3 and for which we derived both Teff and log L/L⊙. The solid lines represent the lines of equal fractional age. The dashed lines are the main-sequence evolutionary tracks for solar metallicity (Schaller et al. 1992) used to derive the stellar masses. Two objects, HD 85040 and HD 104321, lie above the TAMS.
HD 85040: Frémat, Lampens & Hensberge (2005) analysed this spectroscopic triple system using a disentangling technique to extract the individual contributions of the three components to the composite spectrum. The inner binary consists of two Am components, whereas the distant third component is confirmed to be a δ Scuti star with normal chemical composition. We report the detection of three periods of which two (0.0834 and 0.0881 d) are from the pulsational component. The third one (2.0735 d) is half the orbital period. Frémat et al. (2005) estimated that all three components have almost the same effective temperature of 7500 K and equal luminosities. Taking this into account in our HR diagram, this object shifts down to the two solar mass evolutionary track.
HD 104321: This spectroscopic binary system has a mass ratio of about 0.47, m1 = 2.2 M⊙ and an orbital period of about 283 d (Ducati, Penteado & Turcati 2011). Shorlin et al. (2002) derived a photometric log g of 3.51, which is compatible with our estimates. Thus, this system seems to be located close to the TAMS. In addition, we checked the SED with the tool by Robitaille et al. (2007). Fig. 4 shows the flux distribution according to the photometric measurements overplotted with the corresponding stellar atmosphere model. The best fitted effective temperature of 8000 K is in perfect agreement with the estimates from all different photometric systems. At 4.6 μm, a bump exceeding 3σ of the listed photometric error (Wright et al. 2010) can be found which might be due to the companion.

The SED of HD 104321 shows a bump at 4.6 μm larger than 3σ of the listed photometric error (Wright et al. 2010), which could be due to a cool companion.
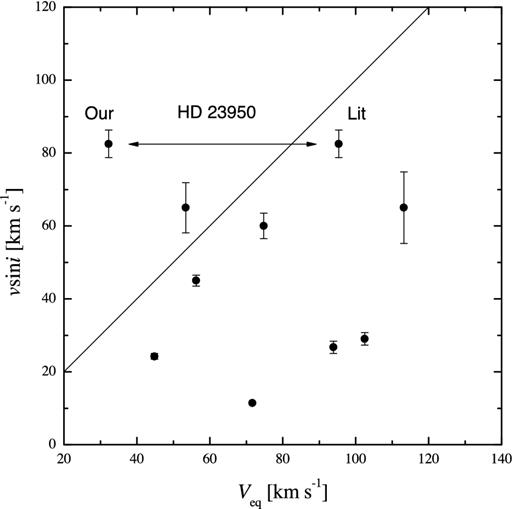
Comparison between the observed υsin i and the computed Veq for the stars listed in Table 3. The continuous line is the one-to-one relationship. According to the oblique rotator model, all stars should fall below the given relation. For HD 23950, we plotted the values using our estimates and the period from the literature.
5 CONCLUSION
We present a detailed time series analysis of photometric data for 558 CP1/3 stars obtained with the STEREO spacecraft. 44 stars were found to be variable, 35 of which were not previously known as such. The new variables range in brightness 4.7 < V < 11.7 and are therefore particularly interesting for follow-up observations. Several show multiple signals indicative of hybrid δ Scuti and γ Doradus pulsation. These bright variable stars will allow for more detailed study of stellar structure and evolution. Of particular interest are the variable members of open clusters (e.g. HD 23607) where age, metallicity, luminosity and therefore mass can be more tightly constrained.
The period range of the variability we detected among the CP1 stars is compatible with that expected for δ Scuti and γ Doradus pulsators. In addition, some already known orbital periods were also photometrically detected.
For the CP3 stars, the periodicity of SPB stars is in the same range as that of the known binary systems; therefore, a decision about the type of variability was not possible, and further observations are needed. However, Renson & Catalano (2001) list 16 variable CP3 stars. With our sample of seven new ones, we significantly increase the number of known variables of this subgroup.
The identification of constant stars, within the sensitivity of STEREO/HI-1, is also useful for further analysis, as these stars might be constant, or variable with an amplitude below the sensitivity of STEREO/HI-1, or variable with a periodicity outside the 0.1–10 d range, or variable in a part of the spectrum that the STEREO/HI-1 is not sensitive to, or rotational variables seen pole-on. It is important to constrain the nature of constant CP1/CP3 stars to support further investigations, e.g., suggesting that future observations may require higher cadence to observe suspected δ Scuti variability, or that observations must take place over longer continuous periods to detect long-period rotational variability.
The presented sample of constant and variable CP1/3 stars could serve not only for detailed follow-up observations, but also for the analysis of time-dependent changes of pulsational and rotational periods (Breger 2009). Long time basis and continuous observations over many decades are very much needed to shed more light on pulsational characteristics of these objects. Such bright variable stars are of great value in advancing studies of stellar structure and evolution, as these can be studied in great detail with little observational effort.
The Heliospheric Imager (HI) instrument was developed by a collaboration that included the Rutherford Appleton Laboratory and the University of Birmingham, both in the UK, and the Centre Spatial de Liége (CSL), Belgium, and the US Naval Research Laboratory (NRL), Washington DC, USA. The STEREO/SECCHI project is an international consortium of the Naval Research Laboratory (USA), Lockheed Martin Solar and Astrophysics Lab (USA), NASA Goddard Space Flight Center (USA), Rutherford Appleton Laboratory (UK), University of Birmingham (UK), Max-Planck-Institut für Sonnensystemforschung (Germany), Centre Spatial de Liége (Belgium), Institut d’Optique Théorique et Appliquée (France) and Institut d’Astrophysique Spatiale (France). This research has made use of the Simbad data base, operated at CDS, Strasbourg, France. This research has made use of version 2.31 peranso light curve and period analysis software, maintained at CBA, Belgium Observatory (http://www.cbabelgium.com). KTW acknowledges support from an STFC studentship. This work was supported by grant GA ČR P209/12/0217, the financial contributions of the Austrian Agency for International Cooperation in Education and Research (CZ-10/2012) and the Austrian Research Fund via the project FWF P22691-N16. We thank M. Hareter and O. Kochukhov for valuable discussions.
Data obtained with the Heliospheric Imager instruments on-board the STEREO spacecraft.
REFERENCES
Supporting Information
Additional Supporting Information may be found in the online version of this article:
Table 1. Basic properties of the CP1 and CP3 stars identified as constant or for which the quality of the data prevented the detection of any variability.
Table 2. Basic properties of the CP1 and CP3 stars identified as constant or probably constant after the individualized analysis. The relevant references are given at the end of Table 3.
Table 3. Properties of the CP1 and CP3 stars identified as photometrically variable.
Figure 6. Periodograms obtained for the CP1/3 stars, listed in Table 3.
Figure 7. Periodograms obtained for the CP1/3 stars, listed in Table 3 (Supplementary Data).
Please note: Oxford University Press are not responsible for the content or functionality of any supporting materials supplied by the authors. Any queries (other than missing material) should be directed to the corresponding author for the article.
