


Objective: Hospital-acquired pressure ulcers (HAPUs) have a mortality rate of 11.6%, are costly to treat, and result in Medicare reimbursement penalties. Medicare codes HAPUs according to Agency for Healthcare Research and Quality Patient-Safety Indicator 3 (PSI-03), but they are sometimes inappropriately coded. The objective is to use electronic health records to predict pressure ulcers and to identify coding issues leading to penalties.
Materials and Methods: We evaluated all hospitalized patient electronic medical records at an academic medical center data repository between 2011 and 2014. These data contained patient encounter level demographic variables, diagnoses, prescription drugs, and provider orders. HAPUs were defined by PSI-03: stages III, IV, or unstageable pressure ulcers not present on admission as a secondary diagnosis, excluding cases of paralysis. Random forests reduced data dimensionality. Multilevel logistic regression of patient encounters evaluated associations between covariates and HAPU incidence.
Results: The approach produced a sample population of 21 153 patients with 1549 PSI-03 cases. The greatest odds ratio (OR) of HAPU incidence was among patients diagnosed with spinal cord injury (ICD-9 907.2: OR = 14.3; P < .001), and 71% of spinal cord injuries were not properly coded for paralysis, leading to a PSI-03 flag. Other high ORs included bed confinement (ICD-9 V49.84: OR = 3.1, P < .001) and provider-ordered pre-albumin lab (OR = 2.5, P < .001).
Discussion: This analysis identifies spinal cord injuries as high risk for HAPUs and as being often inappropriately coded without paralysis, leading to PSI-03 flags. The resulting statistical model can be tested to predict HAPUs during hospitalization.
Conclusion: Inappropriate coding of conditions leads to poor hospital performance measures and Medicare reimbursement penalties.
INTRODUCTION
Pressure ulcers pose a critical challenge for US hospitals, as they are fatal to patients. Data from the Healthcare Cost Utilization Project indicate 11.6% of patients die from hospital-acquired pressure ulcers (HAPUs) and related causes, and academic medical centers witness a HAPU mortality rate of 4%.1,2 According to Lyder et al.,3 4.5% of Medicare patients develop HAPUs.
HAPUs are costly to treat, in the range of $500–150 000, which has led to several payment reforms.4 In 2008, the Centers for Medicare and Medicaid Services (CMS) revised its Inpatient Prospective Payment System to reduce reimbursement for hospital stays associated with several hospital-acquired conditions including HAPUs, thus placing the economic burden of prevention and treatment on hospitals.5,6 Now, hospitals in the lowest quartile of composite rates of HAPUs and other conditions are penalized 1% of CMS payments.7 CMS measures HAPU rates according to Agency for Healthcare Research and Quality (AHRQ) Patient-Safety Indicator 3 (PSI-03), which includes stages III, IV, and unstageable pressure ulcers not present on admission, and excludes certain diagnoses that present complex case management such as paralysis.8 CMS penalties have largely motivated hospital informatics to improve coding accuracy of HAPUs in order to show performance improvement associated with decreasing PSI-03 flags. More importantly, the field of hospital informatics is spending more time problem solving for the prevention of HAPUs in partnership with clinicians in order to avoid PSI-03 flags.
To prevent HAPUs, clinicians use a set of evidence-based prevention guidelines that have been shown to effectively reduce PSI-03 cases since CMS penalties were put into place.9–11 However, Meddings and colleagues researched patient record coding as the key to CMS determination of a PSI-03 flag, and there is no guidance in the prevention guidelines for how to restructure hospital informatics to address this concern.12,13 As improvement studies have previously used administrative data to analyze HAPU outcomes, changes in coding accuracy could not be quantified. Access to patient record data would improve our understanding of coding accuracy and bridge solutions through informatics divisions.14
The objectives of this study were 2-fold. The first was to develop a statistical model for predicting high-risk HAPU patients. This model could be integrated with hospital informatics to alert clinicians to initiate patient-centered guidelines. The second was to determine reasons for inaccurately coded patients for PSI-03. This study used an academic medical center’s clinical data repository to identify coding issues that lead to inappropriate flags for PSI-03 and develop a regression model of predictors of HAPU incidence.
METHODS
Clinical data of hospitalized patients from a tertiary care academic medical center were used to predict the development of HAPUs. Data were managed longitudinally by patient encounter to identify HAPUs based on inclusion and exclusion criteria according to PSI-03. Given the high dimensionality of these data, mining techniques reduced the number of variables to a manageable subset. Predictive models were then derived by regressing PSI-03 HAPUs according to identified variables using multilevel logistic regression.
Data management
Following Institutional Review Board (IRB) approval from the University of Chicago, de-identified data were extracted from the clinical research data warehouse of an Epic®-based electronic health record (EHR) system at an urban tertiary care academic health system covering 2 contiguous hospitals with over 1400 secondary and tertiary care providers. This data warehouse is uniquely designed to perform patient-centered outcome research and address issues related to hospital informatics.15 The data represent 2 contiguous hospitals with 567 beds and 2 certified wound, ostomy and continence nurses. The dataset comprised over 97 000 encounters of 34 787 patients between January 2011 and December 2014. The dataset included encounter-level data on age, 12-hour updated Braden scores and subscores, pharmacy prescriptions, physician-ordered laboratory procedures, and discharge diagnosis codes. Each of these data elements was managed in Structured Query Language (SQL) as a separate table in order to create a panel dataset of patient encounters and conduct longitudinal data analysis on HAPU incidence by encounter.16
Study population
PSI-03 (version 3.2) criteria were applied to the study population to measure HAPU incidence and reduce the sample size.8 The inclusion criteria of a HAPU case was a secondary diagnosis of a stage III, IV, or unstageable pressure ulcer (ICD-9 707.23–707.25).17 The sample included all hospitalized patients between 2011 and 2014 with 2 or more Braden scores and at least 5 days length-of-stay. Cases excluded from the sample were the following: a primary or secondary pressure ulcer diagnosis present on admission; MDC 9 (skin condition); MDC 14 (pregnancy); diagnosis of hemiplegia, paraplegia, quadriplegia (ICD-9 342–344); spina bifida (ICD-9 741); pedicled graft or debridement (ICD-9 867); transfer between facilities; and < 5 days length-of-stay. Complications such as spinal cord injury and bed confinement were not published exclusion criteria for PSI-03.
Braden Scale classification
The Braden Scale is a predictively valid instrument for assessing patient pressure ulcer risk.18,19 Braden score data in the EHR were measured continuously from a score of 6 (very high risk) to 23 (lowest risk). These total scores are the sum of 6 subscores ranging from 1 (poor) to 3 or 4 (not problematic): Sensory Perception (1–4), Moisture (1–4), Activity (1–4), Mobility (1–4), Nutrition (1–4), and Friction and Shear (1–3). Means, variances, minimums, and maximums of total score and subscores were calculated for each patient encounter to test as HAPU predictors.
In 2015, the study site received Magnet accreditation from the Association of Nursing Credentialing Centers (ANCC), implying that nurses carefully monitored Braden scores for internal validation and inter-rater reliability, as well as cross-referenced quarterly HAPU prevalence with surveillance data.20
Data dimension reduction
Data analytic techniques according to James et al. were referenced in reducing the dimensions of the dataset.21 There were over 7000 potential predictors of HAPUs from the EHR, of which 30–60 covariates would be targeted for a statistical model. We hypothesized that Braden Scale total scores and subscores would be used in the model. Additionally, random forests regressed other predictive covariates of HAPUs from each table (i.e., age, discharge diagnoses, prescription drugs, and laboratory orders) by weighting the accuracy of parameters relative to the correlation of patients diagnosed with PSI-03.
Longitudinal data analysis
A multilevel (i.e., mixed-effects) logistic regression model was used to analyze the selected variables from the dimension reduction step in terms of the dichotomous outcome, HAPU incidence according to PSI-03 (Equation 1). This model included a random subject intercept to account for the correlation introduced by clustering of encounters within patients. The random subject intercept also allowed for between-patient variation in HAPU risk, especially in circumstances where a patient may have had HAPUs during multiple encounters.22
Legend: i = patient, j = encounter, Rx = prescription drug class, Dx = discharge diagnosis code, Lab = provider laboratory order code, β = beta coefficient, u = patient-level random effect. Age is continuous.
Model selection was based on likelihood-ratio tests. The final model was restricted to only those predictors that were statistically significant. Intraclass correlation was calculated to characterize the degree of dependence within subjects in HAPU incidence. We presented population-averaged estimates of the fixed effects in the model.22 The final model was then used to identify high-risk subgroups of interest within the sample. Computations were performed using SuperMix (Scientific Software International, © 2014).
RESULTS
From the dataset, we mined a population of 21 153 patients, encountering 34 536 hospitalizations since 2011 from an initial sample of 94 745 encounters (Table 1). Each of these patient encounters met the inclusion and exclusion criteria of PSI-03. Patients also required at least 2 Braden Scale assessments to be eligible for the study. Of these encounters, there were 1549 encounters defined by PSI-03, 311 of which were among patients with previously recorded incidents of a HAPU. These HAPUs occurred at a rate of about 4.5%, which is comparable to the national average.3
Study population
| Characteristic | N | Minimum | Median | Mean | Maximum |
|---|---|---|---|---|---|
| Patients | 21 153 | ||||
| Encounters | 34 536 | ||||
| Age | 18 | 58 | 56.6 | 108 | |
| Length of stay | 5 | 14 | 19.8 | 334 | |
| Average Braden score (between encounters) | 6 | 19.6 | 18.7 | 23 | |
| Pressure ulcers (stages III, IV, and unstageable) | 1549 | ||||
| Age | 18 | 66 | 64.5 | 100 | |
| Average Braden score (between encounters) | 7 | 14 | 14.1 | 22 |
Most patients in the sample were relatively older age and hospitalized for 2 weeks or more. The average Braden score observed in the population fell into the lowest risk category (scored 18–23). However, patients with HAPUs had Braden scores 1–2 categories of risk lower than average during their encounter, and the average score between encounters was a 14. In other words, patients often experienced acute episodes of illness that resulted in their hospitalization. These acute episodes likely began with very low Braden scores, and, on average, crossed the threshold of the median Braden score of 14 into a safer margin prior to discharge.
Longitudinal data analysis
The results of the final multilevel logistic regression model are presented in Table 2. According to the model, a patient’s history of previous HAPUs played a statistically significant role (ICC = 43%; P < .05) for being predisposed to additional skin complications during a proceeding encounter.
Population averages of odds ratios of multilevel logistic regression for predictive covariates on hospital-acquired pressure ulcers
| Class | Variable | OR (95% Confidence- interval) | P-value |
|---|---|---|---|
| Intercept | 1.375 (0.7865–2.404) | .264 | |
| Age | 1.022 (1.0172–1.0271) | <.001 | |
| Braden scores | Mobility (mean) | 0.722 (0.6175–0.8434) | <.001 |
| Nutrition (mean) | 1.487 (1.2997–1.7011) | <.001 | |
| Friction and Shear (mean) | 0.552 (0.4339–0.7009) | <.001 | |
| Friction and Shear (minimum) | 0.264 (0.1963–0.3552) | <.001 | |
| Friction and Shear (variance) | 0.789 (0.6643–0.9362) | .007 | |
| Total Score (minimum) | 1.099 (1.0533–1.1462) | <.001 | |
| Total Score (maximum) | 0.841 (0.8092–0.8748) | <.001 | |
| Provider- ordered labs | Bronchoscopy | 1.543 (1.026–2.3198) | .037 |
| Culture, stool | 1.530 (1.1637–2.0107) | .002 | |
| Urinalysis chemistry screen | 1.263 (1.0768–1.4805) | .004 | |
| Lipid panel | 0.771 (0.6357–0.9355) | .008 | |
| Pre-albumin | 2.469 (2.1333–2.8569) | <.001 | |
| Prescription drugs | Phosphate replacement | 1.397 (1.2065–1.6173) | <.001 |
| Electrolyte maintenance | 0.716 (0.6004–0.8532) | <.001 | |
| Antifungal agents | 2.204 (1.8796–2.5834) | <.001 | |
| Erythropoiesis-stimulating agent | 2.095 (1.7096–2.5678) | <.001 | |
| Analgesics, narcotics | 1.400 (1.1625–1.6861) | <.001 | |
| Diagnoses | ICD-9 907.2: Spinal cord injury | 14.316 (8.0836–25.3516) | <.001 |
| ICD-9 272.4: Hyperlipidemia | 1.387 (1.1718–1.6408) | <.001 | |
| ICD-9 V49.84: Bed confinement | 3.144 (1.6422–6.0171) | .001 | |
| Variance (intercept)* | 2.319 | <0.001 | |
| Log-likelihood | −4038.5 |
*Likelihood ratio (LR) tests of fixed effects vs random subject intercept model illustrated that there was significant variance explained by the between-cluster effect of patients on HAPU incidence (X2 = 236.2; p > 0.001).
Covariates with the greatest marginal effects on increased HAPU risk included: (1) order of a pre-albumin lab, (2) prescribed antifungal agents or erythropoiesis-stimulating agents, (3) diagnosis of late-effect spinal cord injury (ICD-9 907.2), and (4) provider-ordered bed confinement (ICD-9 V49.84). These factors increased the OR of HAPU development by a factor of 2 or greater. Remarkably, spinal cord injury increased the OR of a HAPU by 14.3, which would suggest that HAPU cases in this subgroup are relatively imminent.
Some Braden scores and subscores had small but significant marginal effects on HAPU rates. A patient’s mean Nutrition score as well as minimum Total score were predictive of HAPUs. Other Braden scores, such as mean Mobility score, Friction, and Shear score (mean, minimum, and variance), as well as maximum Total score, predicted reductions in HAPU rates.
Subgroup analysis
Model findings led to a tabulation of encounters diagnosed with each of the concerning conditions with or without codiagnosis of PSI-03 (Table 3). The majority of each subgroup had a HAPU, and this represented 27% of the entire cohort of PSI-03 flags. Interestingly, 70 out of 99 diagnosed late-effect spinal cord injuries had a PSI-03 flag. Of the 29 spinal cord injuries without a PSI-03 flag, 25 (86%) were comorbid for paralysis (i.e., hemiplegia, paraplegia, or quadriplegia; ICD-9 342–344). These findings suggest that HAPUs are common and potentially recurring among spinal cord–injured patients. However, while the majority of typical spinal cord injuries appear to be comorbid for paralysis, coders are not codiagnosing these conditions through billing when a HAPU occurs, especially if a patient could be dealing with a long history of acute episodes related to spinal cord injury, which could lead to an inappropriate PSI-03 flag.
Tabulation of AHRQ PSI-03 flags by select diagnoses
| Diagnosis | N | N PSI-03 (%) | |
|---|---|---|---|
| ICD-9 272.4: Hyperlipidemia | 5656 | 334 | 6 |
| ICD-9 907.2: Spinal cord injury | 99 | 70 | 71 |
| ICD-9 V49.84: Bed confinement | 49 | 26 | 53 |
| Total | 5804 | 430 | 28a |
| Diagnosis | N | N PSI-03 (%) | |
|---|---|---|---|
| ICD-9 272.4: Hyperlipidemia | 5656 | 334 | 6 |
| ICD-9 907.2: Spinal cord injury | 99 | 70 | 71 |
| ICD-9 V49.84: Bed confinement | 49 | 26 | 53 |
| Total | 5804 | 430 | 28a |
aThis value represents the percent relative to the total HAPU count of 1549 cases.
Validation
Population average estimates of the multilevel model were compared with estimates of the model using a 50% random sample in order to determine whether the model was reproducible given a specific patient population. The results suggested that the coefficients and clustering effects were generally similar in value for samples of the study population (Table 4).
Cross-validation of model with a 50% random sample of EHR data shows the model is fairly robust to different cohorts based on similar population-average estimates
| Model: | Full dataset | 50% random sample |
|---|---|---|
| Variable | Estimate | Estimate |
| Intercept | 0.319 | 1.206 |
| Age | 0.022 | 0.020 |
| Mobility (mean) | −0.326 | −0.302 |
| Nutrition (mean) | 0.397 | 0.259 |
| Friction & Shear (mean) | −0.595 | −0.528 |
| Friction & Shear (minimum) | −1.332 | −1.492 |
| Friction & Shear (variance) | −0.237 | −0.312 |
| Total score (minimum) | 0.094 | 0.084 |
| Total score (maximum) | −0.173 | −0.164 |
| Bronchoscopy | 0.434 | 0.689 |
| Culture, stool | 0.425 | 0.465 |
| Urinalysis chemistry screen | 0.233 | −0.023 |
| Lipid panel | −0.260 | −0.338 |
| Pre-albumin | 0.904 | 0.948 |
| Phosphate replacement | 0.334 | 0.406 |
| Electrolyte maintenance | −0.335 | −0.371 |
| Antifungal agents | 0.790 | 0.723 |
| Erythropoiesis-stimulating agent | 0.740 | 0.881 |
| Analgesics, narcotics | 0.337 | 0.139 |
| ICD-9 907.2: Spinal cord injury | 2.661 | 2.748 |
| ICD-9 272.4: Hyperlipidemia | 0.327 | 0.161 |
| ICD-9 V49.84: Bed confinement | 1.145 | 0.861 |
| Variance (intercept) | 2.319 | 2.131 |
| Log-likelihood | −4038.5 | −2017.800 |
Bold: Statistically Significant (P < 0.05).
DISCUSSION
For this study, we acquired a vast array of patient-level information about hospitalization to create a predictive model of HAPU cases and identify cases where inappropriate coding could lead to PSI-03 flags. Multilevel logistic regression was used to analyze characteristics of patients’ Braden scores, discharge diagnoses, prescription drugs, and provider laboratory orders to identify the highest-risk cohorts for HAPUs. Using this approach, we identified 3 diagnoses, 4 prescription drugs, 4 provider-ordered labs, and 2 Braden subscores in addition to age as predictively valid covariates of increased HAPU risk using a novel statistical model. Relative to all predictors, these variables had the greatest ORs on HAPU rates: (1) order of a pre-albumin lab, (2) prescribed antifungal agents or erythropoiesis-stimulating agents, (3) diagnosis of spinal cord injury, and (4) provider-ordered bed confinement. Spinal cord injury was the highest associated covariate to HAPU risk (OR = 14.3). These diagnoses present a new understanding of the risk of patients for developing HAPUs that were not previously known, and can be used to reduce avoidable harm.
The Braden Scale offers some predictively valid statistics of Total scores and subscores as well, but with relatively weak marginal effects. These findings both confirm and contradict previous research on the predictive validity of the Braden Scale using less generalizable study designs and smaller sample sizes in acute and long-term care. First, a cohort study by Bergquist surmised that only total scores, and not subscores, accurately predicted HAPUs.23 Second, Lahmann and colleagues24 showed that Braden subscores offered predictively valid insight into HAPU incidence using analytics. Third, Cox identified the Mobility and Friction and Shear subscores as HAPU predictors like in this study, but using a small (n = 347), critically ill retrospective sample.25 Fourth, Cox also concluded that moisture and sensory perception were significant, unlike in this study.26 Fifth, the use of Nutrition in this predictive model contradicts previous findings of lesser rigor suggesting that Nutrition has no predictive validity.27 Ultimately, this study used the largest cohort to model Braden scores as HAPU predictors and expands the applicability of subscores to statistical prediction.
Related to this discussion of the validity of Braden subscores is the model covariate for an ordered pre-albumin lab. Clinicians often cue a pre-albumin order when they are concerned that a patient is malnourished. Given the stronger association between pre-albumin and pressure ulcers than that of the Nutrition subscore for the Braden Scale, this is a particularly useful predictor of patient malnourishment.
The diagnosis of spinal cord injury and HAPU risk in this study is interesting but not surprising given that previous research has correlated these 2 conditions.28 What is surprising is that many of these cases are flagged as PSI-03 as there is no codiagnosis of paralysis in the patient record. Based on findings by McKinley and colleagues,29 it is presumed that large proportions of spinal cord injuries lead to “clinical syndromes” resulting in at least temporary paralysis. AHRQ explicitly left out spinal cord injury diagnosis from the exclusion criteria for PSI-03. This omission may be to insinuate that these pressure ulcers are preventable, especially given the body of literature warning clinicians about the association with spinal cord injury. However, it is unclear whether AHRQ’s position on avoidability is limited to pressure ulcers that develop in patients presenting with “traumatic” (ICD-952.3) or “late effects” (ICD-907.2, used in this study). In any case, one could make the argument that both spinal cord injury subgroups are high risk for hospital-acquired conditions—the former developing risk while the patient is lying on a transfer board following initial spinal cord injury, for instance, and the latter case for patients who are wheelchair bound and therefore a high baseline risk. As observations in this study were not codiagnosed with another condition, such as any form of paralysis, that would have excluded these pressure ulcers from PSI-03, each case is deemed hospital-acquired.
Today, the PSI-03 criteria for defining stages III, IV, or unstageable pressure ulcers not present on admission, excluding cases of paralysis, are important to hospitals, as CMS uses these criteria to penalize hospital payments for high hospital-acquired condition rates, and many other stakeholder organizations of hospital quality (e.g., The Joint Commission, National Quality Forum, Leapfrog, etc.) use PSI-03 to measure performance with respect to HAPU prevention.30,31 These penalties for designated PSI-03 flags can cost hospitals $10 000s per case and increased mortality rates.4 However, this analysis quantifies a risk of HAPUs associated with spinal cord injury that is high enough to be considered unavoidable, which is in fact the stance of the National Pressure Ulcer Advisory Panel (NPUAP).32 Given the view of CMS that these conditions are largely preventable, the premise that an unavoidable HAPU case actually exists is quite paradoxical.5
In response to these findings, AHRQ should exclude spinal cord injury from the PSI-03 flag. Doing so would be a more efficient practice than expecting each hospital to individually restructure its coding, billing, and patient care processes so that codiagnosis of spinal cord injury and paralysis are properly extracted from provider notes. Additional analyses in this study show that the diagnosis of paralysis is common in the majority of spinal cord–injured patients, except when a HAPU appears. Hospitals that take an additional step to correct billing records to reflect cases of spinal cord injury with paralysis would improve composite performance measurements and reduce exposure to CMS penalties. In addition to these considerations, CMS might consider making a payment exception for pressure ulcers concomitant with spinal cord injury.
There is also an opportunity here for advocacy groups of HAPU prevention guidelines, such as the NPUAP to mobilize this information by making providers more aware of consequences of spinal cord injury, bed confinement, etc., on HAPU incidence. A common theme among the highest-risk cases in this study is the apparent impact of mobility, or lack thereof. The latest international guidelines on HAPU prevention published by the NPUAP warn against total bed confinement to prevent HAPUs.33 Providers placing a patient on bed confinement should consider whether that protocol outweighs the potential risk of a HAPU, as well as responding to patients who are immobilized with an intensified protocol to prevent HAPUs. Such steps might include putting the patient into motion sooner or better adherence to repositioning every 2–4 hours. Such protocols could be initialized through a low Braden subscore for mobility or more generally based on diagnosis.
The results of this study note a high intraclass correlation, as 311 patients had repeat HAPU cases. As the NPUAP international guidelines also note, patients with a previous history of these wounds are highly susceptible to HAPUs given the lack of elasticity in scar tissue.33 In contrast to screening for other hospital-acquired conditions such as deep vein thrombosis or pulmonary embolisms, clinical guidelines do not currently incorporate patient history into risk stratification for HAPUs.34 Clinicians may want to routinely screen for a past history of skin breakdown, especially if patients are immobilized, and guidelines should be updated to encourage this line of questioning. Furthermore, patients hospitalized with a history of previous pressure ulcers or similar full-thickness wounds that leave scarring should be cared for with the use of skin care products (e.g., creams and prophylactic dressings) and protocols to reduce friction and shear on healed sites.9
The study has multiple limitations. First, there are inherent considerations about the validity of Braden scores despite ANCC Magnet recognition at the site hospital, as well as the accuracy of HAPU diagnosis using EHR data. Continuing to depend on retrospective patient records for HAPU diagnosis is shown to be not as accurate as prospective surveillance.14 Second, Braden subscores may be collinear with many other model covariates, especially with respect to mobility. Given nurses’ training to respond to Braden scores, more efforts were likely implemented to prevent HAPUs among patients with low scores than patients with these diagnoses who had higher Braden scores. This model should be used in tandem with the Braden Scale and clinical judgment to identify patients that need immediate intervention.35–37
Third, the retrospective nature of accessing these clinical data makes it difficult to verify whether pressure ulcers were truly hospital-acquired or understand why past instances of spinal cord injury were not codiagnosed for paralysis. Since a present-on-admission flag could not be replicated from the clinical data warehouse, the amount of hospital-acquired pressure ulcers may be overestimated. Additionally, though it is statistically more likely that opportunities were missed to codiagnose these conditions that could have reduced the rate of PSI-03 flags, root cause analyses of HAPU cases using prospective data would be an improved approach to pairing this model with a HAPU prevention protocol.38 It remains possible that these patients were coded accurately for spinal cord injury without paralysis, thereby making late-effect spinal cord injury a standalone patient risk factor for HAPUs rather than a coding and billing issue.
Fourth, the generalizability of this model remains unknown to other health systems and patient populations despite sourcing a large dataset and performing internal cross-validation. Models like this one need to be tested at other facilities of different varieties, such as large and small, academic and community, suburban and rural, acute care and skilled nursing, etc. Our reliance on population average estimates helps to extrapolate these results to a broader population, but should be tested for accuracy first.
Fifth, many other factors exist, both within the EHR and unobserved, that may have greater predictive validity than the covariates presented in this model alone, such as information about tissue perfusion. Our data request was limited to the listed classifications of covariates to simplify a complex data management process by as much as possible. The resulting data from this request provided longitudinal information on a patient's care down to the exact minute of the encounter. There were also options to request data on factors such as the period and duration of surgical procedures—we would like to test information such as Diagnosis-Related Group (DRG) procedural in future iterations of this approach. Additionally, unobserved factors in the dataset such as race/ethnicity and sex may have also improved the model, but our IRB protocol limited access to multiple identifying factors at once.
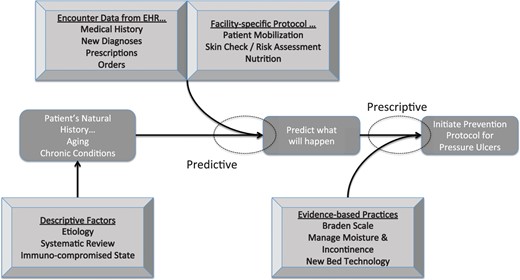
Although having these data can help predict problematic patients who could develop pressure ulcers, it is only the first step in reducing preventable harm. Following the statistical prediction of risk for harm, clinicians need to guide patients through an operational model for prevention, which includes: (1) thinking differently about the effects of spinal cord injury, bed confinement, and other situations that limit mobility; (2) looking for comorbidities in patient records that could change a patient’s risk trajectory; and (3) personalizing strategies to prevent pressure ulcers and treating the condition of the individual patient.39
Using EHR data to predict outcomes, combined with existing interventional literature, creates a smarter, more efficient system of clinical prevention.
Further research should pilot the multilevel model at a sample of academic and community medical centers. This process will challenge facility operations to determine which mechanisms effectively couple this model with an EHR so that providers will respond to notifications of patients with declining health that increases HAPU risk. These models aside, this study provides a replicable method for other facilities to follow to create their own statistical predictions, provided that a proper IT infrastructure is accessible to an effective team of wound care experts, statistical analysts, and implementation scientists to carry out the necessary steps.
One additional investigation worth considering related to this work is the baseline risk of different spinal cord injury patient cohorts, specifically those with traumatic vs late-effect spinal cord injury in relationship to pressure ulcer development. Between these 2 groups, there maybe varying baseline risk for pressure ulcers, about which clinicians should be informed to further risk-stratify patients upon admission.
In conclusion, this is an example of using big data to draw appropriate attention to issues that lead to improved hospital performance and patient outcomes. This model implicates spinal cord injury and immobility as major risk factors for HAPUs. Providers and billing may be missing opportunities to codiagnose or code spinal cord injury with paralysis, which could improve hospital performance measures. Finally, early detection of HAPUs is feasible, and the results of these statistical predictions can allow providers to better target prevention to specific patients to prevent avoidable harm.
FUNDING
This study was supported by an unrestricted grant from AHRQ (1-F32-HS023710-01). This grant supported the principal investigator’s (William Padula) salary to conduct this research, which was cosponsored by David Meltzer and Robert Gibbons.
COMPETING INTEREST
WVP is a member of the ANCC Commission on Magnet, and serves on the speakers bureau and as a consultant to Molnlycke Healthcare. There are no other potential conflicts of interest to report.
CONTRIBUTORS
All authors listed in this paper made equal contributions to this study and manuscript according to International Committee of Medical Journal Editors (ICJME) guidelines: substantial contribution to the concept and study design, drafting and revising of intellectual content, final approval of the published version, and agreed-upon accountability for all study aspects.
ACKNOWLEDGMENTS
The data were freely accessible to faculty and staff at the University of Chicago, and we would like to thank Brian Furner and Dr Sam Volchenboum for their efforts to manage access to the Clinical Research Data Warehouse for this effort.
REFERENCES
