


Abstract
Dyslipidemia and hyperglycemia are integral components of the metabolic perturbations in type 2 diabetes. Apolipoprotein E-deficient (apoE −/− ) mice develop severe hyperlipidemia and significant hyperglycemia when fed a western diet containing 21% fat (w/w), 0.15% cholesterol and 19.5% casein. Using an intercross between C57BL/6J (B6) and C3H/HeJ (C3H) apoE −/− mice, we performed quantitative trait locus (QTL) analysis to identify loci contributing to hyperglycemia and associated traits. Fasting plasma levels of glucose, insulin and serum amyloid-P (SAP) and body weight in 234 female F2 mice were measured after being fed the western diet for 12 weeks. QTL analysis revealed one significant QTL, named Bglu3 [95.8 cM, logarithm of odds ratio (OR)(LOD) 4.1], on chromosome 1 and a suggestive QTL on chromosome 9 (38 cM, LOD 2.3) that influenced plasma glucose levels. Bglu3 coincided with loci on distal chromosomal 1 that had a major influence on plasma SAP levels and body weight. Significant correlations between plasma glucose, SAP and body weight were observed in F2 mice. Thus, these results demonstrate genetic linkages of hyperglycemia and body weight with SAP, a marker of the acute-phase response, in hyperlipidemic apoE −/− mice and suggest a probability for the Sap gene to be a positional candidate of Bglu3 .
INTRODUCTION
Type 2 diabetes, which accounts for >90% of diabetic patients, is a multi-factorial, heterogeneous group of disorders, resulting from defects in insulin secretion, insulin action or both ( 1 ). The morbidity of this disease has increased significantly over the last 20 years due to changes in nutrition and physical activity ( 2 ). Although environmental factors such as high-calorie diet and lack of exercise play a role in type 2 diabetes, genetic factors are a major determinant for the development of the disorders ( 1 , 3 ). Only a small subset of diabetes cases are caused by monogenic mutants that are observable as Mendelian traits segregating in families. These mutations have been identified, which include the insulin receptor ( 4 ), hepatocyte nuclear factor 4α ( HNF4A ) ( 5 ), leptin receptor ( 6 ), carboxypeptidase E ( 7 ), 1-acylglycerol-3-phosphate- O -acetyltransferase ( AGPAT2 ) ( 8 ), peroxisome proliferator activated receptor γ (PPARG) ( 9 ) and the serine/threonine kinase gene AKT2 ( 10 ). However, because the common forms of diabetes involve many genes and exhibit significant gene–environment interactions, genetic influences have been difficult to elucidate and identification of genes involved has not been easily achieved in humans ( 1 ). The use of mouse models of diabetes overcomes some of the limitations of human genetic studies. Genetic heterogeneity is reduced through the use of inbred strains, and environmental variation can be minimized by using standardized housing conditions and diet. Through the use of mouse models, several quantitative trait loci (QTLs) associated with glucose homeostasis and intolerance have been identified ( 11 – 13 ).
Anomalies in lipid metabolism or dyslipidemia often precede or accompany type 2 diabetes in humans. Hypertriglyceridemia is the most commonly observed form of dyslipidaemia and has been implicated as a contributing factor to diabetes or the development of diabetic complications ( 14 ). One commonly used mouse model of dyslipidemia is apolipoprotein E-deficient (apoE −/− ) mice. Plasma cholesterol levels in apoE −/− mice are ∼400 mg/dl on a regular rodent diet and are dramatically elevated by feeding a high-fat diet, close to 1000 mg/dl ( 15 ). We and others have reported that genetic backgrounds have a dramatic influence on plasma lipid levels of apoE −/− mice ( 15 – 17 ). Indeed, C3H.apoE −/− mice exhibit significant increases in plasma cholesterol and triglyceride levels compared with B6.apoE −/− mice on a western diet. In the present study, we observed that apoE −/− mice developed significant hyperglycemia on the western-type diet containing 21% fat (w/w), 0.15% cholesterol and 19.5% casein. Using an intercross between B6.apoE −/− and C3H.apoE −/− strains, we performed linkage analysis to search for genetic loci that contributed to hyperglycemia and associated traits.
RESULTS
Plasma levels of lipids, glucose, insulin and serum amyloid-P and body weight in parental and F1 strains
Female B6.apoE −/− and C3H.apoE −/− mice as well as their female F1s developed severe hyperlipidemia on the western diet (Table 1 ). When compared with B6.apoE −/− mice, C3H.apoE −/− mice exhibited significant increases in plasma levels of total cholesterol (1087.0±131.1 versus 898.0±81.3 mg/dl, P =0.011), high density lipoprotein (HDL) cholesterol (119.0±36.6 versus 23.0±13.4 mg/dl, P =0.00008) and triglyceride (105.0±41.9 versus 22.3±8.1 mg/dl, P =0.00089). Interestingly, both strains developed significant hyperglycemia with fasting plasma glucose levels of ∼300 mg/dl. C3H mice showed slightly higher plasma levels of glucose and insulin than B6 mice, although the differences did not reach statistical significance ( P >0.05). Plasma serum amyloid-P (SAP) levels were 2-fold as high in C3H.apoE −/− mice as in B6.apoE −/− mice (62.2±3.3 versus 27.6±4.5 µg/ml, P =1.5×10 −7 ). C3H.apoE −/− mice had a significantly larger body weight than B6.apoE −/− mice (27.6±2.9 versus 19.7±2.8 g, P =8.4×10 −7 ). In general, F1s had the phenotypes that were slightly lower than or similar to their C3H parent, except for HDL, glucose and insulin that were more comparable to their B6 parent.
Relationship between plasma glucose and insulin levels in F2 mice
The relationship between plasma glucose and insulin levels of F2 mice on the western diet was analyzed by linear regression analysis. As shown in Figure 1 , plasma insulin levels rose slightly with increasing plasma glucose levels. The correlation between the two traits was statistically significant in the F2 population ( R =0.24, P =0.0008).
Loci on distal chromosome 1 accounting for major variations in plasma levels of glucose and SAP and in body weight
Genome-wide scans for single QTL using the R/qtl program revealed that loci on distal chromosome 1 were responsible for the major variations in plasma levels of glucose and SAP and in body weight of the F2 cross (Fig. 2 ). Details of the suggestive and significant QTLs defined by permutation tests, including peak marker locus, logarithm of odds ratio (OR)(LOD) score, support interval (SI), variance, P -value, allele conferring the trait, overlapping QTL reported previously and candidate genes for each QTL are summarized in Table 2 . LOD score plots for chromosome 1 using the interval mapping function of MapManager QTXb20 showed colocalization of QTL peaks for glucose, SAP and body weight at marker D1Mit206 (95.8 cM) (Fig. 3 A). This locus influenced glucose and body weight in a dominant manner from the C3H allele but modulated SAP in an additive manner (Fig. 3 B). For glucose, this QTL had an LOD score of 4.1 and accounted for 22% of the variance in plasma glucose levels of the cross (Table 2 ). We designated this QTL for glucose as Bglu3 in keeping with the previous nomenclature for fasting blood glucose loci in the mouse ( 18 ). For SAP, this locus had an LOD score of 9.2 and explained 66% of the variance. This locus overlaps with Sap , which was identified in two sets of recombinant inbred strains B×D and B×H ( 19 ). For body weight, the LOD score graph revealed two peaks with the distal peak near marker D1Mit206 (LOD 8.3) and the proximal peak near marker D1Mit425 (81.6 cM, LOD 9.0). Because the two peaks were not overlapping in the SIs (Table 2 ), they were considered as two separate QTLs. The proximal peak overlaps with the QTL Bw17 , which was mapped to distal chromosome 1 at 75 cM with the use of recombinant inbred strains derived from SM/J and A/J mice ( 20 ). The distal peak overlaps with QTL Bw8q1 , which was mapped to distal chromosome 1 at 100 cM in a B6×A/J F2 cross ( 21 ).
Other loci for plasma glucose levels and body weight
For glucose, a locus on chromosome 9 peaked at marker D9Mit260 (38 cM) had a suggestive LOD score of 2.3 (Table 2 ). This locus accounted for 4% of the variance in plasma glucose levels of the cross, and the C3H allele was responsible for increased glucose levels. For body weight, a locus near marker D17Mit180 (29.4 cM) on chromosome 17 gave a significant LOD score of 3.4 (Table 2 ). The C3H allele contributed to its dominant effect on body weight. A QTL, Wt3q3 , for body weight has been identified in this region in a MH×B6 F2 intercross ( 22 ). We also found two suggestive loci for body weight near marker D4Mit251 (LOD 2.7, 66 cM) and marker D14Mit185 (LOD 2.2, 54 cM). Both loci colocalized with previously reported QTLs Bw7 and Bwnd2wk7 , respectively ( 23 , 24 ).
QTL controlling plasma insulin levels
The genome-wide scan for plasma insulin levels is shown in Figure 2 D. One suggestive locus with an LOD score of 2.7 was detected at D9Mit207 (33 cM) on chromosome 9 (Table 2 ). A dominant B6 allele was responsible for lower insulin levels in that the F2 mice with the heterozygous BC genotype at D9Mit207 had an insulin level comparable to mice with the homozygous BB genotype but lower than mice homozygous in the CC genotype (Fig. 3 B).
Relationships between plasma glucose, SAP and body weight
The relationships of plasma SAP levels with hyperglycemia and body weight were determined in the F2 mice. F2 mice with higher plasma SAP levels tended to have higher plasma glucose levels ( R =0.26; P =1.77×10 −4 ) and larger body weight ( R =0.32; P =1.43×10 −6 ) (Fig. 4 A and B). In addition, we found that F2 mice with higher plasma glucose levels had larger body weight ( R =0.31; P =2.26×10 −6 ) (Fig. 4 C).
DISCUSSION
In the present study, we observed that B6.apoE −/− and C3H.apoE −/− mice developed severe hyperlipidemia and significant hyperglycemia when fed a western diet for 12 weeks. In female mice from an intercross between the two apoE −/− strains, we identified a major QTL influencing plasma glucose levels, which coincided with QTLs on distal chromosomal 1 that had a major influence on plasma SAP levels and body weight. Moreover, we observed significant correlations between plasma glucose, SAP and body weight in the F2 population.
ApoE −/− mice are a commonly used model for experimental atherosclerosis research. Although these mice had a fasting plasma glucose level of 149–187 mg/dl on a regular rodent diet (data not shown), they developed severe hyperglycemia on the western diet with a fasting plasma glucose level of ∼300 mg/dl. Despite such high glucose levels, these mice did not develop obvious insulin resistance on the western diet because a positive correlation still existed between plasma insulin and glucose levels in the F2 population (Fig. 1 ). In a specific case of diabetes, Schreyer et al . ( 25 ). have also observed that apoE −/− mice do not develop insulin resistance when fed a diabetogenic diet. In contrast, in humans, severe hyperglycemia is often accompanied by insulin resistance. In this regard, apoE −/− mice appear to be quite different from humans in the energy metabolism.
In the present study, we identified a significant QTL and a suggestive QTL that influenced plasma glucose levels of the F2 cross. The QTL on chromosome 1 with a peak at D1Mit206 (95.8 cM) accounted for 22% of the variance in plasma glucose levels of the population. We have designated this QTL as Bglu3 in consistent with the nomenclature for fasting blood glucose QTL in the mouse. In a recent study of a C57BL/6J×KK-A F2 cross, Suto and Sekikawa ( 26 ) have identified a suggestive locus at D1Mit150 (100 cM) on chromosome 1 for fasting glucose levels. These two loci appear to be identical because the recessive B6-derived alleles confer lower glucose concentrations at both D1Mit150 and D1Mit206 and the SIs of the loci are overlapping. Syntenic analysis between mouse and human has indicated that the chromosomal region from 86 to 102 cM spanned by Bglu3 in the mouse is homologous to the chromosomal region of 1q21–q23 in humans. In humans, plasma glucose has been linked to chromosome 1q21–q23 in several populations, including Chinese ( 27 ), Utah Caucasians ( 28 ), French Caucasians ( 29 ), British Caucasians ( 30 ) and Pima Indians ( 31 ). We also identified a suggestive QTL with a peak at 38 cM on chromosome 9 influencing plasma glucose levels. The C3H allele was responsible for increased glucose levels in the cross. This QTL has not been reported previously.
Although five QTLs were detected to contribute to the variation in body weight of the F2 cross, two adjacent loci on distal chromosome 1 explained 40 and 34% of the variance, respectively. The LOD score plot of chromosome 1 for body weight shows two distinct peaks with two disparate SIs, indicating the existence of two separate loci for this trait on the chromosome. QTLs for body weight on distal chromosome 1 have been reported previously in several different crosses ( 20 – 22 , 24 ), but the association of body weight with either plasma glucose or SAP has not been examined. In this study, we have observed that the distal QTL for body weight on chromosome 1 colocalized with the QTLs for plasma glucose and SAP. The colocalization of QTL peaks for body weight, plasma glucose and SAP suggests a possibility that these three types of traits are controlled by the same locus. The present finding that both plasma glucose and body weight show a dominant C3H allele effect for increased levels supports this possibility. The Sap gene (94.2 cM) appears to be a positional candidate gene responsible for the variations in plasma glucose, SAP and body weight. Sequence analysis of Sap cDNA from several inbred strains, including B6 and C3H mice, has revealed a number of nucleotide substitutions ( 32 ). This study of F2 mice indicated that elevated plasma SAP levels were significantly associated with increases in plasma glucose and body weight (Fig. 4 ). SAP is a major acute-phase reactant in mice ( 33 ), and it is a molecular homolog of C-reactive protein (CRP) in humans ( 34 ). Recent studies have suggested a role for CRP in the development of type 2 diabetes ( 35 , 36 ). Type 2 diabetes patients have an increased serum level of acute-phase response markers, including CRP ( 37 ). Polymorphisms in the promoter region of CRP have been found to be associated with the incident of type 2 diabetes in Pima Indians ( 38 ).
Apoa2 (92.6 cM), encoding apolipoprotein AII, is another positional candidate gene on chromosome 1 that may contribute to the variations in plasma glucose and body weight. Sequence analysis of Apoa2 cDNA from several inbred strains, including B6 and C3H mice, has revealed a number of nucleotide substitutions ( 39 ). Interestingly, Apoa2 transgenic mice exhibit several traits associated with type 2 diabetes, including glucose intolerance, insulin resistance, hypertriglyceridemia and obesity ( 40 , 41 ). In humans, the location of the Apoa2 gene is in chromosome 1q23, a region that is associated with familial combined hyperlipidemia, insulin resistance and type 2 diabetes mellitus ( 42 ).
In the present study, we observed that the C3H parental strain had 2-fold higher plasma SAP levels than the B6 parental strain on the western diet. However, the high SAP level of C3H mice may not indicate a more general inflammation in the organs such as the liver, pancrease or the kidneys induced by feeding of the western diet. Indeed, C3H mice have a higher SAP level than B6 mice even on a regular rodent diet ( 19 ) and this strain has been shown to be less responsive to high-fat diet than B6 mice with regard to induction of inflammatory genes in the liver and non-vascular tissues ( 43 , 44 ). Nevertheless, functional studies are required to confirm that SAP is the gene responsible for elevated plasma glucose and body weight from the C3H allele.
Pickup et al . ( 37 ). first reported that the circulating levels of acute-phase response proteins predict the development of type 2 diabetes in a middle-aged population. This finding has been subsequently confirmed in several other populations ( 35 , 36 ). Our present study has provided direct experimental evidence for the genetic linkage of hyperglycemia with SAP, a marker of the acute-phase response. Because the acute-phase response, featured by elevations in acute-phase reactants like SAP, is an indicator of ongoing low-grade inflammation ( 45 ), our current findings support the concept that inflammation contributes to the pathogenesis of type 2 diabetes ( 46 ). However, there is a possibility that a different linked gene may contribute to the phenotype and that the observed association might be a secondary one resulting from linkage disequilibrium. It is also noteworthy that the lipoprotein and energy metabolisms of apoE −/− mice are quite different from those of humans. Thus, results obtained from the mice may not necessarily reflect human conditions. Also, apoE −/− mice have renal injury ( 47 ), which may alter hyperglycemia and plasma SAP levels.
MATERIALS AND METHODS
Mice
Female B6.apoE −/− mice at the N10 backcross, constructed from B6;129.apoE −/− mice ( 48 ), were purchased from The Jackson Laboratories, Bar Harbor, ME, USA, and C3H.apoE −/− mice were generated in our laboratory by initially crossing female B6.apoE −/− mice with male C3H/HeJ mice, followed by 12 sequential back-crossings with male C3H/HeJ mice. Male C3H.apoE −/− mice were crossed with female B6.apoE −/− mice to generate F1 hybrids, which were subsequently intercrossed by brother–sister mating to generate 234 female F2 progeny. Mice were weaned onto a regular rodent chow diet at 3 weeks of age. At the age of 6 weeks, F2 mice were started on the Western diet containing 21% (w/w) butterfat, 0.15% (w/w) cholesterol and 19.5% casein without sodium cholate (42% of calories from fat, 15% from protein and 43% from carbohydrate; Harlan Teklad Adjusted Calories TD 88137) and maintained on the diet for 12 weeks. All procedures were carried out in accordance with the current National Institutes of Health guidelines and approved by the Institutional Animal Care and Use Committee.
Measurements of plasma lipids, glucose, insulin and SAP
Mice were fasted overnight before being sacrificed, and blood was collected by retro-orbital venous plexus puncture with the animals under isoflurane anesthesia. Plasma total cholesterol and triglyceride levels were determined by using the Thermo DMA (Louisville, CO, USA) cholesterol and triglyceride kits, which were adapted for a micro-plate assay ( 49 ). Briefly, 6µl of plasma samples (for cholesterol measurements, plasma was diluted 1:5 in distilled water), lipid standards and controls were loaded in a 96-well plate and then mixed with 150 µl of cholesterol or triglyceride reagents. After a 5 min incubation at 37°C, the absorbance at 500 nm was read on a Molecular Devices (Menlo Park, CA, USA) plate reader. HDL cholesterol levels were determined after precipitation of very low density lipoprotein (LDL) and LDL cholesterol fractions with a precipitating reagent provided by the company. Plasma glucose was measured with a Sigma glucose (HK) assay kit. Insulin was measured by a commercially available ultra-sensitive mouse ELISA kit from Mercodia (Uppsala, Sweden). Plasma SAP was measured by a commercially available ELISA kit purchased from the Immunology Consultants Laboratory, Inc. (Newberg, OR, USA).
Genotyping
Genomic DNA was isolated from the tail of mice by using the standard phenol/chloroform extraction and ethanol precipitation method. A total of 134 microsatellite markers distinguishing strain B6 from strain C3H and covering all 19 autosomes and the X chromosome at an average interval of 12 cM were used to detect simple sequence length polymorphism of all F2 mice to identify which of the two parental strains contributed to alleles at a specific locus of each animal by PCR analysis. Parental and F1 DNA served as controls for each marker.
Statistical analysis
A complete linkage map for all chromosomes was constructed from phenotype and genotype data by using the R/qtl program ( http://www.biostat.jhsph.edu/∼kbroman/software ) ( 50 ), and the MapManager QTXb20 software ( http://mapmgr.roswellpark.org/ ), which provides the best estimate for the presence of QTLs and their positions within marker intervals, was used for both marker regression and interval mapping analyses ( 51 ). A likelihood ratio statistic (LRS) was generated by QTX to define the significance of the association of a genetic marker with a trait. LOD scores were calculated by dividing LRS by 4.6. One thousand permutations of the trait values were used to define the genome-wide LOD score threshold required to be significant or suggestive for each specific trait ( 52 ). Loci that exceeded the 95th percentile of the permutation distribution were defined as significant ( P <0.05) and those exceeding the 37th percentile were suggestive ( P <0.63) according to the criteria recommended by the genetics community in 2003 ( 53 ). The SI for each QTL was determined using a 1-LOD drop from the QTL peak. The allele effect of each QTL was determined by the regression analysis, which gives a better indication than ANOVA of which model, either additive (three groups) or dominant (two groups), to choose based on the R -values. ANOVA was used for determining whether the mean phenotype values of progeny with different genotypes at a specific marker were significantly different. Linear regression analysis was performed to assess the association of various traits. Differences were considered statistically significant at P <0.05.
ACKNOWLEDGEMENTS
This work was supported by NIH grant HL71844, the Partners' Fund Award from the Cardiovascular Research Center and the Dean's R&D award from the University of Virginia, School of Medicine. The authors thank Dr Feifang Hu for advice with the statistical analyses. The accession number for QTL Bglu3 in the Mouse Genome Informatics database is MGI:3613551.
Conflict of Interest statement . None declared.
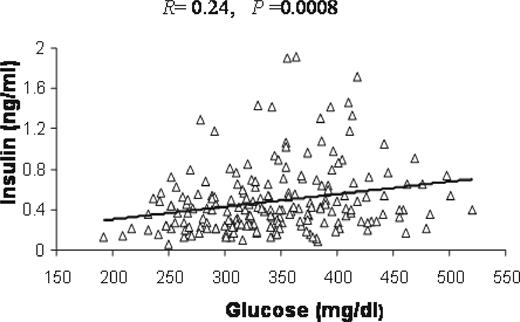
Figure 1. The relationship between plasma insulin and glucose levels in 234 female F2 mice-derived B6.apoE −/− and C3H.apoE −/− strains analyzed by linear regression analysis. The F2 mice were fed a western diet for 12 weeks. Each point represents an individual value of an F2 mouse. The correlation coefficient ( R ) and significance ( P ) are shown in the figure.
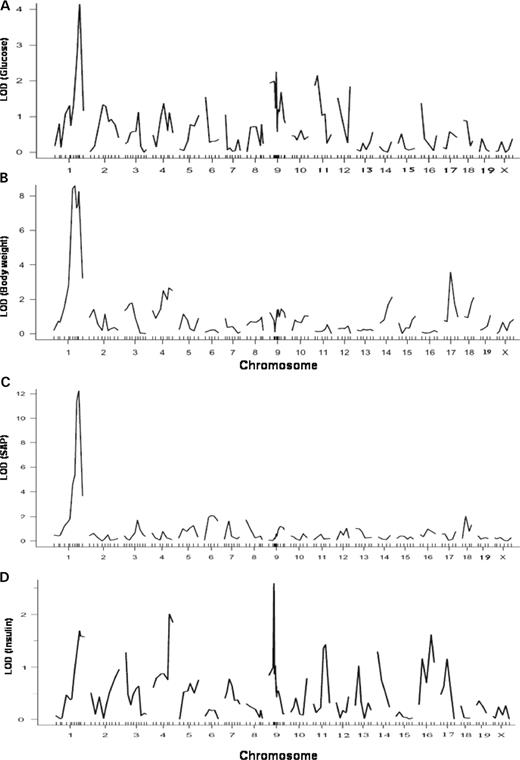
Figure 2. Genome-wide analyses for main effect loci affecting plasma glucose levels ( A ), body weight ( B ), SAP component ( C ) and plasma insulin levels ( D ) of female F2 mice between B6.apoE −/− and C3H.apoE −/− mice using the R/qtl program. Two hundred and thirty-four female F2 mice were fed the western diet for 12 weeks and typed for genetic markers spanning the genome and for the phenotypes. Chromosomes 1 through X are represented numerically on the X -axis. The relative width of the space allotted for each chromosome reflects the relative length of each chromosome. The Y -axis represents the LOD score.
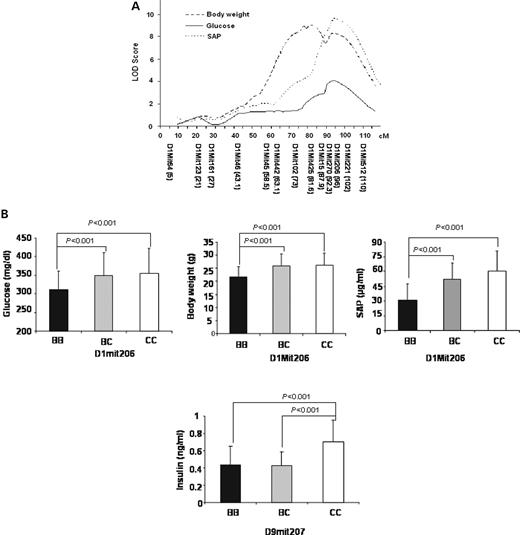
Figure 3. ( A ) Detailed LOD score plots for plasma glucose, SAP and body weight on chromosome 1. The X -axis depicts the marker positions in centimorgans, and the Y -axis depicts LOD scores. Plots were obtained by using the interval mapping function of MapManager QTXb20. ( B ) The allele effect at peak marker D1Mit206 on plasma glucose, SAP and body weight, respectively, and the allele effect at marker D9Mit207 on plasma insulin levels of the F2 mice. BB, CC and BC designate F2 mice homozygous for the B6 allele, C3H allele and heterozygous at the marker locus, respectively. Values are expressed as means±SDs of F2 mice with a particular genotype at the designated locus. P -values are shown in the figure.
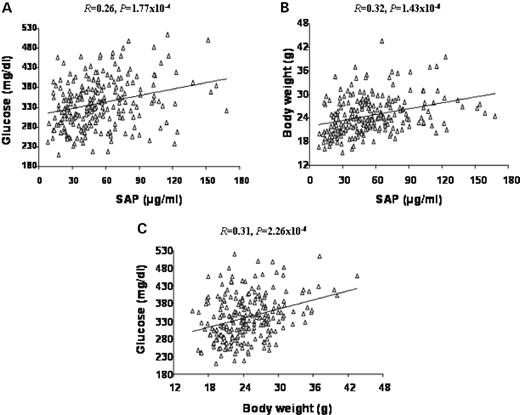
Figure 4. Scatterplots showing relationships between plasma glucose, SAP and body weight in the F2 cross. Each point represents an individual value of an F2 mouse. The correlation coefficient ( R ) and significance ( P ) are shown in the figure. There were significant correlations between plasma glucose, SAP and body weight.
Fasting plasma levels of lipids, glucose, insulin and SAP and body weight in female B6.apoE −/− and C3H.apoE −/− mice and their F1s when fed a western diet
| Trait | B6.apoE −/− | C3H.apoE −/− | F1 | P -value |
|---|---|---|---|---|
| Total cholesterol (mg/dl) | 898.0±81.3 ( n =5) | 1087±131.1 ( n =10) | 1016.9±127.9 ( n =17) | 0.011 |
| HDL cholesterol | 23.0±13.4 ( n =5) | 119.0±36.6 ( n =10) | 31.0±17.9 ( n =17) | 0.00008 |
| Triglyceride | 22.3±8.1 ( n =5) | 105.0±41.9 ( n =10) | 96.0±62.3 ( n =17) | 0.00089 |
| Glucose (mg/dl) | 301.4±34.7 ( n =6) | 312.2±31.3 ( n =5) | 262.6±45.9 ( n =6) | 0.93 |
| Insulin (ng/ml) | 0.41±0.24 ( n =6) | 0.53±0.29 ( n =5) | 0.36±0.19 ( n =6) | 0.73 |
| SAP (µg/ml) | 27.6±4.5 ( n =6) | 62.7±3.3 ( n =5) | 59.2±6.5 ( n =6) | 1.5×10 −7 |
| Body weight (g) | 19.7±2.8 ( n =18) | 27.6±2.9 ( n =8) | 25.6±2.7 ( n =16) | 8.4×10 −7 |
Data are presented as the means±SDs. The number of mice used for the tests is provided in the brackets. The P -values were generated by the Student's t -test to show differences between B6.apoE −/− and C3H.apoE −/− mice in each trait.
Significant and suggestive QTLs for plasma glucose, SAP, insulin, and body weight identified by MapManager QTXb20 in B6.apoE −/− ×C3H.apoE −/− female F2 mice
| Chromosome marker (cM) a | Trait | LOD b | SI c (cM) a | Variance (%) d | P -value | Pempe | Model of inheritance f | Overlapping QTL g (reference) | Candidate gene (cM) |
|---|---|---|---|---|---|---|---|---|---|
| D1Mit206 (95.8) | Glucose | 4.1 | 86–102 | 22 | 0.00009 | ≤0.002 | Dominant/C3H | Sap (94.2), Apoa2 (92.6) | |
| D9Mit260 (38) | Glucose | 2.3 | 29–43 | 4 | 0.00554 | 0.17 | Dominant/C3H | Hyou1 (40) | |
| D1Mit425 (81.6) | Weight | 9 | 72–87 | 40 | 0 | ≤0.002 | Dominant/C3H | BW17 (20) | Myog (72.3) |
| D1Mit206 (95.8) | Weight | 8.3 | 88–101 | 34 | 0 | ≤0.002 | Dominant/C3H | BW8q1 (21) | Sap (94.2), Apoa2 (92.6) |
| D4Mit153 (46) | Weight | 2.7 | 39–66 | 15 | 0.00217 | 0.059 | Additive | BW7 (23) | Htr6 (64.9), Htr1D cluster (66), Hmgc (65.6), Sdc3 (60.8) |
| D14Mit185 (54) | Weight | 2.2 | 44–61 | 4 | 0.00726 | 0.19 | Additive | Bwnd2wk7 (24) | |
| D17Mit180 (29.4) | Weight | 3.4 | 19–35 | 7 | 0.00039 | 0.006 | Dominant/C3H | Wt3q3 (22) | Pla2g7 (46) |
| D1Mit206 (95.8) | SAP | 9.2 | 89–104 | 66 | 0 | ≤0.002 | Additive | Sap (19) | Sap (94.2), Apoa2 (92.6) |
| D9Mit207 (33) | Insulin | 2.7 | 30–40 | 7 | 0.00259 | 0.061 | Dominant/B6 |
a From Mouse Genome Informatics (MGI) database at http://www.informatics.jax.org .
b LOD scores were derived by dividing the LRS by 4.6. Suggestive QTL LOD≥2.34 and significant QTL LOD≥3.26 for glucose; suggestive QTL LOD≥2.37 and significant QTL LOD≥3.36 for body weight; suggestive QTL LOD≥2.32 and significant QTL LOD≥3.32 for SAP; suggestive QTL LOD≥2.34 and significant QTL LOD≥3.4 for insulin, as defined by 1000 permutation tests. The significant loci were in bold-face type to distinguish from suggestive loci.
c SI was defined by a 1-unit decrease in LOD score on either side of the peak marker.
d Variance (%) indicated the percentage of the total phenotypic variance detected in the F2 cohort, which was generated using the interval mapping function of MapManager QTXb20.
ePemp , empirically determined P -value for the whole genome, was calculated using the permutation test function of MapManager QTXb20.
f Model of inheritance was determined based on the R2 value of linear regression analysis.
g Overlapping QTL identified in previous studies.
References
Wolford, J.K. and Vozarova de Courten, B. (
Mokdad, A.H., Ford, E.S., Bowman, B.A., Dietz, W.H., Vinicor, F., Bales, V.S. and Marks, J.S. (
Moller, D.E. and Flier, J.S. (
Thomas, H., Jaschkowitz, K., Bulman, M., Frayling, T.M., Mitchell, S.M., Roosen, S., Lingott-Frieg, A., Tack, C.J., Ellard, S., Ryffel, G.U. and Hattersley, A.T. (
Salopuro, T., Pulkkinen, L., Lindstrom, J., Eriksson, J.G., Valle, T.T., Hamalainen, H., Ilanne-Parikka, P., Keinanen-Kiukaanniemi, S., Tuomilehto, J., Laakso, M. et al . (
Naggert, J.K., Fricker, L.D., Varlamov, O., Nishina, P.M., Rouille, Y., Steiner, D.F., Carroll, R.J., Paigen, B.J. and Leiter, E.H. (
Agarwal, A.K., Arioglu, E., De Almeida, S., Akkoc, N., Taylor, S.I., Bowcock, A.M., Barnes, R.I. and Garg, A. (
Barroso, I., Gurnell, M., Crowley, V.E., Agostini, M., Schwabe, J.W., Soos, M.A., Maslen, G.L., Williams, T.D., Lewis, H., Schafer, A.J. et al . (
George, S., Rochford, J.J., Wolfrum, C., Gray, S.L., Schinner, S., Wilson, J.C., Soos, M.A., Murgatroyd, P.R., Williams, R.M., Acerini, C.L. et al . (
Hirayama, I., Yi, Z., Izumi, S., Arai, I., Suzuki, W., Nagamachi, Y., Kuwano, H., Takeuchi, T. and Izumi, T. (
Kim, J.H., Stewart, T.P., Zhang, W., Kim, H.Y., Nishina, P.M. and Naggert, J.K. (
Suto, J., Matsuura, S., Yamanaka, H. and Sekikawa, K. (
Izkhakov, E., Meltzer, E. and Rubinstein, A. (
Shi, W., Wang, N., Shih, D.M., Sun, V., Wang, X. and Lusis, A.J. (
Grimsditch, D.C., Penfold, S., Latcham, J., Vidgeon-Hart, M., Groot, P.H. and Benson, G.M. (
Matsushima, Y., Sakurai, T., Ohoka, A., Ohnuki, T., Tada, N., Asoh, Y. and Tachibana, M. (
Kayo, T., Fujita, H., Nozaki, J., E, X. and Koizumi, A. (
Mortensen, R.F., Le, P.T. and Taylor, B.A. (
Anunciado, R.V., Ohno, T., Mori, M., Ishikawa, A., Tanaka, S., Horio, F., Nishimura, M. and Namikawa, T. (
Zhang, S. and Gershenfeld, H.K. (
Moody, D.E., Pomp, D., Nielsen, M.K. and Van-Vleck, L.D. (
Brockmann, G.A., Kratzsch, J., Haley, C.S., Renne, U., Schwerin, M. and Karle, S. (
Brockmann, G.A., Karatayli, E., Haley, C.S., Renne, U., Rottmann, O.J. and Karle, S. (
Schreyer, S.A., Vick, C., Lystig, T.C., Mystkowski, Paul. and LeBoeuf, R.C. (
Suto, J. and Sekikawa, K. (
Xiang, K., Wang, Y., Zheng, T., Jia, W., Li, J., Chen, L., Shen, K., Wu, S., Lin, X., Zhang, G. et al . (
Elbein, S.C., Wegner, K., Miles, C., Yu, L. and Eisenbarth, G. (
Vionnet, N., Hani, El-H., Dupont, S., Gallina, S., Francke, S., Dotte, S., De Matos, F., Durand, E., Lepretre, F., Lecoeur, C. et al . (
Wiltshire, S., Hattersley, A.T., Hitman, G.A., Walker, M., Levy, J.C., Sampson, M., O'Rahilly, S., Frayling, T.M., Bell, J.I., Lathrop, G.M. et al . (
Hanson, R.L., Imperatore, G., Narayan, K.M., Roumain, J., Fagot-Campagna, A., Pettitt, D.J., Bennett, P.H. and Knowler, W.C. (
Itoh, Y., Takeuchi, S., Shigemoto, K., Kubo, S., Handa, S., Ishikawa, N. and Maruyama, N. (
Pepys, M.B., Baltz, M.L., Gomer, K., Davies, A.J. and Doenhoff, M. (
Pepys, M.B. and Baltz, M.L. (
Festa, A., D'Agostino, R., Jr, Howard, G., Mykkanen, L., Tracy, R.P. and Haffner, S.M. (
Schmidt, M.I., Duncan, B.B., Sharrett, A.R., Lindberg, G., Savage, P.J., Offenbacher, S., Azambuja, M.I., Tracey, R.P. and Heiss, G. (
Pickup, J.C., Mattock, M.B., Chusney, G.D. and Burt, D. (
Wolford, J.K., Gruber, J.D., Ossowski, V.M., Vozarova, B., Antonio Tataranni, P., Bogardus, C. and Hanson, R.L. (
Doolittle, M.H., LeBoeuf, R.C., Warden, C.H., Bee, L.M. and Lusis, A.J. (
Castellani, L.W., Gargalovic, P., Febbraio, M., Charugundla, S., Jien, M.L. and Lusis, A.J. (
Castellani, L.W., Goto, A.M. and Lusis, A.J. (
Martin-Campos, J.M., Escola-Gil, J.C., Ribas, V. and Blanco-Vaca, F. (
Liao, F., Andalibi, A., deBeer, F.C., Fogelman, A.M. and Lusis, A.J. (
Liao, F., Andalibi, A., Qiao, J.H., Allayee, H., Fogelman, A.M. and Lusis, A.J. (
Mortensen, R.F., Beisel, K., Zeleznik, N.J. and Le, P.T. (
Pickup, J.C. (
Wen, M., Segerer, S., Dantas, M., Brown, P.A., Hudkins, K.L., Goodpaster, T., Kirk, E., LeBoeuf, R.C. and Alpers, C.E. (
Zhang, S.H., Reddick, R.L., Piedrahita, J.A. and Maeda, N. (
Tian, J., Pei, H., James, J.C., Li, Y., Matsumoto, A.H., Helm, G.A. and Shi, W. (
Broman, K.W., Wu, H., Sen, S. and Churchill, G.A. (
Manly, K.F., Cudmore, R.H. Jr, and Meer, J.M. (
Churchill, G.A. and Doerge, R.W. (
