


Abstract
Endothelial dysfunction contributes to the development of coronary heart disease (CHD). Soluble epoxide hydrolase metabolizes epoxyeicosatrienoic acids in the vasculature and regulates endothelial function. We sought to determine whether genetic variation in soluble epoxide hydrolase ( EPHX2 ) was associated with the risk of CHD. We genotyped 2065 Atherosclerosis Risk in Communities study participants (1085 incident CHD cases, 980 non-cases) for 10 previously identified polymorphisms in EPHX2 . Using a case–cohort design, associations between incident CHD risk and both non-synonymous EPHX2 polymorphisms and phase-reconstructed haplotypes were evaluated using proportional hazards regression. Individuals carrying the K55R polymorphism variant allele demonstrated higher apparent soluble epoxide hydrolase activity in vivo . Presence of the K55R variant allele was significantly more common among Caucasian CHD cases when compared with non-cases (20.8% versus 15.3%, respectively, P =0.012), and was associated with significantly higher risk of incident CHD (adjusted hazard rate ratio 1.45, 95% confidence interval 1.05–2.01, P =0.026). A significant association between the K55R variant allele and risk of CHD was not observed in African-Americans. The distribution of reconstructed haplotypes were significantly different in Caucasian cases when compared with non-cases ( P =0.021). Significant differences in haplotype distribution were not observed in African-Americans ( P =0.315). Genetic variation in EPHX2 was significantly associated with risk of incident CHD in Caucasians, implicating EPHX2 as a potential cardiovascular disease-susceptibility gene.
INTRODUCTION
Coronary heart disease (CHD) is a major cause of morbidity and mortality, with 1.2 million Americans estimated to experience an acute coronary event this year ( 1 ). Endothelial dysfunction is integrally involved in its pathogenesis ( 2 ) and is independently associated with increased risk of acute cardiovascular events ( 3 ). Various risk factors including cigarette smoking contribute to this process, which is typically manifested by impairment in nitric oxide synthesis and activity ( 4 ). However, dysfunction in other endothelial pathways may also be important.
Arachidonic acid is metabolized to epoxyeicosatrienoic acids (EETs) in endothelial cells by various cytochromes P450 ( 5 ). The EETs possess potent vasodilatory ( 6 , 7 ), anti-inflammatory ( 8 ) and fibrinolytic ( 9 ) effects and are considered one of the primary endothelial-derived hyperpolarizing factors ( 6 , 7 ). The EETs are inactivated by soluble epoxide hydrolase ( EPHX2 ) via hydrolysis to dihydroxyeicosatrienoic acids (DHETs) ( 10 , 11 ). Multiple polymorphisms in EPHX2 have been recently discovered, including variants with higher ( K55R ) and lower ( R287Q ) epoxide hydrolase activity ( 12 , 13 ). An association between EPHX2 polymorphisms and subclinical atherosclerosis has been previously reported ( 14 ); however, associations with risk of clinical events, such as myocardial infarction, have not been evaluated.
Our primary aim was to determine whether genetic variation in EPHX2 was associated with risk of incident CHD events in individuals enrolled in the biethnic Atherosclerosis Risk in Communities (ARIC) study. A secondary aim was to determine whether this risk was modified by environmental factors known to impair endothelial function such as cigarette smoking.
RESULTS
Study population
Significant baseline differences in various risk factors were observed between incident CHD cases and non-cases included in the cohort random sample (Table 1 ). Cases were significantly older and more likely to be male, cigarette smokers, diabetic, hypertensive and have abnormal fasting lipid panels compared with non-cases.
EPHX2 genotype
The observed race-specific allele frequencies of the 10 polymorphisms evaluated are presented in Figure 1 . The distribution of each was in Hardy–Weinberg equilibrium in both Caucasians and African-Americans ( P >0.05). Minimal evidence of pairwise linkage disequilibrium was observed between polymorphisms within each race; however, polymorphism 10 demonstrated some degree of association with polymorphisms 1( D ′=0.97, r2 =0.28), 5( D ′=0.96, r2 =0.22) and 6( D ′=0.93, r2 =0.28) in Caucasians and 5(D′=1.0, r2 =0.20) in African-Americans.
K55R biomarker analysis
Participants with one ( A/G ) or two ( G/G ) copies of the K55R polymorphism variant allele demonstrated significantly lower plasma 12,13-epoxyoctadecenoic acid (EpOME) to dihydroxyoctadecenoic acid (DHOME) ratios compared with wild-type ( A/A ) individuals ( A/A : 0.40±0.03 versus A/G : 0.31±0.04 versus G/G : 0.28±0.03; P =0.030), indicative of higher apparent soluble epoxide hydrolase activity in vivo . Significant differences in plasma 9,10-EpOME:DHOME ratios were not observed ( A/A : 0.34±0.03 versus A/G : 0.28±0.03 versus G/G : 0.26±0.03; P =0.155).
In the race-stratified analysis, Caucasians with one or two copies of the K55R variant allele demonstrated significantly lower plasma 9,10-EpOME:DHOME ( A/A : 0.42±0.04 versus A/G : 0.28±0.04 versus G/G : 0.24±0.04; P =0.014) and 12,13-EpOME:DHOME ratios ( A/A : 0.42±0.04 versus A/G : 0.31±0.04 versus G/G : 0.25±0.04; P =0.011) compared with wild-type individuals (Fig. 2 A). Significant differences across genotype were not observed in African-Americans for either the 9,10-EpOME:DHOME ( A/A : 0.28±0.04 versus A/G : 0.27±0.05 versus G/G : 0.29±0.05; P =0.983) or the 12,13-EpOME:DHOME ratio ( A/A : 0.38±0.05 versus A/G : 0.31±0.06 versus G/G : 0.31±0.06; P =0.602) (Fig. 2 B). Irrespective of genotype, differences in 9,10-EpOME:DHOME ( P =0.395) and 12,13-EpOME:DHOME ratios ( P =0.897) were not observed across race.
Genotype association analysis
The K55R polymorphism variant allele was significantly more common among Caucasian CHD cases compared with cohort random sample non-cases (20.8 versus 15.3%, respectively, P =0.012) (Table 2 ). This difference in genotype frequency was observed in both heterozygous A/G (19.8 versus 14.9%) and homozygous G/G (1.0 versus 0.4%) individuals. Significant differences were not observed in African-Americans ( P =0.344) (Table 2 ).
Presence of the K55R variant allele was associated with significantly higher risk of incident CHD in Caucasians [model 3, hazard rate ratio (HRR) 1.45, 95% confidence interval (CI) 1.05–2.01, P =0.026, q =0.083] (Table 3 ). Individuals with the heterozygous A/G (model 3, HRR 1.40, 95% CI 1.00–1.95, P =0.047) and homozygous G/G (model 3, HRR 3.47, 95% CI 1.05–11.5, P =0.041) genotypes were at a significantly greater risk for developing CHD relative to wild-type A/A individuals. This association was not modified by gender ( P =0.432 for interaction).
No significant differences in the genotype frequency of other non-synonymous polymorphisms were observed across case status in either race (Table 2 ). Moreover, the presence of the R103C , R287Q , 402InsR or E470G polymorphism variant alleles was not significantly associated with risk of CHD (Table 3 ). A significant difference in baseline diabetes diagnosis was observed between Caucasians in the cohort random sample with ( G/A or A/A ) and without ( G/G ) the R287Q polymorphism variant allele (1.6 versus 10.2%, respectively, P <0.001). The R287Q variant allele was more common in diabetic CHD cases compared with non-cases (20.1 versus 3.6%, respectively, P <0.001); however, differences in genotype frequency were not observed in non-diabetics (20.9 versus 20.9%, respectively, P =0.987). Inclusion of the R287Q *diabetes interaction term in model 3 substantially attenuated the observed trend between the presence of the R287Q variant allele and the risk of incident CHD in Caucasians (HRR 1.06, 95% CI 0.76–1.48, P =0.710). Moreover, stratified analysis demonstrated no association between the R287Q variant allele and risk of CHD in non-diabetic individuals (model 3 minus diabetes, HRR 1.05, 95% CI 0.73–1.50, P =0.799).
K55R Genotype and smoking
The interaction between the K55R variant allele, cigarette smoking status at baseline and risk of CHD in Caucasians did not attain statistical significance (Table 4 ). When stratified by current smoking status at baseline, the K55R variant allele was significantly more common among Caucasian cases who smoked compared with non-cases (25.6 versus 13.6%, respectively, P =0.006). Significant differences were not observed in non-smokers (18.5 versus 15.8%, respectively, P =0.291). Caucasian smokers carrying the K55R variant allele were at higher risk of CHD when compared with smokers without the polymorphism (model 3 minus current smoking, HRR 2.06, 95% CI 0.99–4.27, P =0.053). No significant association was observed in non-smokers (model 3 minus current smoking, HRR 1.26, 95% CI 0.87–1.82, P =0.217). Smoking status did not modify risk associated with the K55R variant allele in African-Americans ( P =0.709 for interaction).
Haplotype association analysis
Haplotype reconstruction including polymorphisms 1, 5, 6, 7 and 10 in Caucasians and 1, 2, 4, 5, 6 and 10 in African-Americans identified six common haplotypes in Caucasians and seven in African-Americans, which accounted for 97.2 and 92.3% of all chromosomes, respectively. A significant difference in the overall haplotype distribution was observed in Caucasians with and without CHD ( P =0.021) (Table 5 ); however, no significant difference was observed in African-Americans ( P =0.315) (Table 6 ).
In Caucasians, haplotype AGGDA (all wild-type alleles) was significantly less frequent (23.6 versus 27.6%, P =0.034), and haplotype G GGD G (tagged by the K55R and A53415G 3′-UTR variant alleles) was significantly more frequent (10.7 versus 7.6%, P =0.010) in CHD cases compared with non-cases, respectively (Table 5 ). Similar differences in haplotype AGGDA and G GGD G frequency across case status were also observed using the expectation–maximization algorithm ( P =0.010 and P =0.052, respectively). Moreover, presence of haplotype AGGDA was associated with significantly lower risk of CHD after covariate adjustment (model 3, HRR 0.78, 95% CI 0.63–0.97, P =0.028, q =0.083), whereas the presence of haplotype G GGD G was associated with significantly higher CHD risk (model 3, HRR 1.45, 95% CI 1.04–2.02, P =0.030, q =0.083) (Table 5 ). Significant associations were also observed after excluding the 0.8% of individuals with a posterior haplotype probability <0.75 from the analysis ( P =0.025 and P =0.027, respectively).
In African-Americans, haplotype ACGGGA (all wild-type alleles) was significantly more frequent (17.3 versus 12.2%, P =0.026) in CHD cases compared with non-cases, respectively (Table 6 ). A similar difference was also observed using the expectation–maximization algorithm ( P =0.060). Presence of haplotype ACGGGA was associated with higher risk of CHD after covariate adjustment (model 3, HRR 1.47, 95% CI 1.01–2.13, P =0.042, q =0.280) (Table 6 ); however, this association was substantially weakened after exclusion of the 6.7% of individuals with a posterior haplotype frequency <0.75 (model 3, HRR 1.37, 95% CI 0.92–2.05, P =0.119) and should be interpreted with caution.
DISCUSSION
Our analysis identified a statistically significant association between genetic variation in soluble epoxide hydrolase and risk of incident CHD in Caucasians enrolled in the ARIC study, implicating EPHX2 as a potential cardiovascular disease-susceptibility gene. Specifically, the presence of the K55R polymorphism variant allele was associated with significantly higher risk of developing CHD in Caucasians. Consistent with the previous in vitro findings ( 13 ), we observed higher apparent soluble epoxide hydrolase activity in vivo in Caucasians carrying the K55R variant allele. Variation in EPHX2 at the haplotype level was also associated with risk of CHD in Caucasians, suggesting multiple variants within or near EPHX2 may contribute to disease risk.
The role of endothelial dysfunction in the pathogenesis of atherosclerotic cardiovascular disease has become increasingly appreciated. Endothelial dysfunction is typically manifested by impairment in endothelial-dependent vasodilation ( 4 ) and is associated with increased risk of acute cardiovascular events ( 3 ). The vasodilatory and anti-inflammatory properties of EETs are important mediators of this process ( 5 , 15 ). Recent data have demonstrated higher CHD risk in individuals carrying the G-50T polymorphism variant allele in CYP2J2 , which exhibits lower promoter activity and EET biosynthesis ( 16 ). Soluble epoxide hydrolase rapidly hydrolyzes EETs to DHETs and is integrally involved in regulation of their cellular levels and vascular effects ( 10 , 11 , 17 ). EPHX2 knockout mice have significantly lower systolic blood pressures compared with wild-type mice ( 18 ). Soluble epoxide hydrolase inhibitors significantly reduce blood pressure in spontaneously and angiotensin II-induced hypertensive rats ( 10 , 19 , 20 ), inhibit vascular smooth muscle cell proliferation ( 21 ), possess potent anti-inflammatory effects ( 22 ) and represent a therapeutic strategy of potential clinical utility for the treatment of cardiovascular disease. Moreover, we recently reported a significant association between genetic variation in EPHX2 and risk of ischemic stroke events ( 23 ).
Resequencing efforts have identified non-synonymous polymorphisms in EPHX2 with higher ( K55R , C154Y , E470G ) and lower ( R287Q , 402InsR ) epoxide hydrolase activity in vitro relative to wild-type enzyme ( 12 , 13 ). We observed higher apparent epoxide hydrolase activity in vivo , as measured by EpOME:DHOME ratios, in Caucasians carrying at least one K55R variant allele; however, altered EpOME:DHOME ratios were not observed across K55R genotype in African-American individuals. Undetectable plasma EET concentrations precluded us from calculating EET:DHET ratios. On the basis of the role of EPHX2 in endothelial function, we hypothesized that higher epoxide hydrolase activity would be associated with higher risk of acute coronary events. Our findings describing a significant association between the K55R variant allele and higher risk of incident CHD in Caucasians are consistent with this hypothesis.
Cigarette smoking substantially impairs endothelial-dependent vasodilation in humans ( 4 , 24 ), in part via inhibition of nitric oxide synthesis and activity ( 25 ), and modifies the association between endothelial nitric oxide synthase polymorphisms, endothelial function and cardiovascular disease risk ( 26 , 27 ). Perhaps, the presence of established underlying endothelial dysfunction, as observed in cigarette smokers, may be necessary for these genetic variants to significantly influence endothelial function and cardiovascular disease risk. Interestingly, exposure to cigarette smoke also significantly increases vascular EPHX2 expression in mice ( 28 ), suggesting upregulated EET hydrolysis may contribute to the deleterious effects of cigarette smoking in the endothelium. Cigarette smoking history did not appear to influence plasma EpOME: DHOME ratios in our biomarker study (data not shown); however, this analysis was not designed or powered to specifically characterize such comparisons. Although preliminary, our findings suggest that the risk of CHD associated with the K55R variant allele may be highest in cigarette smokers. Future studies in larger populations will be required to characterize this potential gene–environment interaction and the mechanistic contribution of EPHX2 to the vascular effects of cigarette smoking.
Using haplotype-tagging polymorphisms identified from our previous resequencing effort, our haplotype analysis suggests that variation along the EPHX2 gene is also an important determinant of CHD risk in Caucasians. Distribution of reconstructed haplotypes differed significantly across individuals with and without incident CHD, and haplotypes G GGD G and AGGDA were associated with significantly higher and lower CHD risk, respectively. The G GGD G haplotype was tagged by the K55R variant allele, which was associated with significantly higher in vivo soluble epoxide hydrolase activity and CHD risk in our genotype analysis. The R287Q and 402InsR variant alleles, which have been associated with lower soluble epoxide hydrolase activity in vitro ( 12 , 13 ), were not located on either the G GGD G or the AGGDA haplotypes. Because haplotypes are inferred, some uncertainty exists in the haplotype assigned to each individual. This was mitigated by minimizing the number of polymorphisms included in haplotype reconstruction ( 29 ). Moreover, similar results were observed using the expectation–maximization algorithm, which accounted for posterior haplotype probabilities in the frequency comparisons across case status ( 30 ), and after excluding individuals with posterior haplotype probabilities <0.75.
The lack of an association between CHD and the K55R polymorphism in African-Americans could be due to lower statistical power in this subset. However, we also observed no apparent influence of K55R genotype on in vivo soluble epoxide hydrolase activity in African-Americans, whereas significant genotype-dependent differences were observed in Caucasians. Perhaps, certain genetic and/or environmental factors not accounted for in our analysis could have contributed to these racial differences in soluble epoxide hydrolase activity and CHD risk. Future studies evaluating the vascular effects of EPHX2 in Caucasians and African-Americans appear warranted, particularly because racial differences in endothelial-targeted therapies have been reported in other cardiovascular disease populations ( 31 ).
An association between the R287Q variant allele and increased coronary artery calcification, a non-invasive measure of atherosclerotic burden, was recently reported in African-Americans ( 14 ). The mechanism underlying this association remains unclear because this variant has demonstrated lower soluble epoxide hydrolase activity in vitro ( 12 , 13 ). We did not observe a significant association between this variant and risk of CHD clinical events in our analysis. Although a non-significant trend toward higher risk was observed in Caucasians (model 3 only), this relationship was modified by baseline diabetes diagnosis. No association with CHD risk was observed in non-diabetics, whereas the apparent trend in diabetics was driven by a lower R287Q minor allele frequency in diabetic non-cases (0.017) than expected based on previously reported frequencies (approximately 0.10) ( 13 , 14 ).
Although our study evaluated rigorously ascertained incident events, we are unable to elucidate mechanisms underlying the observed associations between genetic variation in EPHX2 and CHD risk. Moreover, we cannot rule out that the K55R polymorphism is simply a marker in linkage disequilibrium with the true causative locus. However, our analysis accounted for multiple EPHX2 polymorphisms and also demonstrated significant associations between haplotype and CHD risk in Caucasians. Although we specifically selected polymorphisms in this candidate gene with known functional relevance in vitro and/or haplotype tagging properties and utilized a hypothesis-driven approach in our analysis, we acknowledge that it may be difficult to gauge the statistical significance of these findings considering the number of comparisons completed. Moreover, we recognize the undesirable consequences of reporting false-positive findings. However, concerns surrounding false-negative findings (i.e. missing true associations) are at least as important. In order to minimize the impact of the multiple tests completed in our analysis, we assessed the false discovery rate (FDR) across all completed tests in our genotype and haplotype association analysis, recognizing that such an approach is likely an over-correction because certain genotype and haplotype associations are not completely independent and the same independent variables were evaluated by each of the three models utilized in our analysis. Because all q -values in Caucasians were conservatively estimated to be ≤0.083, we have a high level of confidence in our reported findings, although validation in an independent population is necessary.
In conclusion, our findings suggest that genetic variation in EPHX2 , particularly the presence of the K55R polymorphism variant allele, may be an important risk factor for the development of CHD clinical events in Caucasians. Association studies in different populations will undoubtedly be required to validate our findings, in addition to molecular and physiological studies evaluating the mechanistic relationship between soluble epoxide hydrolase, endothelial function and cardiovascular disease risk.
MATERIALS AND METHODS
Study population
Participants were selected from the ARIC study, a longitudinal, population-based cohort study of 15 792 men and women aged 45–64 from four US communities (Forsyth County, NC; Jackson, MS; Minneapolis, MN and Washington County, MD) enrolled between 1987 and 1989 ( 32 ). Since enrollment, participants have been followed prospectively via annual phone interviews, clinical examinations approximately every 3 years through 1998 and ongoing abstraction of hospital and death certificate records. The study protocol was approved by the Institutional Review Board of each center, and consent was obtained from each participant.
Ascertainment of incident CHD cases
All incident cases that occurred between baseline and December 31, 1998 were evaluated (median follow-up 9.1 years), excluding subjects with a history of CHD or stroke at baseline. Incident CHD ( n =1085) was defined as (i) definite or probable myocardial infarction ( n =520), (ii) electrocardiographic evidence of silent myocardial infarction ( n =112), (iii) definite CHD death ( n =110) or (iv) coronary revascularization procedure ( n =343).
The ascertainment of cases and criteria for classification have been previously described ( 33 ). All potential events were systematically reviewed and adjudicated by the ARIC Morbidity and Mortality Classification Committee ( 32 , 33 ). Hospitalized myocardial infarction was classified as definite or probable based on chest pain symptoms, cardiac enzyme levels and electrocardiographic changes. Definite CHD death was classified based on chest pain symptoms, underlying cause of death, hospitalization records and medical history. Coronary revascularization procedures included coronary artery bypass grafting and percutaneous coronary interventions.
Baseline measurements
Detailed demographic, clinical and biochemical data were obtained from each subject at baseline. Race was self-reported. Prevalent CHD and stroke were defined as history of a physician-diagnosed event. Hypertension was defined as systolic blood pressure ≥140 mmHg, diastolic blood pressure ≥90 mmHg or current antihypertensive medication use. Diabetes was defined as fasting blood glucose ≥7.0 mmol/l, non-fasting blood glucose ≥11.1 mmol/l, physician diagnosis or pharmacological treatment. Detailed information on cigarette smoking was obtained through an interview-administered questionnaire.
Cohort random sample
A random sample of all ARIC participants without history of CHD or stroke at baseline was assembled to serve as the reference group for the case–cohort comparisons ( n =1065, 85 of which are also incident CHD cases). Sampling of the cohort was stratified on age (<55 or ≥55 years), gender and race (Caucasian or African-American). Sampling proportions varied across each stratum. The term non-case refers to individuals within the cohort random sample who did not develop incident CHD during follow-up ( n =980).
Genotyping
Genomic DNA from all incident CHD cases and the cohort random sample was genotyped for 10 polymorphisms in coding and non-coding regions of EPHX2 (Fig. 1 ), using multiplex matrix-assisted laser desorption/ionization time-of-flight (MALDI-TOF) mass spectrometry (Sequenom Inc., San Diego, CA, USA) ( 34 ) or Taqman ® (Applied Biosystems, Foster City, CA, USA) ( 35 ) methods, as described (see Supplementary Material). Blind replicates were included for quality control. Missing genotypes were present in <5% of individuals. These polymorphisms were identified from our resequencing effort as part of the NIEHS Environmental Genome Single Nucleotide Polymorphism program ( http://dir-apps.niehs.nih.gov/egsnp/home.htm ) ( 13 ) and specifically selected based on their known functional relevance in vitro ( 12 , 13 ) and/or haplotype-tagging properties. Briefly, pairwise linkage disequilibrium statistics were calculated and haplotypes were reconstructed separately in European/Caucasians ( n =24) and Africans ( n =24) using all polymorphisms along EPHX2 identified by resequencing (Haploview 3.2) ( 13 , 30 ). Polymorphisms tagging haplotypes with >5% frequency in either population were selected for genotyping ( 36 ).
Biomarker analysis
Plasma from the most recent clinic visit was obtained from 56 participants selected based on their K55R genotype [ A/A ( n =19), A/G ( n =19), G/G ( n =18)] and matched for age, gender and race. Plasma samples were extracted and EpOME and DHOME concentrations were quantified using a validated HPLC/MS/MS method, as described ( 37 ). Previous studies in our lab with Ephx2 knockout mice suggest that plasma EpOME:DHOME ratios are sensitive and specific biomarkers of soluble epoxide hydrolase activity, with lower EpOME:DHOME values indicative of higher apparent soluble epoxide hydrolase activity (J.M. Seubert and D.C. Zeldin, unpublished data).
Data analysis
All incident CHD cases and individuals from the cohort random sample were included in our analysis ( n =2065). Inverse sampling fractions from each stratum were used as weights in variance estimation of adjusted covariate means and proportions by linear and logistic regression, respectively, in non-cases included in the cohort random sample. HRRs and 95% CIs for the development of incident CHD in relation to EPHX2 genotype were calculated by weighted proportional hazards regression, using Barlow's method to account for the stratified random sampling and case–cohort design ( 38 ). Model 1 was unadjusted and included only genotype. Model 2 included age, gender and study center as covariates. Model 3 also included current smoking status, diabetes, hypertension, high density lipoprotein cholesterol, total cholesterol and body mass index. Assuming an autosomal dominant mode of inheritance, individuals with one or two variant alleles were combined for comparison with wild-type individuals. All analyses were completed separately in Caucasians and African-Americans. Assuming a case–control design and type I error α =0.05, we had ∼99 and 80% power to detect an odds ratio of 2.0, and 70 and 30% power to detect an OR of 1.5 in Caucasians and African-Americans, respectively, for polymorphisms with a 10% variant genotype frequency.
Gene–environment interaction testing was completed on a multiplicative scale between genotype and baseline current smoking status (yes/no) using a Wald chi-square test for significance of the estimated β -coefficient for the interaction term ( 39 ). Because interaction hypothesis testing on a multiplicative scale is underpowered, the critical value for statistical significance was set to α =0.15, two-sided ( 40 ). Stratified weighted proportional hazards regression was also completed according to baseline current smoking status using the model 3 covariate adjustment strategy (minus current smoking status) to further explore potential interactions.
Cohort random sample allele frequencies were evaluated for deviation from Hardy–Weinberg equilibrium, and pairwise linkage disequilibrium statistics were calculated (Haploview 3.2) ( 30 ). Haplotypes and their frequencies were estimated using the phase reconstruction method (PHASE 2.1), which assigned the most probable haplotype pair to each individual ( 41 , 42 ). Only polymorphisms with >5% frequency were considered for haplotype reconstruction, which included polymorphisms 1, 5, 6, 7 and 10 in Caucasians and 1, 2, 4, 5, 6 and 10 in African-Americans (Fig. 1 ). Haplotype frequencies were compared across case status by chi-square, and only haplotypes with >5% frequency were considered. Frequency comparisons were repeated using the expectation–maximization algorithm (Haploview 3.2) ( 30 ), which accounted for the uncertainty in haplotype reconstruction by weight-adjusting each inferred haplotype according to its estimated posterior haplotype probability. Associations between haplotype (0, 1, 2) and risk of incident CHD were also evaluated by modeling each haplotype relative to all other haplotypes using Barlow's method ( 38 ). The association analysis was repeated after excluding individuals with posterior haplotype probabilities <0.75.
To minimize the impact of the multiple statistical tests conducted in our analysis, we estimated the FDR q -value of our findings, which is defined as the proportion of statistical tests deemed significant that are actually false-positives (QVALUE) ( 43 ). In order to calculate conservative q -value estimates, we considered statistical tests from the models' 1, 2 and 3 association analysis of each non-synonymous polymorphism (Table 3 ) and reconstructed haplotype (Tables 5 and 6 ) as independent even though each model assessed the same independent variable.
Plasma EpOME:DHOME ratios were compared across K55R genotype by analysis of variance, and post hoc comparisons between genotypes were completed using the Tukey–Kramer test. All data are presented as mean±standard error of the mean.
SUPPLEMENTARY MATERIAL
Supplementary Material is available at HMG Online.
ACKNOWLEDGEMENTS
The authors gratefully acknowledge Christy Avery for her assistance in haplotype reconstruction, Rajan Gill for his laboratory contribution to the biomarker analysis and the staff and participants of the ARIC study for their important contributions. This publication was made possible by grant ES012856 to Dr C.R.L., NS41466 and HL69126 to Dr M.F., HL073366 to Dr M.S.B., ES02710, ES04699 and NL59699-06A1 to Dr B.D.H. and funds from the Intramural Research Program of the NIH, NIEHS to Dr D.C.Z. Its contents are solely the responsibility of the authors and do not necessarily represent the official views of the NIEHS, NIH. The ARIC study is carried out as a collaborative study supported by NHLBI contracts N01-HC-55015, N01-HC-55016, N01-HC-55018, N01-HC-55019, N01-HC-55020, N01-HC-55021 and N01-HC-55022.
Conflict of Interest statement . Drs D.C. Zeldin and B.D. Hammock are co-inventors on US Patent No. 6,531,506 entitled ‘Inhibitors of Epoxide Hydrolases for the Treatment of Hypertension,’ and Dr B.D. Hammock is the founder, a stockholder and a Scientific Advisory Board member of Arete Therapeutics which has purchased an exclusive license to this patent. No other authors have conflicts of interest to disclose.
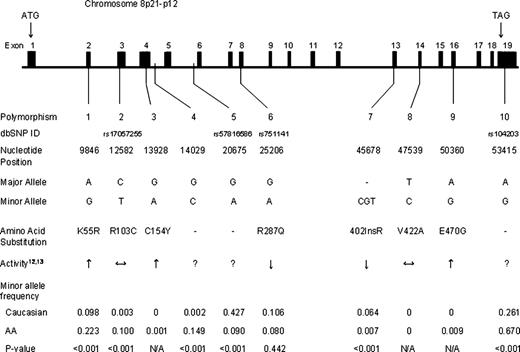
Figure 1. Nucleotide positions of the 10 polymorphisms evaluated are given relative to the EPHX2 cDNA start site (GenBank accession no. NT_022666 ). Activity is reported as higher (↑), lower (↓), unchanged (↔) or unknown (?) relative to wild-type enzyme based on previous in vitro studies ( 12 , 13 ). Minor allele frequencies are presented separately by race and P -values for their comparison are reported.
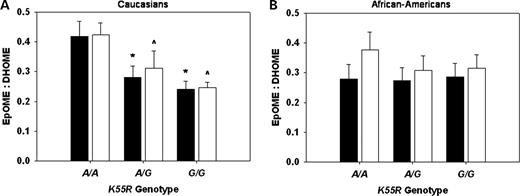
Figure 2. Mean (± standard error of the mean) calculated plasma EpOME:DHOME ratios are presented according to K55R genotype in Caucasians ( A ) and African-Americans ( B ). 9,10-EpOME:DHOME (black bars, * P <0.05 versus A/A ), and 12,13-EpOME:DHOME (white bars, ∧P <0.05 versus A/A ) ratios are presented.
Baseline characteristics by incident CHD case status
| Characteristics a | CRS non-cases | Incident CHD cases | P -value |
|---|---|---|---|
| n | 980 | 1085 | |
| Gender (% male) | 41.2% | 67.4% | <0.001 |
| Race (% Caucasian) | 72.9% | 76.6% | 0.004 |
| Age (years) | 53.8±0.10 | 55.8±0.17 | <0.001 |
| Current smoker (% yes) | 24.8% | 36.1% | <0.001 |
| Pack-years >20 (% yes) | 28.9% | 48.6% | <0.001 |
| Diabetes (%) | 11.0% | 25.1% | <0.001 |
| Hypertension (%) | 29.6% | 49.4% | <0.001 |
| SBP (mmHg) | 120.3±0.58 | 128.3±0.63 | <0.001 |
| DBP (mmHg) | 73.3±0.37 | 76.2±0.38 | <0.001 |
| BMI (kg/m 2 ) | 27.7±0.20 | 28.3±0.15 | 0.017 |
| HDL cholesterol (mmol/l) | 1.38±0.02 | 1.12±0.01 | <0.001 |
| LDL cholesterol (mmol/l) | 3.46±0.03 | 3.92±0.03 | <0.001 |
| Total cholesterol (mmol/l) | 5.48±0.03 | 5.86±0.03 | <0.001 |
| Triglycerides (mmol/l) | 1.41±0.03 | 1.87±0.04 | <0.001 |
Data are presented as mean±standard error of the mean or proportion. CRS, cohort random sample; Pack-years, [(cigarettes smoked per day/20)×(years smoked)] and are reported as proportion of individuals with a >20 pack-year history at baseline; SBP, systolic blood pressure; DBP, diastolic blood pressure; BMI, body mass index; HDL, high density lipoprotein; LDL, low density lipoprotein.
a Characteristics are weighted according to the sampling fraction.
Non-synonymous EPHX2 polymorphism frequency by CHD case status
| Caucasian | African-American | ||||||
|---|---|---|---|---|---|---|---|
| Genotype a | Non-cases | CHD cases | P -value | Genotype a | Non-cases | CHD cases | P -value |
| K55R | K55R | ||||||
| A/A | 461 (84.7%) | 608 (79.2%) | A/A | 179 (57.6%) | 138 (61.9%) | ||
| A/G + G/G | 87 (15.3%) | 160 (20.8%) | 0.012 | A/G + G/G | 127 (42.4%) | 85 (38.1%) | 0.344 |
| A allele | 92.1% | 89.1% | A allele | 76.4% | 78.9% | ||
| G allele | 7.8% | 10.9% | 0.009 | G allele | 23.6% | 21.1% | 0.351 |
| R103C | R103C | ||||||
| C/C | 565 (98.7%) | 773 (100%) | C/C | 247 (80.7%) | 180 (81.1%) | ||
| C/T + T/T | 8 (1.3%) | 0 (0%) | N/A | C/T + T/T | 60 (19.3%) | 42 (18.9%) | 0.915 |
| C allele | 99.4% | 100% | C allele | 90.0% | 90.1% | ||
| T allele | 0.6% | 0% | N/A | T allele | 10.0% | 9.9% | 0.968 |
| R287Q | R287Q | ||||||
| G/G | 496 (80.6%) | 616 (79.2%) | G/G | 258 (82.9%) | 190 (86.0%) | ||
| G/A + A/A | 118 (19.4%) | 162 (20.8%) | 0.525 | G/A + A/A | 49 (17.1%) | 31 (14.0%) | 0.361 |
| G allele | 89.9% | 89.0% | G allele | 91.3% | 92.3% | ||
| A allele | 10.1% | 11.0% | 0.485 | A allele | 8.7% | 7.7% | 0.569 |
| 402InsRb | 402InsRb | ||||||
| D/D | 527 (87.6%) | 687 (88.1%) | D/D | 301 (99.2%) | 219 (98.2%) | ||
| D/I + I/I | 76 (12.4%) | 93 (11.9%) | 0.792 | D/I + I/I | 3 (0.8%) | 4 (1.8%) | N/A |
| D allele | 93.5% | 93.8% | D allele | 99.6% | 99.1% | ||
| I allele | 6.5% | 6.2% | 0.694 | I allele | 0.4% | 0.9% | N/A |
| E470G | E470G | ||||||
| A/A | 557 (100%) | 774 (100%) | A/A | 300 (97.8%) | 222 (97.8%) | ||
| A/G + G/G | 0 (0%) | 0 (0%) | N/A | A/G + G/G | 5 (2.2%) | 5 (2.2%) | 0.974 |
| A allele | 100% | 100% | A allele | 98.9% | 98.9% | ||
| G allele | 0% | 0% | N/A | G allele | 1.1% | 1.1% | 0.975 |
a Data presented as absolute (percent) genotype frequency and allele frequency. Frequencies are weighted according to the sampling fraction. Data for polymorphisms 3 ( C154Y ) and 8 ( V422A ) are not included due to minor allele frequencies ≤0.1% in both races.
b For 402InsR (polymorphism 7), the deletion allele is designated by D and the CGT insertion allele by I .
HRR between non-synonymous polymorphisms in EPHX2 and risk of incident CHD
| Polymorphism | Caucasian | African-American | ||||
|---|---|---|---|---|---|---|
| HRR | 95% CI | P -value | HRR | 95% CI | P -value | |
| K55R | A/G + G/G versus A/A | A/G + G/G versus A/A | ||||
| Model 1 a | 1.43 | 1.07–1.90 | 0.015 | 0.87 | 0.60–1.27 | 0.474 |
| Model 2 b | 1.36 | 1.01–1.83 | 0.045 | 0.87 | 0.61–1.25 | 0.466 |
| Model 3 c | 1.45 | 1.05–2.01 | 0.026 | 0.76 | 0.50–1.16 | 0.208 |
| R103C | C/T + T/T versus C/C | |||||
| Model 1 a | N/A | 0.87 | 0.55–1.35 | 0.528 | ||
| Model 2 b | N/A | 0.95 | 0.61–1.47 | 0.801 | ||
| Model 3 c | N/A | 0.94 | 0.58–1.51 | 0.787 | ||
| R287Q | G/A + A/A versus G/G | G/A + A/A versus G/G | ||||
| Model 1 a | 1.03 | 0.78–1.36 | 0.827 | 0.87 | 0.52–1.44 | 0.560 |
| Model 2 b | 1.17 | 0.88–1.54 | 0.284 | 0.90 | 0.55–1.49 | 0.685 |
| Model 3 c | 1.34 | 0.96–1.87 | 0.082 | 1.13 | 0.64–2.01 | 0.676 |
| 402InsRd | D/I + I/I versus D/D | D/I + I/I versus D/D | ||||
| Model 1 a | 0.96 | 0.69–1.34 | 0.819 | 1.64 | 0.47–5.86 | 0.603 |
| Model 2 b | 1.00 | 0.72–1.39 | 0.998 | 1.40 | 0.39–4.97 | 0.603 |
| Model 3 c | 1.00 | 0.70–1.45 | 0.990 | 1.26 | 0.43–3.71 | 0.675 |
| E470G | A/G + G/G versus A/A | |||||
| Model 1 a | N/A | 1.33 | 0.35–5.02 | 0.679 | ||
| Model 2 b | N/A | 1.71 | 0.50–5.85 | 0.396 | ||
| Model 3 c | N/A | 1.87 | 0.52–6.75 | 0.338 | ||
N/A, modeling not completed because SNP frequency=0% in incident CHD case and/or non-case group. Data for polymorphisms 3 ( C154Y ) and 8 ( V422A ) are not included due to minor allele frequencies ≤0.1% in both races.
a Unadjusted.
b Adjusted for age, gender and study center.
c Adjusted for age, gender, study center, current smoker, diabetes, hypertension, HDL cholesterol, total cholesterol and body mass index.
d For 402InsR (polymorphism 7), the deletion allele is designated by D and the CGT insertion allele by I .
K55R by smoking interaction and risk of incident CHD in Caucasians
| Smoking exposure | Susceptibility genotype ( K55R ) | |
|---|---|---|
| A/A | A/G + G/G | |
| Non-current smokers | ||
| Model 2 a | 1 (referent) | 1.16 (0.81–1.64) |
| Model 3 b | 1 (referent) | 1.26 (0.87–1.80) |
| Current smokers | ||
| Model 2 a | 1.57 (1.17–2.11) | 2.84 (1.62–4.99) |
| Model 3 b | 1.57 (1.14–2.16) | 2.93 (1.54–5.55) |
Data are presented as HRR (95% CI).
a Adjusted for age, gender and study center (interaction term: HRR 1.57, 95% CI 0.78–3.13, P =0.205).
b Adjusted for age, gender, study center, diabetes, hypertension, HDL cholesterol, total cholesterol and body mass index (interaction term: HRR 1.49, 95% CI 0.69–3.18, P =0.308).
EPHX2 haplotypes and risk of incident CHD in Caucasians
| Haplotype a,b,c | Distribution analysis | Association analysis | ||||
|---|---|---|---|---|---|---|
| Non-cases | CHD cases | P -value d | HRR e | 95% CI | P -value | |
| n =510 | n =748 | |||||
| A A GDA | 41.5% | 43.8% | 1.02 | 0.84–1.24 | 0.842 | |
| AGGDA | 27.6% | 23.6% | 0.78 | 0.63–0.97 | 0.026 | |
| AG A D G | 9.9% | 10.7% | 1.39 | 0.97–1.99 | 0.073 | |
| G GGD G | 7.6% | 10.7% | 1.45 | 1.04–2.02 | 0.030 | |
| AGG I A | 6.5% | 6.2% | 0.98 | 0.67–1.42 | 0.908 | |
| AGGD G | 6.9% | 5.1% | 0.021 | 0.84 | 0.58–1.22 | 0.367 |
a Bold nucleotides represent haplotype tagging polymorphisms.
b Estimated copy frequency of each haplotype weighted according to the sampling fraction.
c Haplotype includes polymorphisms 1, 5, 6, 7 and 10, respectively. For polymorphism 7 ( 402InsR ), the deletion allele is designated by D and the CGT insertion allele by I .
d Chi-square P -value for the overall distribution of haplotypes by CHD case status.
e Adjusted for age, gender, study center, current smoker, diabetes, hypertension, HDL cholesterol, total cholesterol and body mass index.
EPHX2 haplotypes and risk of incident CHD in African-Americans
| Haplotype a,b,c | Distribution analysis | Association analysis | ||||
|---|---|---|---|---|---|---|
| Non-cases | CHD cases | P -value d | HRR e | 95% CI | P -value e | |
| n =305 | n =220 | |||||
| ACGGG G | 24.3% | 21.8% | 0.84 | 0.57–1.24 | 0.377 | |
| G CGGG G | 22.6% | 20.9% | 0.85 | 0.59–1.23 | 0.396 | |
| AC C GG G | 15.1% | 15.6% | 1.09 | 0.70–1.68 | 0.703 | |
| ACGGGA | 12.2% | 17.3% | 1.47 | 1.01–2.13 | 0.042 | |
| ACG A GA | 9.8% | 10.1% | 1.08 | 0.68–1.70 | 0.750 | |
| ACGG AG | 8.8% | 6.2% | 0.89 | 0.48–1.67 | 0.718 | |
| A T GGGA | 7.2% | 8.2% | 0.315 | 1.32 | 0.78–2.23 | 0.304 |
a Bold nucleotides represent haplotype tagging polymorphisms.
b Estimated copy frequency of each haplotype weighted according to the sampling fraction.
c Haplotype includes polymorphisms 1, 2, 4, 5, 6 and 10, respectively.
d Chi-square P -value for the overall distribution of haplotypes by CHD case status.
e Adjusted for age, gender, study center, current smoker, diabetes, hypertension, HDL cholesterol, total cholesterol and body mass index.
References
American Heart Association. (
Widlansky, M.E., Gokce, N., Keaney, J.F., Jr and Vita, J.A. (
Halcox, J.P., Schenke, W.H., Zalos, G., Mincemoyer, R., Prasad, A., Waclawiw, M.A., Nour, K.R. and Quyyumi, A.A. (
Ambrose, J.A. and Barua, R.S. (
Zeldin, D.C. (
Campbell, W.B., Gebremedhin, D., Pratt, P.F. and Harder, D.R. (
Fisslthaler, B., Popp, R., Kiss, L., Potente, M., Harder, D.R., Fleming, I. and Busse, R. (
Node, K., Huo, Y., Ruan, X., Yang, B., Spiecker, M., Ley, K., Zeldin, D.C. and Liao, J.K. (
Node, K., Ruan, X.L., Dai, J., Yang, S.X., Graham, L., Zeldin, D.C. and Liao, J.K. (
Yu, Z., Xu, F., Huse, L.M., Morisseau, C., Draper, A.J., Newman, J.W., Parker, C., Graham, L., Engler, M.M., Hammock, B.D. et al . (
Fang, X., Weintraub, N.L., McCaw, R.B., Hu, S., Harmon, S.D., Rice, J.B., Hammock, B.D. and Spector, A.A. (
Sandberg, M., Hassett, C., Adman, E.T., Meijer, J. and Omiecinski, C.J. (
Przybyla-Zawislak, B.D., Srivastava, P.K., Vazquez-Matias, J., Mohrenweiser, H.W., Maxwell, J.E., Hammock, B.D., Bradbury, J.A., Enayetallah, A.E., Zeldin, D.C. and Grant, D.F. (
Fornage, M., Boerwinkle, E., Doris, P.A., Jacobs, D., Liu, K. and Wong, N.D. (
Spiecker, M. and Liao, J.K. (
Spiecker, M., Darius, H., Hankeln, T., Soufi, M., Sattler, A.M., Schaefer, J.R., Node, K., Borgel, J., Mugge, A., Lindpaintner, K. et al . (
Enayetallah, A.E., French, R.A., Thibodeau, M.S. and Grant, D.F. (
Sinal, C.J., Miyata, M., Tohkin, M., Nagata, K., Bend, J.R. and Gonzalez, F.J. (
Imig, J.D., Zhao, X., Capdevila, J.H., Morisseau, C. and Hammock, B.D. (
Imig, J.D., Zhao, X., Zaharis, C.Z., Olearczyk, J.J., Pollock, D.M., Newman, J.W., Kim, I.H., Watanabe, T. and Hammock, B.D. (
Davis, B.B., Thompson, D.A., Howard, L.L., Morisseau, C., Hammock, B.D. and Weiss, R.H. (
Schmelzer, K.R., Kubala, L., Newman, J.W., Kim, I.H., Eiserich, J.P. and Hammock, B.D. (
Fornage, M., Lee, C.R., Doris, P.A., Bray, M.S., Heiss, G., Zeldin, D.C. and Boerwinkle, E. (
Celermajer, D.S., Sorensen, K.E., Georgakopoulos, D., Bull, C., Thomas, O., Robinson, J. and Deanfield, J.E. (
Barua, R.S., Ambrose, J.A., Eales-Reynolds, L.J., DeVoe, M.C., Zervas, J.G. and Saha, D.C. (
Leeson, C.P., Hingorani, A.D., Mullen, M.J., Jeerooburkhan, N., Kattenhorn, M., Cole, T.J., Muller, D.P., Lucas, A., Humphries, S.E. and Deanfield, J.E. (
Wang, X.L., Sim, A.S., Badenhop, R.F., McCredie, R.M. and Wilcken, D.E. (
Maresh, J.G., Xu, H., Jiang, N., Gairola, C.G. and Shohet, R.V. (
Avery, C.L., Martin, L.J., Williams, J.T. and North, K.E. (
Barrett, J.C., Fry, B., Maller, J. and Daly, M.J. (
Taylor, A.L., Ziesche, S., Yancy, C., Carson, P., D'Agostino, R., Jr, Ferdinand, K., Taylor, M., Adams, K., Sabolinski, M., Worcel, M. et al . (
The ARIC investigators. (
White, A.D., Folsom, A.R., Chambless, L.E., Sharret, A.R., Yang, K., Conwill, D., Higgins, M., Williams, O.D. and Tyroler, H.A. (
Bray, M.S., Boerwinkle, E. and Doris, P.A. (
Livak, K.J., Flood, S.J., Marmaro, J., Giusti, W. and Deetz, K. (
Carlson, C.S., Eberle, M.A., Rieder, M.J., Yi, Q., Kruglyak, L. and Nickerson, D.A. (
Newman, J.W., Watanabe, T. and Hammock, B.D. (
Barlow, W.E., Ichikawa, L., Rosner, D. and Izumi, S. (
Li, R., Folsom, A.R., Sharrett, A.R., Couper, D., Bray, M. and Tyroler, H.A. (
Stephens, M., Smith, N.J. and Donnelly, P. (
Stephens, M. and Donnelly, P. (
