


Abstract
Alexander disease is a fatal neurodegenerative disorder resulting from missense mutations of the intermediate filament protein, GFAP. The pathological hallmark of this disease is the formation of cytoplasmic protein aggregates within astrocytes known as Rosenthal fibers. Transgenic mice engineered to over-express wild-type human GFAP develop an encephalopathy with identical aggregates, suggesting that elevated levels of GFAP in addition to mutant protein contribute to the pathogenesis of this disorder. To study further the effects of elevated GFAP and Rosenthal fibers per se, independent of mutations, we performed gene expression analysis on olfactory bulbs of transgenic mice at two different ages to follow the progression of pathology. The expression profiles reveal a stress response that includes genes involved in glutathione metabolism, peroxide detoxification and iron homeostasis. Many of these genes are regulated by the transcription factor Nfe2l2, which is also increased in expression at 3 weeks. An immune-related response occurs with activation of cytokine and cytokine receptor genes, complement components and acute phase response genes. These transcripts are further elevated with age, with additional induction of macrophage-specific markers such as Mac1 and CD68, suggesting activation of microglia. At 4 months, decreased expression of genes for microtubule-associated proteins, vesicular trafficking proteins and neurotransmitter receptors becomes apparent. Interneuron-specific transcription factors including Dlx family members and Pax6 are downregulated as well as Gad1 and Gad2, suggesting impairment of GABAergic granule cells. Together, these data implicate an initial stress response by astrocytes, which results in the activation of microglia and compromised neuronal function.
INTRODUCTION
Alexander disease is a fatal leukodystrophy that results from missense mutations in the astrocyte intermediate filament, glial fibrillary acidic protein (GFAP) (1). The disorder most commonly afflicts young children, and the hallmark pathology found in brains of those affected is abundant accumulation of Rosenthal fibers within astrocyte cytoplasm (2,3). These inclusions are ubiquitinated aggregates of GFAP along with small heat shock proteins including αB-crystallin and Hsp25 (4). In addition to astrocyte pathology, Alexander disease (particularly the infantile form) is often associated with dramatic changes in white matter with loss of myelin, and clinically by varying degrees of psychomotor retardation (5). The juvenile and adult forms sometimes occur without dramatic changes in myelin.
Although the evidence linking GFAP mutations with Alexander disease is compelling (1,6), the mechanism by which abnormalities in an astrocyte-specific gene leads to such widespread dysfunction throughout the brain is not known (6,7). The genetic analyses on nearly 90 patients have been reported (or submitted for publication), and >90% of the patients harbor GFAP mutations. Of the mutations that have been identified, all but one are heterozygous point mutations within the coding sequence (the lone exception being a 6 bp insertion causing an in-frame addition of two amino acids), and over half affect just two amino acids, R79 and R239. The R79 corresponds to a hot spot for keratin mutations (8). Disease-causing mutations in keratins and other intermediate filaments, which like GFAP are genetically dominant, are thought to act in a loss-of-function fashion, largely due to the similarity in phenotypes between the human patients and the mouse knockouts of the relevant genes (9). However, GFAP-null mice have only subtle deficits and do not resemble Alexander disease, which has led to the proposal that GFAP mutations act through a gain-of-function mechanism (5,6,10). In support of this hypothesis is the finding that constitutive over-expression of even wild-type GFAP can be lethal, and also leads to the formation of Rosenthal fibers (11).
GFAP is the major component of glial scarring (‘gliosis’) where its expression is increased in response to a wide range of insults to the brain, from physical trauma to multiple sclerosis (12,13). The conserved nature of the astrocyte response to injury suggests that it might have a protective effect (14), although other studies implicate reactive astrocytes as major inhibitors of axonal regeneration (15). We previously generated transgenic mice using a full-length copy of the human GFAP gene to investigate whether elevations of GFAP could act as a contributing factor for brain injury, independent of any pre-existing injury. The highest expressing of the transgenic lines suffered from early deaths, and all lines (even the ones with normal life spans) develop Rosenthal fibers (11). Evidently, elevations of even wild-type protein beyond a critical threshold are deleterious.
Although mutations of GFAP are clearly the initiating event in the pathogenesis of Alexander disease, it is important to realize that the mutant protein is typically expressed in the context of significant gliosis (3,16–20) with associated increased levels of total GFAP (G. Tang and J.E. Goldman, manuscript in preparation). Hence, an important unresolved question is whether it is expression of mutant GFAP per se, or a combination of mutant and increased levels of GFAP, that leads to astrocyte dysfunction in Alexander disease. To investigate further, the effects of elevated GFAP expression and its aggregation into Rosenthal fibers, we have studied the transcription profile of GFAP transgenic mice using microarray analysis. Here, we show that sustained increase of wild-type GFAP in astrocytes ultimately results in the activation of microglia and compromise of neurons.
RESULTS
To investigate the effects of increased GFAP and Rosenthal fiber formation in astrocytes, microarray analysis was performed to compare RNA samples derived from GFAP over-expressing transgenic mice with non-transgenic controls. Transgenic mice were taken from the most severely affected lines, which we have been able to maintain by natural matings (Tg73.7). These mice are smaller than littermate controls (their only overt phenotype), but have an apparently normal life span. GFAP expression levels peak at 3–6 months and correlate temporally with the amount of protein aggregation (Sullivan et al., manuscript in preparation). Astrocytes containing Rosenthal fibers are hypertrophied and reactive and show a patchy distribution throughout the central nervous system (CNS), but are more concentrated in the subpial and periventricular regions. The GFAP transgenic mice show an increase in mRNA expression for both Hsp25 and αB-crystallin and the intermediate filaments nestin and vimentin (11). To identify other changes in gene expression that take place early in the disease process and during the later stages of pathology when GFAP expression is highest, we analyzed the transcription profile at 3 weeks and 4 months of age. In normal mice, GFAP expressing astrocytes are highly abundant in olfactory bulb (21), and Tg73.7 mice show extensive Rosenthal fiber formation by 3 months of age, particularly in the olfactory bulbs (Fig. 1). To increase the probability of identifying altered expression levels related to Rosenthal fiber production in a mixed population of cells, we chose to analyze RNA from olfactory bulbs. Three female Tg73.7 mice and three non-transgenic female controls of the same genetic background (FVB/N) were used to analyze expression for both age groups.
Of the 12 488 elements analyzed on the Affymetrix murine U74Av2 gene chip, 802 show an increase in expression and 789 show decreased expression levels in the Tg73.7 mice at 4 months of age using the criteria described in the Materials and Methods (22). At 3 weeks of age, 202 elements demonstrate increased expression levels, and only 34 show a decrease in transcript levels. From this group, we have focused on selected genes that show significant changes (P<0.0025) in all pairwise comparisons, and those that are altered in both age groups (for a complete listing of these genes, see Supplementary Material, Table S1).
Microarray analysis demonstrates a defense response in GFAP transgenic mice
Stress response
The majority of genes that show increased expression reflect an immune and stress response (Table 1). As expected, transcripts for the small heat shock protein αB-crystallin (Cryab), a component of Rosenthal fibers, are increased in both age groups. Several antioxidant genes are also elevated including a variety of glutathione S-transferases that reduce reactive electrophiles produced by oxidative metabolism. Glutathione reductase and thioredoxin reductase-1, which recycle the oxidized forms of glutathione and thioredoxin for the respective detoxifying systems, are elevated, and the regulatory subunit for glutamate-cysteine ligase, responsible for catalyzing the first rate-limiting step in glutathione synthesis, also shows increased expression. Transcripts for catalase, glutathione peroxidase and peroxiredoxin 1 and 6, which reduce H2O2 and other hydroperoxides, are all elevated. Many of these antioxidant proteins require NADPH for their reducing potential, and transcripts for components of the pentose phosphate pathway involved in NADPH metabolism show increased expression including glucose-6-phosphate dehydrogenase-2, 6-phosphogluconolactonase and transaldolase1.
The transcription factor Nfe2l2 (Nrf2; nuclear factor erythroid derived 2, like 2) is elevated by 3 weeks of age. Nfe2l2 regulates phase II detoxification genes, including those involved in glutathione metabolism and peroxide detoxification as listed earlier and in Table 1 (genes in boldface; see also Supplementary Material, Table S1, genes in blue), and NAD(P)H: quinone oxidoreductase (Nqo1) (23–27), which is also upregulated early.
The metallothioneins 1, 2 and 3, which bind toxic metals and act as free radical scavengers, are all upregulated. Genes involved in iron homeostasis also show increased expression levels. The ferritin heavy and light chains, ceruloplasmin (a copper-binding ferroxidase) and lipocalin2, involved in iron transport, all show elevated transcript levels as early as 3 weeks.
Immune-related response
A number of small inducible cytokines and their receptors are elevated early, and additional cytokines/receptors are increased at 4 months. Chemotactic factors for monocytes and leukocytes, including Mcp1, Mcp2 (monocyte chemotactic proteins Ccl2 and Ccl8, respectively) and Rantes (Ccl5), show a marked increase in expression, and receptors for these cytokines, Ccr1 (Rantes, Mip1α and Mcp3 receptors) and Ccr5 (Rantes, Mcp2, Ccl8, Mip1α and β receptors), are also elevated. Receptors for colony stimulating factor, oncostatin, and tumor necrosis factor (TNF)-α show increased expression by 3 weeks. At 4 months Tgfβ1 is upregulated as well as the interleukin receptors Il4ra and Il10rb and the Infγ receptor.
MHC class I and II molecules and associated proteins are elevated early and continue to show increased expression in the adult (Supplementary Material, Table S1). Acute phase response genes including pentaxin-related gene (Ptx3) and several complement proteins are upregulated by 3 weeks. Interferon-activated genes also show increased expression with age. At 4 months, genes involved in arachidonic acid metabolism including prostaglandin-endoperoxidase synthase 1 (Cox1) and leukotriene C4 synthase are elevated.
Several genes expressed by macrophages show increased transcript levels at 4 months, suggesting the activation of microglia. Macrophage expressed gene 1 (Mpeg1), osteopontin (Spp1), matrix metalloproteinase 12 (Mmp12), integrins αM and β2 (Itgam and Itgb2, Mac1), galectin-3 (Lgals3, Mac2), Cd9 and Cd68 are all elevated at 4 months, as well as other adhesion molecules, proteases and lysosomal genes.
Serine and cysteine proteases and protease inhibitors are elevated, as well as the Ca2+-dependent calpain proteases (Capn3, Capns1). Several lysosomal genes are activated including cathepsin proteases, lysozymes and glycosidases, as well as lysosomal membrane proteins (Supplementary Material, Table S1). At 4 months, the genes encoding proteosome β subunits 8 and 9 also demonstrate increased expression.
Immune-related signal transduction effectors and transcription factors are increased. At 3 weeks, both CCAAT/enhancer binding proteins β and δ are elevated which regulate acute phase response and macrophage activation genes, respectively. Several signal transduction and regulatory genes, which did not show increased expression at 3 weeks, are elevated later at 4 months, including NfκB, protein tyrosine phosphatase receptor type C (Cd45), Vav oncogene, and several immune specific G-proteins and GTPases. Stat1, 3 and 6, Janus kinase 3 and Socs3 are also upregulated at 4 months.
Remodeling
Thrombospondin, tenascin C and Vcam are upregulated at 3 weeks, and by 4 months, a variety of different procollagen, integrin, matrix and adhesion molecule genes are also upregulated (Supplementary Material, Table S1). Genes for cytoskeletal proteins including the intermediate filaments GFAP and nestin were elevated at an early age as expected. Genes involved in microfilament organization, including a number of actin capping proteins (Cappb1, Capg, Gsn, Tmod3), also show an increase in expression (Table 1).
Reduced expression of neuronal genes in GFAP transgenic mice
Although numerous intermediate and microfilament-related genes show an increase in expression, genes encoding microtubule-associated proteins are downregulated. At 4 months of age, these include βIII-tubulin, kinesin proteins, microtubule associated protein 2 and tau. Doublecortin, which controls microtubule organization and directs neuronal migration, is downregulated, as well as stathmin 1 and stathmin-like 3, both of which bind tubulin and are involved in regulating microtubule dynamics. The neurofilament medium chain and α-internexin also show decreased expression.
Neuron-specific adhesion molecules are downregulated as well. Brevican and brain-specific angiogenesis inhibitor-1 (Bai1), both of which have roles in CNS development, already show decreased expression levels at 3 weeks. Brain-specific angiogenesis inhibitor-1-associated protein 2, astrotactin (required for glial-guided neuronal migration), and other neuronal genes including Icam5 and Nrcam are downregulated by 4 months.
Several transcripts for vesicular trafficking proteins are decreased including syntaxin 1B2, syntaxin binding protein, synaptotagmin 1, synaptobrevin II (Vamp2), Snap25, complexin 1, synaptophysin and others. Multiple GABA-A, glutamate (AMPA, NMDA) and glycine receptor genes as well as GAD65 and GAD67, which synthesize GABA, show a decrease in expression levels, suggesting the loss of neurons or synapses. Decreased expression levels of neurofilament and the neuron-specific marker enolase-2 also suggest either a loss of neurons or a defect in neuronal development or function.
Neuronal transcription factors also show lower expression levels, including the distal-less genes Dlx1, 2 and 5. The Dlx genes are expressed in interneurons including granule and periglomerular cells of the olfactory bulb (28). In addition, the Dlx interacting proteins Dlxin1 (Maged1) and Praja1, which regulate Dlx5 (29,30), show decreased expression. The transcription factor Pax6, which is expressed in periglomerular cells (31), and Etv1, an ETS transcription factor (Er81) that colocalizes with Dlx positive interneuron progenitors in the olfactory bulb (32), are both downregulated. Pbx1, Pbx3 and Meis1, co-factors for homeodomain transcription factors, also localize with Dlx proteins (33) and show lower expression levels.
GFAP transgenic mice show altered expression of genes involved in calcium regulation
Various genes involved with calcium signaling and homeostasis show altered expression levels. At 4 months of age, voltage-gated calcium channels are downregulated including both T (Cacna1 g) and L (Cacnb3, Cacna2d1) types. Ryanodine receptor-2, which regulates Ca2+ release from the endoplasmic reticulum, and the Ca2+ transporting ATPase SERCA2, which pumps calcium back into the endoplasmic reticulum, both show lower transcript levels. The plasma membrane Ca2+ ATPase PMCA2 and the sodium/calcium exchanger Ncx1 (Slc8a1), which transport Ca2+ out of the cell, are also downregulated. Calmodulin-3 shows lower expression levels, as well as Ca2+/calmodulin-dependent protein kinase II (Camk2b, CaMKII) and the calmodulin-dependent phosphatase calcineurin (Ppp3ca, Ppp3cb isoforms). The calcium buffering protein, calretinin (calb2), shows decreased expression levels as early as 3 weeks. The reduced expression of genes involved in Ca2+ signaling and homeostasis could be the result of the loss of neuron function as suggested earlier or remodeling of the Ca2+ system to compensate for aberrant signaling. Potassium channel genes are also downregulated, including Kv4.2 (Kcnd2), which is expressed in olfactory bulb granule cells (34), again suggesting altered neuronal function.
Gap junction proteins connexin-26 and 30 show decreased expression by 3 weeks of age. These proteins are expressed in astrocytes (35,36) and contribute to intercellular calcium wave propagation. Connexin-43, which is also astrocyte specific (37), appears to be downregulated, although the microarray signals did not meet the criteria for statistical significance. In contrast, several calcium-binding proteins are upregulated including annexins A1, 2, 3 and 5 and S100 family proteins A5, 6, 11 and 13, some of which are increased by 3 weeks of age (Supplementary Material, Table S1). Some of these genes are specifically expressed in astrocytes and their protein products interact as heterotetramers (38). S100A6 (calcyclin) interacts with annexin A2 (39), and S100A11 complexes with annexin A1 (40,41). In addition, annexin A2 binds GFAP and promotes GFAP assembly in a Ca2+-dependent manner (42).
Changes in expression of myelin-related genes in mice over-expressing GFAP
A small group of myelin-related genes demonstrate subtle changes. These include the major structural protein of myelin, proteolipid protein, and stearoyl CoA desaturase (catalyzes synthesis of a major fatty acid in myelin, oleic acid), both of which show a slight decrease at 3 weeks and normal levels or increased expression at 4 months. Curiously, Pmp22, which is normally expressed by Schwann cells and found in peripheral myelin (43), shows increased transcript levels at 3 weeks and is elevated further at 4 months. Increases in Igf-binding protein-5 expression have also been correlated with Schwann cell differentiation (44), another gene that shows an early decrease in expression followed by an increase at 4 months.
At 4 months, the lysophosphatidic G-protein-coupled receptor Edg2, which is specifically expressed in myelinating oligodendrocytes (45), and platelet-derived growth factor receptor α, a marker for oligodendrocyte precursors, are upregulated. Myelin-associated glycoprotein (Mag) also shows increased expression by 4 months; however, quaking, an RNA-binding protein that regulates alternative splicing and nuclear export of Mag and Mbp transcripts, respectively (46,47), is downregulated at 4 months.
Changes in expression for other genes of interest
A number of genes involved in cell growth, division and death have increased expression levels at an early age including, Igf binding protein-3, Gadd45a, Bcl2-related proteins A1b and A1d, Bcl associated gene-3 and Mcl1; and by 4 months, Igf2 is also upregulated. Various signal transduction molecules show a decrease in expression at 4 months including kinases, phosphatases, G-proteins and their regulators, many of which are expressed in neurons and play a role in development. Transcription factor and chromatin remodeling genes also show differences in expression levels (Supplementary Material, Table S1). Most of these changes can likely be attributed to the activation of glia or compromised neuronal function.
Quantitative real-time PCR shows similar changes for selected genes when compared with microarray results
To confirm the results of microarray analysis, transcript levels for a select number of genes were assayed by quantitative RT–PCR. Probes were generated as listed in the Supplementary Material, Table S2. Genes representative of the immune and stress response, potential myelin changes and neuronal function were included in the assay. Real-time detection of PCR amplified cDNA generated from GFAP transgenic and wild-type olfactory bulb showed comparable or greater changes in transcript levels in the Tg73.7 mRNA for all of the genes selected from the array results (Fig. 2). Glutathione transferase, αB-crystallin, thioredoxin and Nfe2l2 all show similar increases in both quantitative-PCR and microarray analysis. Quantitative-PCR results for Itgb2 (Mac1) and Gfap show more striking increases in expression when compared with microarray analysis, perhaps due to differences in the range of sensitivity between the two methods. The probes for Tubb3, Eno2 and Gad1 confirm the decreased expression of neuronal specific genes. The Plp gene shows the same pattern of decreased expression at 3 weeks of age followed by increased expression at 4 months, although the changes were not statistically significant.
RNase protection shows TNFα and TGFβ family cytokine expression is increased
To further characterize and confirm the immune response, we performed an RNase protection assay for various inflammatory cytokines. Transcripts encoding MIF (macrophage migration inhibitory factor), IL-6, IFNγ and members of both the TNFα and TGFβ superfamilies were examined in olfactory bulb and the remaining brain (Fig. 3). TNFα, LTβ and TGFβ1 all showed >2-fold increases in expression in olfactory bulb and significant increases in brain. Increases were also observed in TGFβ2 and -3, TNFβ and IL-6, but not in MIF. Microarray analysis did not detect changes for any of these genes with the exception of TGFβ1, which shows a 2.1-fold increase in expression at 4 months. Olfactory bulb transcripts from 6-week-old mice showed similar changes for most of the cytokine genes including TNFα with a 2.9-fold increase; however, TGFβ1 expression was lower at 2.5-fold and IL-6 expression was higher (3.3-fold; data not shown) at 6 weeks compared with 4 months.
Astrocytes and microglia are reactive in GFAP transgenic mice
Elevated levels of cytokine expression could be the result of both activated astrocytes and microglia. Astrocytes in GFAP transgenic mice are reactive with a hypertrophied morphology (Fig. 4A and B). To test whether microglia were activated in the Tg73.7 mice, we assayed brain sections from 4-month-old mice for Mac1 expression through immunohistochemical analysis. Microglia in wild-type brain have a ramified morphology, whereas microglia in GFAP transgenic mice show intense Mac1 staining and hypertrophy (Fig. 4C and D). At 3 weeks of age, there is no difference in Mac1 staining between wild-type and transgenic animals (data not shown).
ARE responsive genes are activated in GFAP transgenic mice including Nqo1
To evaluate further the stress response and activation of Nfe2l2 regulated genes, we crossed the Tg73.7 mice with an ARE-hPAP reporter line of mice (48). Nfe2l2 controls the expression of a number of detoxification genes, such as Nqo1, through the cis-acting antioxidant response element ARE (23). The ARE-hPAP transgene consists of the core ARE element from the Nqo1 promoter placed in front of the human placental alkaline phosphatase gene. Histochemical analysis in mice positive for both the hGFAP and ARE-hPAP transgenes reveals high levels of alkaline phosphatase activity throughout the brain, indicating the induction of genes regulated through the antioxidant response element (Fig. 5).
Nqo1 quinone reductase activity was analyzed directly from GFAP transgenic and wild-type brain lysates. The biochemical assay measures the reduction of menadione by Nqo1 spectrophotometrically through the spontaneous reduction of MTT by menadiol to form blue formazan (49). Brains from transgenic mice at 3 months of age show a 2-fold increase in quinone reductase activity when compared with that of wild-type mice (Fig. 6). These data indicate that not only are ARE-driven genes elevated transcriptionally, but also the antioxidant response is activated on a functional level.
Iron storage is misregulated in mice over-expressing GFAP
To assess whether iron homeostasis is disrupted in GFAP transgenic mice, histochemical analysis was used to detect iron storage in transgenic compared with wild-type mice. In normal mice, oligodendrocytes are highlighted, particularly in white matter tracts and more sporadically in gray matter (Fig. 7) (50). There is a stark difference in iron distribution in the transgenic mice, where reactive astrocytes are stained heavily and the vasculature is outlined throughout (Fig. 7). Oligodendrocytes are less apparent and difficult to distinguish compared with wild-type mice, and some staining may reflect iron accumulation in microglia.
Humans with AxD show increased expression of stress and immune-related genes
To determine whether similar changes in gene expression occur in humans with AxD, brain samples from patients were analyzed for levels of selected transcripts involved in the stress and immune response. Samples were taken from both gray and white matter from juvenile and infantile AxD patients and age-matched controls. As expected, GFAP transcripts are increased in white and gray matter in both cases of AxD (Fig. 8). Transcripts for ceruloplasmin and the NFE2L2-regulated oxidoreductase NQO1 are also increased in the AxD patients (Fig. 8). In addition, increased expression of the CD11b subunit of MAC-1 (ITGAM) in the patient samples suggests activation of microglia.
DISCUSSION
Transgenic mice engineered to constitutively over-express wild-type GFAP developed an inclusion body encephalopathy characterized by Rosenthal fibers, which was lethal for the highest expressing lines. In this study, microarray analysis of the transcription profiles in a severely affected (but still viable) line of GFAP transgenic mice shows a marked immune and stress response that leads to an apparent loss of neurons or neuronal dysfunction during the advanced stages of pathology.
At 3 weeks of age, numerous stress response genes involved in detoxification, glutathione metabolism, iron homeostasis and NADPH production, as well as immune response genes such as cytokines, cathepsins and complement proteins show increased transcript levels in the transgenic mice. Many of these genes are regulated by the transcription factor Nfe2l2, which is also elevated at this early time point. Microarray analysis of primary cortical astrocytes transfected with an Nfe2l2 expression vector shows an increase in transcript levels for many of the same defense genes that show increases in the transgenic mice at 3 weeks as listed in Table 1 (51). We have shown that not only Nfe2l2 expression is elevated, but also the genes regulated by Nfe2l2 through the ARE antioxidant response element are activated (Fig. 5). In addition, biochemical analysis shows increased functional activity of the quinone reductase Nqo1 (Fig. 6), demonstrating activation of ARE responsive genes at the protein level. In Alexander disease, astrocytes bearing Rosenthal fibers are immunoreactive for advanced lipid peroxidation and glycation end-products (52,53), further suggesting that oxidative stress may contribute to both the aggregate formation and the secondary pathology observed in both GFAP transgenic mice and humans with Alexander disease.
We have also shown that the GFAP transgenic mice exhibit abnormal iron distribution throughout the brain. In normal mice, iron storage is most prominent in oligodendrocytes (Fig. 7), which express ferritin, transferrin and the transferrin receptor (50). In the transgenic mice, iron histochemistry outlines the brain microvasculature and shows intensely stained hypertrophic astrocytes, which may correlate with the increase in expression of the acute phase ferroxidase, ceruloplasmin. In the CNS, ceruloplasmin is expressed as a glycosylphosphatidylinositol-anchored protein (54,55) on the surface of perivascular astrocytes (56) and is responsible for oxidizing toxic ferrous iron for both transferrin incorporation and transferrin-independent cellular uptake (57). An increase in the potential for iron uptake by perivascular astrocytes coincides with the observed induction of ferritin expression. In addition, both the ferritin heavy and light chain genes are transcriptionally regulated through ARE elements (58,59) and are likely activated in reactive glia. Primary mutations in the ferritin light chain gene have recently been shown to cause iron accumulation and neurodegeneration involving the basal ganglia in humans (60), and iron misregulation is apparent in other neurodegenerative disorders such as Parkinson's, Alzheimer's and Huntington's diseases (61), where it may contribute to oxidative stress through promotion of free radical formation. Furthermore, targeted deletion of the gene encoding iron regulatory protein-2 also leads to neurodegenerative disease in mice (62). In the GFAP transgenic mice, the ferritin and ceruloplasmin genes are elevated by 3 weeks, but we have not yet determined whether iron misregulation is apparent at this early time point.
Expression of stress response genes continues to be elevated in the transgenic mice at 4 months of age; however, the immune-related transcripts show marked increases and the number of immune genes involved more than doubles. Many of these genes, including those for cytokines, MHC molecules, complement components and acute phase response proteins, can be expressed by both astrocytes and microglia, but most of the macrophage specific genes (Mpeg1, Itgb2, Itgam, Mmp12, Cd68) are not increased until 4 months of age. In conjunction with the immunohistochemical analysis, these data suggest that at 3 weeks, astrocytes are mounting a stress and defense response, but microglia are not yet activated, because Mac1 staining is weak in both wild-type and transgenic mice at this age. At 4 months microglia are hyper-ramified and show a dramatic increase in Mac1 expression (Fig. 4C and D). Because GFAP is specifically expressed in astrocytes, we hypothesize that astrocytes initiate a stress response and become reactive first, and microglia are activated subsequently, most likely through the release of small chemokines such as monocyte chemotactic protein. Several transgenic models have shown that astrocyte specific cytokine expression can lead to pronounced inflammation and neurodegeneration (reviewed in 63). For example, increased expression of IL-6 as a transgene by astrocytes produces many of the same phenotypic features presented by the GFAP transgenic mice, including an increase in expression of acute phase response proteins, iron misregulation, astrocytosis, microgliosis and neurodegeneration (64–66).
A number of genes for cytoskeletal, adhesion and extracellular matrix proteins are also activated in the transgenic mice. It is formally possible that minor sequence differences between the endogenous GFAP gene and the human transgene are responsible for some of the effects of over-expression, but the apparent normalcy of the ‘humanized’ GFAP mice reported by Takemura et al. (67) argues against this possibility. Altered GFAP expression by itself may distort the cytoskeletal architecture, but the morphological changes in activated astrocytes and microglia may also be responsible for increased expression of microfilament associated proteins such as actin capping proteins and cell adhesion molecules. In addition, glial migration, tissue repair and remodeling would lead to changes in extracellular matrix proteins.
In contrast to those genes showing increased expression at 4 months, there is a striking decrease in expression of microtubule associated proteins (Dcx, Tubb3, Mtap2, Mapt, Kif2a, Kns2, Stmn1, Stmn3). Numerous genes involved in neurotransmission and vesicular transport are also downregulated including both GABA and glutamate receptors, Gad67, Gad65, Vamp2, Snap25, synaptotagmin1 and synaptophysin. In combination with the reduction in expression of the neurofilament medium chain, α-internexin and enolase-2, these data suggest the loss or altered function of neurons.
Transcription factors and signal transduction molecules involved in neurogenesis also show decreased expression at 4 months, particularly a related group of regulatory proteins expressed in olfactory bulb interneurons. The Dlx family of genes is expressed in GABAergic interneurons in the granular and periglomerular layers of the olfactory bulb (28,68). The granule cells form reciprocal dendrodendritic synapses with mitral cells in the external plexiform layer and express AMPA and NMDA receptors as well as GABA receptors (69). Mitral cells excite granule neurons through the release of glutamate, and in turn, the granule cells inhibit the mitral neurons through AMPA and NMDA mediated release of GABA, which is thought to be modulated by the rapidly inactivating type A potassium channel Kv4.2 (Kcnd2) (70). The decreased expression of AMPA, NMDA and GABA receptors subunits, Gad65, Gad67 and Kcnd2 all point to the loss of interneurons. Reduced transcript levels of Pax6 and Etv1 further support this conclusion (31,32). Expression of mitral cell specific genes such as Reelin, Tbr1 and Idb2 (68,71,72) is not significantly altered. Similarly, Gap43, which is expressed in olfactory sensory neurons (73), shows no difference, and Omp (olfactory marker protein) actually shows increased expression.
A number of ion channels are downregulated, which may result from aberrant neuronal and/or glial function. Different classes of voltage-gated Na+, K+ and Ca2+ channels are reduced as well as several genes involved in Ca2+ regulation, including calretinin, calmodulin, calcineurin, CaMKII, ryanodine receptor-2, the sodium/calcium exchanger (Slc8a1) and the plasma membrane and endoplasmic reticulum Ca2+ transporting ATPases PCMA2 and SERCA2 (Atp2b2, Atp2a2). With the exception of calretinin, these transcripts do not show a decrease at 3 weeks, and the timing and degree of the reduction coincide with the decreased expression of neuronal genes observed at 4 months of age. Conversely, the Ca2+ binding annexin and S100 family proteins, which play a role in the state of GFAP polymerization, show increased expression levels by 3 weeks. These early changes in annexins and S100 proteins may be a direct response to the increased demands of GFAP assembly and disassembly.
The expression profiles from the two age groups of GFAP transgenic mice suggest that the course of pathology begins with a stress response in astrocytes that leads to the activation of microglia and ultimately, results in a loss of neurons and/or synaptic density. With an increase in expression of TNFα, IL-1β (data not shown), IL-6 and other cytokines, it would not be surprising to find neuronal death. The disruption of Ca2+ homeostasis would also have a detrimental effect, which may be reflected in the increased expression of genes regulating apoptosis (Supplementary Material, Table S1). Although the olfactory bulb layers appear somewhat disheveled (Fig. 1), cell death is not an obvious feature of the histology in the transgenic mice, and TUNEL staining does not show an increase in apoptotic cells (unpublished data). However, the overall mass of the olfactory bulbs is less in the transgenic mice (Sullivan et al., manuscript in preparation), and further studies are underway to address this point. The transcription profile points to the specific loss of markers for interneurons rather than projection or olfactory sensory neurons. Granule and periglomerular neurons are continuously replenished, even in the adult, through the steady migration of neuroblasts from the subventricular zone of the lateral ventricles via the rostral migratory stream and into the olfactory bulb where they radiate into the respective layers of the bulb and then mature (32,74). Rosenthal fibers and reactive astrocytes in the GFAP transgenic mice are found throughout the olfactory bulb but are also prominent in the periventricular regions. In addition, astrocytic type B cells form the tunnel through which the chains of neuroblasts migrate to the bulb and are thought to be the stem cells of this region (75). In culture, reactive astrocytes inhibit neurite outgrowth (76), and the specific inhibition of GFAP expression through transfection of anti-sense mRNA or treatment with estradiol abrogates this effect (77,78). It is intriguing to speculate that the observed decrease in neuronal marker expression in the olfactory bulb could be the result of a defect in stem cell migration and development.
As Alexander disease is often associated with defects in white matter, alterations in the expression of oligodendrocyte and myelin-related genes would be of particular interest. However, only a few myelin genes show subtle changes. The downregulation of Plp at 3 weeks followed by an increase in transcript levels at 4 months may suggest a delay in oligodendrocyte maturation. Elevated expression of Pdgfrα and Edg2 at 4 months may also indicate increased numbers of both precursor and myelinating oligodendrocytes, respectively. Other myelin-related genes analyzed, including those for Mbp, Mog and Mobp, show slight changes in expression, but these differences were not statistically significant. A more detailed analysis of these transcripts at different stages of myelination will be necessary to determine whether oligodendrocyte function is significantly altered.
Thus far, our studies suggest that the GFAP transgenic mice are only a partial model for Alexander disease. Histological examination of the Tg73.7 mice shows no overt changes in white matter architecture, contrary to the dramatic loss of myelin observed in the human disorder (particularly in the infantile form). Because GFAP knockout mice are relatively normal with only a slight increase in injury susceptibility (79–81), we have postulated that in Alexander disease, missense mutations of conserved residues in the GFAP coding sequence result in a dominant gain of function for the encoded protein (reviewed in 10). However, one study reporting late onset dysmyelination in GFAP knockout mice (82) suggests that loss of GFAP function may also be implicated in certain aspects of Alexander disease pathology. Although the transgenic mice do not show overt white matter pathology, we have shown that humans with AxD have elevated GFAP and display a similar expression profile of stress and immune-related genes including NQO1 and ITGAM (Mac1). In addition, transcripts for the astrocyte ferroxidase ceruloplasmin are elevated in AxD, corroborating the iron misregulation observed in the mice. Preliminary analysis of knockin mouse models with mutations homologous to those found in humans shows a relatively mild phenotype with fewer Rosenthal fibers compared with the GFAP transgenic animals (Hagemann and Messing, manuscript in preparation). As with other neurodegenerative disorders involving aggregate formation (83), a combined study of both the mutant and transgenic models will likely give a better understanding of the molecular pathology in humans than either model alone.
Several studies have shown that GFAP expression is also elevated during normal aging (84–86). Recently, microarray analysis of the transcription profile in aging mouse brains showed many of the same alterations in transcript levels as we observed in the GFAP transgenic mice at much earlier ages (87,88), including increased expression of stress and immune response genes and a decrease in expression of genes related to neuronal plasticity and development. The cumulative effect of oxidative stress in the aging brain is thought to give rise to reactive glia and a progressive inflammatory response (86,88). Here, we show that increased GFAP expression alone can induce similar changes, indicating that alterations in astrocyte gene expression can initiate a cascade of changes affecting multiple cell types throughout the CNS.
MATERIALS AND METHODS
Mice
Transgenic mice expressing the human GFAP gene were maintained in the FVB/N background as hemizygotes as previously described (11). For microarray analysis, olfactory bulbs were collected from three female mice at P23 and P120 for both GFAP transgenic [TgN(GFAP)Mes10; referred to as Tg73.7] and wild-type FVB/N mice. Females were selected because males are used as breeders to maintain production. The ARE-hPAP reporter mice carry a transgene consisting of the core antioxidant response element from the rat Nqo1 promoter driving the human placental alkaline phosphatase reporter gene (48).
Human subjects for transcript analysis
Brain samples for quantitative PCR were obtained through the University of Maryland Brain and Tissue Bank (Baltimore, MD, USA). Sample UMB613 represents a juvenile case of AxD, a 14-year-old male with an R79C mutation, and is paired with an age- and sex-matched control UMB1024. UMB885 represents an infantile AxD case, a 192-day-old female with an E373K mutation, and is paired with UMB615 (163-day-old male) and UMB435 (274-day-old male) as age-matched controls. White and gray matter samples were dissected from frozen sections of the frontal lobe for isolation of RNA, cDNA synthesis and quantitative PCR.
Microarray analysis
Analyses were performed with murine U74Av2 gene chips (Affymetrix, Santa Clara, CA, USA). RNA was isolated by homogenization of olfactory bulbs in Trizol (GibcoBRL, Rockville, MD, USA). Double stranded cDNA was synthesized with the SuperScript Choice System (Invitrogen, Carlsbad, CA, USA) and used as a template for in vitro transcription to generate biotinylated cRNA probes (Enzo BioArray kit, Farmingdale, NY, USA), as described in the Affymetrix Analysis Technical Manual. Microarrays were hybridized at 45°C for 16 h and then washed, stained and scanned on the GeneChip fluidics station and scanner. Data were analyzed with Microarray Suite 5.0 software (Affymetrix).
To determine the fold change in expression for each probe set (Table 1), signal values for each transgenic sample were compared with each control sample within the same age group to generate a signal log2 ratio for nine pairwise comparisons (three samples each). The signal log2 ratio was converted to the fold change in expression and averaged for each of the comparisons. A standard deviation value was determined for the average fold change (Supplementary Material, Table S1).
To identify genes showing significant changes in expression, we used rank analysis as described by Li and Johnson (21). Briefly, a change call is generated based on P-values for the probe pairs within each probe set (Wilcoxon's signed rank test, Microarray Suite 5.0). These change calls were converted to numerical values (increase=2, marginal increase=1, no change=0, marginal decrease=−1 and decrease=−2) and summed for the nine comparisons. This value was used to rank the significance of the average fold change. Changes ranked ≥9 or ≤−9 were considered significant increases or decreases, respectively. Gene annotations (Table 1) and descriptions were derived from the NetAffx (http://www.affymetrix.com/analysis/index.affx), UniGene, LocusLink and OMIM (http://www.ncbi.nlm.nih.gov/) databases. The complete data sets have been submitted to the National Center for Biotechnology Information Gene Expression Omnibus data repository under accession GSE977.
Quantitative PCR
RNA isolated as described earlier was converted to cDNA in a reverse transcription reaction with SuperScript II (1 µg RNA in a 20 µl reaction) according to the manufacturer's protocol (Invitrogen). To compare expression levels for a select number of genes from the microarray, primer sets were designed for quantitative PCR (Supplementary Material, Table S2) with either Lasergene (DNASTAR, Madison, WI, USA) or PE Express (Applied Biosystems, Foster City, CA, USA) software. To generate standards for each set of primers, amplified products from normal brain cDNA were either purified directly or cloned into the plasmid vector pCRII (Invitrogen). Standards were quantitated and 10-fold dilutions were prepared with 11 µg/ml yeast tRNA. Reactions were performed with SYBR Green PCR Master Mix (Applied Biosystems), 20 ng of each primer and the appropriate standard template or 0.4 µl of cDNA in a 20 µl volume. Reactions were performed in triplicate for the standards and each human cDNA sample and in duplicate for each mouse sample on an Applied Biosystems GeneAmp 5700 or 7000 Sequence Detector. Relative concentrations for each transcript were calculated according to the respective standard curve and normalized against the concentration of 18S ribosomal RNA.
RNase protection assay
Transcript levels for inflammatory cytokines were determined from brain and olfactory bulb RNA from three transgenic and three wild-type female mice 4 months of age with an RNase protection assay. RNA (5 µg) was hybridized to labeled probe (5.4×10⁵ c.p.m.) derived from in vitro transcription of the Pharmingen mCK-3b multi-probe template according to the RiboQuant protocol (Pharmingen, San Diego, CA, USA). For total brain (without olfactory bulb), RNA samples were hybridized in separate reactions; for olfactory bulb, transgenic and wild-type RNA samples were pooled separately and then hybridized. Hybridized samples were treated with RNase followed by Proteinase K, extracted with phenol/chloroform (1 : 1) and precipitated with ethanol. Pellets were resuspended in loading buffer and heated to 90°C before loading on to a denaturing 5% acrylamide (19 : 1) gel. Undigested probe (∼2000 c.p.m.) was loaded to serve as a size marker. Gels were analyzed with a Molecular Dynamics Storm phosphorimager, and probe signals were quantitated with ImageQuant software (Amersham Biosciences, Buckinghamshire, UK). Each cytokine probe was normalized against GAPDH. Assays were performed in triplicate for brain and once for olfactory bulb.
Immunohistochemistry
Three Tg73.7 and three wild-type FVB/N mice were analyzed for Mac1 expression. Female mice 4 months of age were perfused with 10 ml cold phosphate-buffered saline (PBS) followed by 50 ml 4% paraformaldehyde. Brains were removed and post-fixed in 4% paraformaldehyde for 4 h, cryoprotected in 30% sucrose and frozen in HistoPrep freezing media (Fisher Scientific, Pittsburgh, PA, USA). Floating sections (40 µm) were pre-treated with 0.2% H2O2 in PBS with 0.5% Triton X-100. After blocking for non-specific antibody binding (3% normal goat serum), sections were incubated with rat anti-mouse Mac1 (CD11b) antibody (1 : 200; Pharmingen no. 553308) for 16 h at 4°C, followed by biotinylated goat anti-rat Ig secondary antibody (1 : 200; Pharmingen no. 554050) for 1 h at room temperature. Sections were treated with ABC reagent (Vector Laboratories, Burlingame, CA, USA) for 30 min and then with 0.33 mg/ml DAB (3,3′-diaminobenzidine) chromogen with 0.012% H2O2 for 5 min. Sections were washed in PBS between incubations.
For GFAP immunohistochemistry, female mice 3 months of age were perfused with Histochoice Molecular Biology Fixative (Amresco, Solon, OH, USA). Brains were removed and post-fixed for 4 h, alcohol dehydrated and embedded in paraffin. Sections (10 µm) were de-paraffinized, rehydrated, pre-treated with 0.3% H2O2 in PBS with 0.25% Triton X-100 and blocked for non-specific antibody binding with 10% normal goat serum/1% BSA in PBS. Tissues were incubated with monoclonal GFAP antibody (Chemicon MAB3402) diluted in block (1 : 100) at 4°C for 16 h, followed by incubation with biotinylated horse anti-mouse Ig secondary antibody (1 : 200; Vector Laboratories) for 1 h at room temperature. Sections were treated with ABC reagent for 30 min, then with Vector SG chromogen and finally counterstained with eosin. Sections were washed in PBS between incubations.
ARE-hPAP histochemistry
Animals at 4 months of age were perfused with 4% paraformaldehyde as described earlier. Brains were immersion fixed for 1 h, alcohol dehydrated, paraffin embedded and sectioned for slides (6 µm). After de-paraffinizing and rehydration, sections were heated at 65°C for 30 min in AP buffer (0.1 m Tris pH 9.5/0.1 m NaCl/5 mm MgCl2) to inactivate endogenous alkaline phosphatases. Sections were then incubated in AP buffer with 0.17 mg/ml BCIP (5-bromo-4-chloro-3-indolyl phosphate; Sigma B6149, St Louis, MO, USA) for 24 h at 37°C. Sections were rinsed and counter stained with eosin.
Quantitation of NQO1 activity
To determine the relative activity of the quinone reductase NQO1 in transgenic mice compared with wild-type, a biochemical assay was used to measure the reduction of menadione by NQO1 (49). Three female transgenic and three wild-type littermates were euthanized at 3 months for tissue collection. Brain lysates were prepared by homogenizing one-half brain (bisected sagittally) in 1 ml lysis buffer (0.8% Triton X-100/2 mm EDTA pH 7.4). Homogenates were cleared by centrifugation at 14 K r.p.m. for 2 min at 4°C (Eppendorf rotor 16F24-11). Supernatants were collected, protein content quantified (Bio-Rad Protein Assay, Hercules, CA, USA) and lysates diluted to 25 µg/µl in lysis buffer. In a microtiter plate, 200 µl of a reaction cocktail consisting of 25 mm Tris–HCl pH 7.4; 0.01% Tween-20; 65 mg/ml BSA; 5 µm FAD; 30 µm NADP; 1 mm glucose-6-phosphate; 10 U/ml yeast glucose-6-phosphate dehydrogenase; 0.3 mg/ml MTT [3-(4,5-dimethylthiazo-2-yl)-2,5-diphenyltetrazolium bromide] and 50 µm menadione were added to 50 µl diluted lysate in triplicate. Reactions were incubated at room temperature for 25 min and stopped with 50 µl of dicumarol solution (0.3 mm dicumarol; 0.5% DMSO; 5 mm potassium phosphate buffer pH 7.4). The reduction of MTT by menadiol results in the production of blue formazan, which was measured spectrophotometrically at 610 nm. To subtract background activity, similar reactions were prepared by adding the stop solution to the protein lysate before incubation with the reaction cocktail. Triplicate values were averaged for each sample and relative activity is expressed as absorbance/mg protein.
Iron histochemistry
To assess the distribution and concentration of iron in the brain, the histochemical method described by Hill and Switzer (89) was used to stain frozen sections from both wild-type and Tg73.7 mice at 3 months of age. Mice were perfused with 10% formalin in PBS before dissection. Brains were immersion fixed overnight, cryoprotected in 30% sucrose, frozen in OCT and 40 µm sections were cut with a sliding microtome and mounted on slides. Sections were treated with Perl's solution (1% potassium ferrocyanide, 1% HCl) for 30 min, rinsed in H2O for 30 min and stained with 5 mg/ml DAB chromogen in sodium phosphate buffer pH 7.4 with 0.005% H2O2 for 15 min. Slides were rinsed again in H2O for 30 min, dehydrated and coverslips applied. Control slides were treated with DAB solution only and showed minimal background peroxide activity.
SUPPLEMENTARY MATERIAL
Supplementary Material is available at HMG Online.
ACKNOWLEDGEMENTS
We sincerely thank Heide Peickert and Denice Springman for technical support, and Matthew Slattery and the Microarray Core Facility of the University of Wisconsin Environmental Health Science Center for performing the microarray hybridizations and data analysis. We also thank Michael Brenner for critical evaluation of the manuscript, Jiang Li for advice regarding data analysis and Guomei Tang and James Goldman for sharing their unpublished data. Tissue samples were obtained from the Brain and Tissue Bank at the University of Maryland under contract N01-HD43368 from the NIH. This work was supported by NIH grants NS22475 and NS42803 (to A.M.), ES08089 and ES10042 (to J.A.J.) and ES09090 (to the Environmental Health Sciences Center) and by HD03352 to the Waisman Center.
Conflict of Interest statement. None declared.
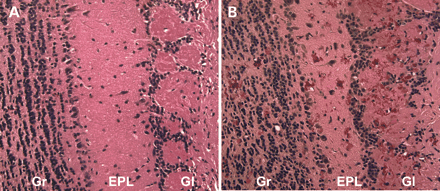
Figure 1. Rosenthal fibers in the olfactory bulb of GFAP transgenic mice. Hematoxylin and eosin stain of olfactory bulbs in Tg73.7 GFAP transgenic female mice at 3 months of age. Rosenthal fibers in the form of eosinophilic aggregates are present throughout the bulb and particularly in the glomerular layer (B). Wild-type age- and sex-matched mice show no aggregate formation as demonstrated in (A). Gr, granular cell layer and white matter tracts; EPL, external plexiform layer; Gl, glomerular layer (200× magnification).
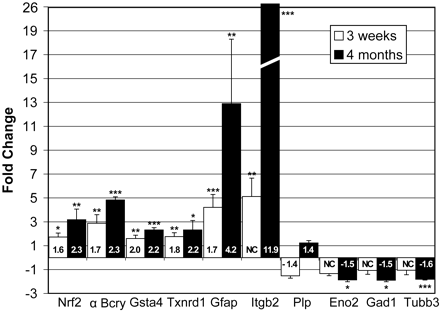
Figure 2. Confirmation of microarray analysis through quantitative RT–PCR. cDNA generated from the same olfactory bulb RNA, which was used for microarray analysis, was analyzed for changes in the levels of specific transcripts. Changes in expression are represented as the ratio of Tg73.7 transcript over wild-type levels (or the reciprocal for negative fold changes). White and black bars represent the average fold change for mice 3 weeks and 4 months of age, respectively. Quantitative-PCR for olfactory bulb mRNA showed comparable or higher levels of gene expression in Tg73.7 mice as was shown by microarray analysis. Probe primer sets were generated from the sequences indicated in the Supplementary Material, Table S2: nuclear factor erythroid derived 2, like 2, Nrf2 (Nfe2l2), αB-crystallin (Cryab), glutathione-S-transferase α4 (Gsta4), thioredoxin (Txnrd1), glial fibrillary acidic protein (Gfap), integrin β2 or Cd18 (Itgb2), proteolipid protein (Plp), enolase-2 (Eno2), Gad67 (Gad1), βIII-tubulin (Tubb3). Numbers inside bars indicate fold change as determined by microarray analysis for comparison (Table 1). Error bars represent standard deviation for quantitative PCR, and asterisks indicate significance (***P<0.001; **P<0.01; *P<0.05; two-tailed unpaired t-test).
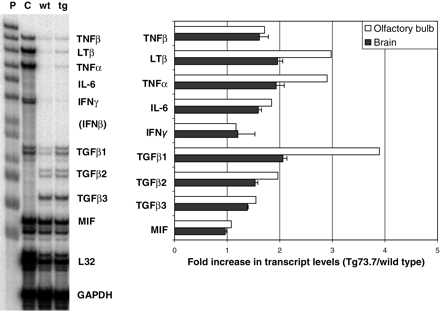
Figure 3. RNase protection assay for TNF and TGF family cytokine expression. Total RNA from Tg73.7 transgenic and wild-type mice (4 months) was used to evaluate the immune response profile with a cytokine probe set in an RNase protection assay. The autoradiogram shows the undigested probe set (P) and digest products after hybridization with control murine RNA (C), wild-type olfactory bulb RNA (wt) and Tg73.7 olfactory bulb RNA (tg). The chart indicates the fold-increase in expression levels for the various cytokines in the transgenic mice in both olfactory bulb and whole brain. For fold-increase in brain (without olfactory bulb), error bars represent standard deviation for triplicate assays. For olfactory bulb, RNA samples were pooled separately for the same transgenic and wild-type mice as described earlier and assayed only once; error bars are not indicated.
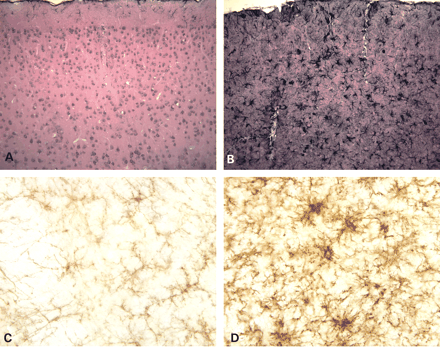
Figure 4. Reactive astrocytes and microglia in GFAP transgenic mice. Immunohistochemical staining for GFAP shows a dramatic difference in astrocyte morphology and in the apparent expression of the intermediate filament in the GFAP transgenic mice compared with wild-type at 3 months of age. The wild-type mice (A) show only sparse staining of subpial and perivascular astrocytes in the cortex, whereas the transgenic mice (B) demonstrate intensely stained hypertrophied astrocytes throughout (100×). Immunohistochemical staining with Mac1 antibodies (anti-Cd11b) shows a marked increase in expression in Tg73.7 mice (4 months). Microglia are present in wild-type olfactory bulb (C), but are ramified and not activated. Microglia in Tg73.7 olfactory bulb (D) show intense Mac1 staining and have a hypertrophied morphology (400×).
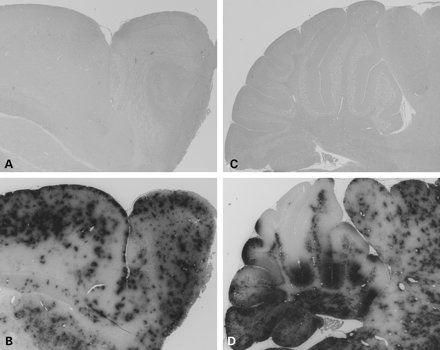
Figure 5. GFAP transgenic mice show activation of ARE responsive genes. At 4 months of age, brains from normal ARE-hPAP reporter mice show almost no alkaline phosphatase activity (A and C), whereas mice expressing both the ARE-hPAP and hGFAP transgenes show significant increases in reporter activity as demonstrated by dark staining throughout the brain (B and D). Olfactory bulb (A and B) and cerebellum (C and D) are shown.
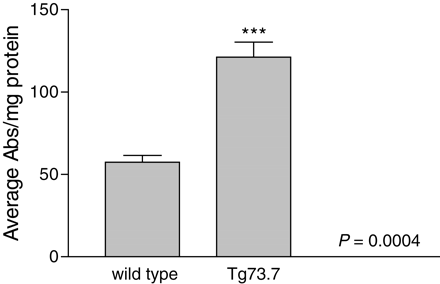
Figure 6. NQO1 activity in GFAP transgenic mice compared with normal animals. Brain lysates derived from three transgenic and three wild-type mice 3 months of age were analyzed for NQO1 activity in a colorimetric biochemical assay (Materials and Methods). Quinone reductase activity is expressed relatively as absorbance/mg protein and values averaged for the three samples in each group. GFAP transgenic mice show a 2.1-fold increase in activity when compared with wild-type (121.1/57.5 abs/mg). Error bars represent standard deviation; ***P=0.0004.
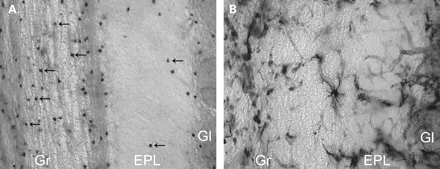
Figure 7. Iron accumulation in brains from GFAP transgenic mice. Histochemical analysis for iron in olfactory bulb from 3 months wild-type (A) and transgenic (B) mice shows heavy globular staining in the transgenic mice. Reactive astrocytes (B, center) show intracellular iron accumulation, and blood vessel walls also appear to be outlined. Wild-type mice exhibit a more uniform staining pattern where oligodendrocytes (arrows) are the predominant cell type highlighted (A). Gr, granular cell layer and white matter tracts; EPL, external plexiform layer; Gl, glomerular layer (200× magnification).
![Figure 8. Stress and immune-related genes show increased expression in AxD patients. Real-time quantitative PCR was used to assay transcript levels for GFAP, NQO1 [NAD(P)H: quinone oxidoreductase], ITGAM (CD11b, Mac1), and CP (ceruloplasmin) in white (white bars) and gray matter (gray bars) from both AxD patients (hatched bars) and age-matched controls (C, open bars). Transcript levels are expressed in relative units based on a standard curve (y-axis) and normalized to rRNA. The coefficient of variation for triplicate measures was typically <15%.](https://oup.silverchair-cdn.com/oup/backfile/Content_public/Journal/hmg/14/16/10.1093_hmg_ddi248/2/m_ddi24808.gif?Expires=1716404639&Signature=Qrn77-bh~gTBSWlksw1zEIwFmXQ9Ieq9mf~ej1Yx-nsqCtddXRPDzUzY41yu0ChdAwajYIRhyPaRqQ6Rv8LLv~tJtUCwp3bEcrBHIECQvyFRHbOHgB1NTjbhT76g62qndAYTKgdy6BlCFxgLN9KdhW126yveessMwsira0t2MZ060Jppjvt~b896zOiOYAfLTENU5JGHzehyOP9KqV5H1IPvmCGBmg~WPnoAaehrhLEEwaGzC4MGhH2w1Xe7cPgbqMOZ3eCbl1jWcgiPDpd6Ez6Xa3iYkFD2O~YvYs7hYqtOmCa-~bhda-tEYBCMoVYGYzXrmwJFHfH6i7PiVSm0GQ__&Key-Pair-Id=APKAIE5G5CRDK6RD3PGA)
Figure 8. Stress and immune-related genes show increased expression in AxD patients. Real-time quantitative PCR was used to assay transcript levels for GFAP, NQO1 [NAD(P)H: quinone oxidoreductase], ITGAM (CD11b, Mac1), and CP (ceruloplasmin) in white (white bars) and gray matter (gray bars) from both AxD patients (hatched bars) and age-matched controls (C, open bars). Transcript levels are expressed in relative units based on a standard curve (y-axis) and normalized to rRNA. The coefficient of variation for triplicate measures was typically <15%.
Classification of genes with altered expression in GFAP transgenic mice
| Affy ID | Gene | 3 weeks | 4 months |
|---|---|---|---|
| Stress response | |||
| Detoxification/antioxidant/reducing proteins | |||
| 102094_f_at | Gstm1: glutathione S-transferase, mu 1 | 2.1 | 2.6 |
| 96085_at | Gsta4: glutathione S-transferase, alpha 4 | 2.0 | 2.2 |
| 94351_r_at | Nqo1: NAD(P)H dehydrogenase, quinone 1 | 1.7 | 3.8 |
| 162308_f_at | Cryab: crystallin, alpha B | 1.7 | 2.3 |
| 92562_at | Nfe2l2: nuclear factor erythroid derived 2, like 2; Nrf2 | 1.6 | 2.3 |
| 93573_at | Mt1: metallothionein 1 | 2.0 | 1.6 |
| 160479_at | Cat: catalase | 1.5 | 1.5 |
| 101676_at | Gpx3: glutathione peroxidase 3 | 1.7 | 2.4 |
| 160646_at | Gsr: glutathione reductase 1 | 1.5 | |
| 99985_at | Txnrd1: thioredoxin reductase 1 | 1.8 | 2.2 |
| 100332_s_at | Prdx6: peroxiredoxin 6 | 2.0 | 3.0 |
| 160335_at | Gclm: glutamate-cysteine ligase, modifier subunit | 1.5 | 1.7 |
| NADPH metabolism | |||
| 95066_at | Taldo1: transaldolase 1 | 1.3 | 2.0 |
| 101294_g_at | G6pd2: glucose-6-phosphate dehydrogenase 2 | 1.6 | |
| Iron homeostasis | |||
| 92851_at | Cp: ceruloplasmin | 5.0 | 11.7 |
| 99872_s_at | Ftl1: ferritin light chain 1 | 1.3 | 1.9 |
| 94794_at | Fth: ferritin heavy chain | 1.4 | 1.8 |
| 160564_at | Lcn2: Lipocalin 2 | 10.8 | 11.9 |
| Immune response | |||
| Cytokines and receptors | |||
| 102736_at | Ccl2: chemokine (C-C motif) ligand 2, (Scya 2, Mcp1) | 50.1 | 87.6 |
| 92459_at | Ccl8: chemokine (C-C motif) ligand 8, (Scya 8, Mcp2) | 16.2 | |
| 98406_at | Ccl5: chemokine (C-C motif) ligand 5, (Scya 5, Rantes) | 12.0 | |
| 99413_at | Ccr1: chemokine (C-C motif) receptor 1, MIP1alpha receptor | 8.8 | |
| 161968_f_at | Ccr5: chemokine (C-C motif) receptor 5 | 2.6 | 4.2 |
| 104354_at | Csf1r: colony stimulating factor 1 receptor | 1.9 | 4.6 |
| 102255_at | Osmr: oncostatin receptor | 3.5 | 10.7 |
| 92793_at | Tnfrsf1a: TNF receptor superfamily, member 1a | 1.5 | 2.8 |
| 101918_at | Tgfb1: transforming growth factor, beta 1 | 2.1 | |
| Complement/acute phase response | |||
| 98562_at | C1qa: complement component 1, q subcomponent, a | 2.6 | 8.9 |
| 93497_at | C3: complement component 3 | 2.2 | 8.7 |
| 99071_at | Mpeg1: macrophage expressed gene 1; Mpg1 | 2.9 | |
| 92731_at | Ptx3: pentaxin related gene (TSG-14) | 4.1 | 5.4 |
| 95597_at | Ptgs1: prostaglandin-endoperoxide synthase 1,Cox1 | 2.9 | |
| 92401_at | Ltc4s: leukotriene C4 synthase | 2.4 | |
| Adhesion | |||
| 98828_at | Itgam: integrin alpha M, (Mac1, CD11b) | 13.3 | |
| 102353_at | Itgb2: integrin beta 2 (Mac1 CD18) | 11.9 | |
| 95706_at | Lgals3: lectin,galactose binding, soluble3(Mac2,Galectin-3) | 16.4 | |
| 97519_at | Spp1: Secreted phosphoprotein 1 (osteopontin) | 5.2 | |
| 103016_s_at | Cd68: CD68 antigen, macrosialin | 5.8 | |
| Signal transduction/transcription regulation | |||
| 160894_at | Cebpd: CCAAT/enhancer binding protein (C/EBP), delta | 3.1 | 7.6 |
| 92925_at | Cebpb:CCAAT/enhancer binding protein (C/EBP), beta | 1.9 | 3.5 |
| 101048_at | Ptprc: protein tyrosine phosphatase receptor CD45 | 19.0 | |
| 99799_at | Vav: vav oncogene | 9.0 | |
| 99509_s_at | Jak3: Janus kinase 3 | 2.3 | |
| 94331_at | Stat6: signal transducer and activator of transcription 6 | 2.3 | |
| 92232_at | Socs3: suppressor of cytokine signaling 3 | 12.0 | |
| Cytoskeletal | |||
| 103549_at | Nes: nestin | 1.9 | 4.3 |
| 94144_g_at | Gfap: glial fibrillary acidic protein | 1.7 | 4.2 |
| 161329_f_at | Cappb1: capping protein beta 1 | 2.4 | 3.9 |
| 160106_at | Capg: capping protein (actin filament), gelsolin-like | 6.9 | |
| 93750_at | Gsn: gelsolin | 2.1 | |
| 92346_at | Nef3: neurofilament 3, medium | −2.6 | |
| 102307_at | Dcx: doublecortin | −2.0 | |
| 161612_f_at | Tubb3: tubulin, beta 3 | −1.6 | |
| 97760_at | Mtap2: microtubule-associated protein 2 (MAP2) | −1.8 | |
| 102742_g_at | Mapt: microtubule-associated protein tau | −1.2 | −1.7 |
| 94335_r_at | Ina: internexin neuronal intermediate filament protein, α | −1.7 | |
| Vesicular trafficking | |||
| 101629_s_at | Stx1b2: syntaxin 1B2 | −2.0 | |
| 93005_at | Syt1: synaptotagmin 1 | −1.6 | |
| 98925_at | Vamp2: vesicle-associated membrane protein 2 | −1.6 | |
| 101198_at | Cplx1: complexin 1 | −1.6 | |
| 100047_at | Snap25: synaptosomal-associated protein 25 | −1.5 | |
| 160181_at | Syp: synaptophysin | −1.5 | |
| Neurotransmission | |||
| 101215_at | Gabra2: GABA-A receptor, subunit alpha 2 | −1.8 | |
| 99342_at | Gabrd: GABA-A receptor, subunit delta | −4.9 | |
| 161059_at | Gabt1: GABA-A transporter 1 | −1.7 | |
| 103061_at | Gad1: glutamic acid decarboxylase 1 (GAD67) | −1.5 | |
| 92899_at | Gad2: glutamic acid decarboxylase 2 (GAD65) | −1.6 | |
| 92943_at | Gria1: glutamate receptor AMPA1 (alpha 1) | −1.3 | −1.6 |
| 92945_at | Gria2: glutamate receptor AMPA2 (alpha 2) | −1.8 | |
| 104685_g_at | Grin1: glutamate receptor NMDA1 (zeta 1) | −2.0 | |
| Neurogenesis | |||
| 98394_at | Dlx1: distal-less homeobox 1 | −1.6 | |
| 92332_at | Dlx2: distal-less homeobox 2 | −1.7 | |
| 92930_at | Dlx5: distal-less homeobox 5 | −1.6 | |
| 93615_at | Pbx3: pre B-cell leukemia transcription factor 3 | −1.9 | |
| 98790_s_at | Meis1: myeloid ecotropic viral integration site 1 | −1.8 | |
| 92271_at | Pax6: paired box gene 6 | −1.4 | |
| 99045_at | Eno2: enolase 2, gamma neuronal | −1.5 | |
| 99407_at | Omp: olfactory marker protein | 1.5 | |
| Channels/ion transporters | |||
| 102571_at | Gjb6: gap junction protein beta 6 (connexin-30) | −1.4 | −1.8 |
| 98423_at | Gjb2: gap junction protein beta 2 (connexin-26) | −1.3 | −1.3 |
| 104460_at | Cacna1g: calcium channel, voltage-dependent, alpha 1G | −2.1 | |
| 98483_at | Cacnb3: calcium channel, voltage-dependent, beta 3 | −1.6 | |
| 99524_at | Slc8a1:solute carrier family8 (Na/Ca exchanger), member 1 | −1.5 | |
| 102653_at | Ryr2: ryanodine receptor 2, cardiac | −1.6 | |
| 95324_at | Atp2b2:ATPase,Ca transport, plasma membrane2, PCMA2 | −1.7 | |
| 99570_s_at | Atp2a2:ATPase,Ca transport,cardiac muscle 2, SERCA2 | −1.6 | |
| Myelination | |||
| 92802_s_at | Plp: proteolipid protein (myelin) | −1.4 | 1.4 |
| 100566_at | Igfbp5: insulin-like growth factor binding protein 5 | −1.4 | 2.0 |
| 102395_at | Pmp22: peripheral myelin protein, 22 kDa (gas-3) | 1.4 | 3.7 |
| 100435_at | Edg2: endothelial differentiation, lysophosphatidic acid G-protein-coupled receptor, 2 | 1.8 | |
| 95079_at | Pdgfra: platelet-derived growth factor receptor, alpha | 1.6 | |
| 102405_at | Mag: myelin-associated glycoprotein | 1.6 | |
| 95096_at | Qk: quaking | −1.3 | |
Genes in boldface are regulated by the transcription factor Nfe212.
References
Brenner, M., Johnson, A.B., Boespflug-Tanguy, O., Rodriguez, D., Goldman, J.E. and Messing, A. (
Alexander, W.S. (
Herndon, R.M., Rubinstein, L.J., Freeman, J.M. and Mathieson, G. (
Iwaki, T., Iwaki, A., Tateishi, J., Sakaki, Y. and Goldman, J.E. (
Messing, A. and Goldman, J.E. (
Li, R., Messing, A., Goldman, J.E. and Brenner, M. (
Mignot, C., Boespflug-Tanguy, O., Gelot, A., Dautigny, A., Pham-Dinh, D. and Rodriguez, D. (
Yang, J.M., Nam, K., Kim, S.W., Jung, S.Y., Min, H.G., Yeo, U.C., Park, K.B., Lee, J.H., Suhr, K.B., Park, J.K. and Lee, E.S. (
Fuchs, E. and Cleveland, D.W. (
Messing, A. and Brenner, M. (
Messing, A., Head, M.W., Galles, K., Galbreath, E.J., Goldman, J.E. and Brenner, M. (
Eng, L.F., Ghirnikar, R.S. and Lee, Y.L. (
Eddleston, M. and Mucke, L. (
Privat, A. (
Borrett, D. and Becker, L.E. (
Townsend, J.J., Wilson, J.F., Harris, T., Coulter, D. and Fife, R. (
Pridmore, C.L., Baraitser, M., Harding, B., Boyd, S.G., Kendall, B. and Brett, E.M. (
Martin, P.M. and O'Callaghan, J.P. (
Li, J. and Johnson, J.A. (
Venugopal, R. and Jaiswal, A.K. (
Wild, A.C., Moinova, H.R. and Mulcahy, R.T. (
Ishii, T., Itoh, K., Takahashi, S., Sato, H., Yanagawa, T., Katoh, Y., Bannai, S. and Yamamoto, M. (
Nguyen, T., Huang, H.C. and Pickett, C.B. (
Chanas, S.A., Jiang, Q., McMahon, M., McWalter, G.K., McLellan, L.I., Elcombe, C.R., Henderson, C.J., Wolf, C.R., Moffat, G.J., Itoh, K., Yamamoto, M. and Hayes, J.D. (
Long, J.E., Garel, S., Depew, M.J., Tobet, S. and Rubenstein, J.L. (
Masuda, Y., Sasaki, A., Shibuya, H., Ueno, N., Ikeda, K. and Watanabe, K. (
Sasaki, A., Masuda, Y., Iwai, K., Ikeda, K. and Watanabe, K. (
Stoykova, A. and Gruss, P. (
Stenman, J., Toresson, H. and Campbell, K. (
Toresson, H., Parmar, M. and Campbell, K. (
Serodio, P. and Rudy, B. (
Nagy, J.I., Li, X.B., Rempel, J., Stelmack, G., Patel, D., Staines, W.A., Yasumura, T. and Rash, J.E. (
Rash, J.E., Yasumura, T., Davidson, K.G., Furman, C.S., Dudek, F.E. and Nagy, J.I. (
Nagy, J.I. and Rash, J.E. (
Donato, R. (
Filipek, A., Wojda, U. and Lesniak, W. (
Seemann, J., Weber, K. and Gerke, V. (
Mailliard, W.S., Haigler, H.T. and Schlaepfer, D.D. (
Garbuglia, M., Bianchi, R., Verzini, M., Giambanco, I. and Donato, R. (
Snipes, G.J., Suter, U., Welcher, A.A. and Shooter, E.M. (
Cheng, H.L., Shy, M. and Feldman, E.L. (
Allard, J., Barron, S., Diaz, J., Lubetzki, C., Zalc, B., Schwartz, J.C. and Sokoloff, P. (
Wu, J.I., Reed, R.B., Grabowski, P.J. and Artzt, K. (
Larocque, D., Pilotte, J., Chen, T., Cloutier, F., Massie, B., Pedraza, L., Couture, R., Lasko, P., Almazan, G. and Richard, S. (
Johnson, D.A., Andrews, G.K., Xu, W. and Johnson, J.A. (
Prochaska, H.J. and Santamaria, A.B. (
Connor, J.R. and Menzies, S.L. (
Lee, J.-M., Calkins, M.J., Chan, K., Kan, Y.W. and Johnson, J.A. (
Castellani, R.J., Perry, G., Harris, P.L.R., Monnier, V.M., Cohen, M.L. and Smith, M.A. (
Castellani, R.J., Perry, G., Harris, P.L.R., Cohen, M.L., Sayre, L.M., Salomon, R.G. and Smith, M.A. (
Patel, B.N. and David, S. (
Salzer, J.L., Lovejoy, L., Linder, M.C. and Rosen, C. (
Klomp, L.W. and Gitlin, J.D. (
Attieh, Z.K., Mukhopadhyay, C.K., Seshadri, V., Tripoulas, N.A. and Fox, P.L. (
Wasserman, W.W. and Fahl, W.E. (
Tsuji, Y., Ayaki, H., Whitman, S.P., Morrow, C.S., Torti, S.V. and Torti, F.M. (
Curtis, A.R., Fey, C., Morris, C.M., Bindoff, L.A., Ince, P.G., Chinnery, P.F., Coulthard, A., Jackson, M.J., Jackson, A.P., McHale, D.P. et al. (
Qian, Z.M. and Shen, X. (
LaVaute, T., Smith, S., Cooperman, S., Iwai, K., Land, W., Meyron-Holtz, E., Drake, S.K., Miller, G., Abu-Asab, M., Tsokos, M. et al. (
Wang, J., Asensio, V.C. and Campbell, I.L. (
Campbell, I.L., Abraham, C.R., Masliah, E., Kemper, P., Inglis, J.D., Oldstone, M.B. and Mucke, L. (
Castelnau, P.A., Garrett, R.S., Palinski, W., Witztum, J.L., Campbell, I.L. and Powell, H.C. (
Campbell, I.L. (
Takemura, M., Gomi, H., Colucci-Guyon, E. and Itohara, S. (
Bulfone, A., Wang, F., Hevner, R., Anderson, S., Cutforth, T., Chen, S., Meneses, J., Pedersen, R., Axel, R. and Rubenstein, J.L. (
Carleton, A., Petreanu, L.T., Lansford, R., Alvarez-Buylla, A. and Lledo, P.M. (
Schoppa, N.E. and Westbrook, G.L. (
Hevner, R.F., Shi, L., Justice, N., Hsueh, Y., Sheng, M., Smiga, S., Bulfone, A., Goffinet, A.M., Campagnoni, A.T. and Rubenstein, J.L. (
Neuman, T., Keen, A., Zuber, M.X., Kristjansson, G.I., Gruss, P. and Nornes, H.O. (
Verhaagen, J., Oestreicher, A.B., Gispen, W.H. and Margolis, F.L. (
Lois, C. and Alvarez-Buylla, A. (
Gritti, A., Bonfanti, L., Doetsch, F., Caille, I., Alvarez-Buylla, A., Lim, D.A., Galli, R., Verdugo, J.M., Herrera, D.G. and Vescovi, A.L. (
McKeon, R.J., Schreiber, R.C., Rudge, J.S. and Silver, J. (
Costa, S., Planchenault, T., Charriere-Bertrand, C., Mouchel, Y., Fages, C., Juliano, S., Lefrancois, T., Barlovatz-Meimon, G. and Tardy, M. (
Rozovsky, I., Wei, M., Stone, D.J., Zanjani, H., Anderson, C.P., Morgan, T.E. and Finch, C.E. (
Gomi, H., Yokoyama, T., Fujimoto, K., Ideka, T., Katoh, A., Itoh, T. and Itohara, S. (
Pekny, M., Levéen, P., Pekna, M., Eliasson, C., Berthold, C.-H., Westermark, B. and Betsholtz, C. (
McCall, M.A., Gregg, R.G., Behringer, R.R., Brenner, M., Delaney, C.L., Galbreath, E.J., Zhang, C.L., Pearce, R.A., Chiu, S.Y. and Messing, A. (
Liedtke, W., Edelmann, W., Bieri, P.L., Chiu, F.C., Cowan, N.J., Kucherlapati, R. and Raine, C.S. (
Watase, K. and Zoghbi, H.Y. (
Goss, J.R., Finch, C.E. and Morgan, D.G. (
Nichols, N.R., Day, J.R., Laping, N.J., Johnson, S.A. and Finch, C.E. (
Finch, C.E. (
Lee, C.K., Weindruch, R. and Prolla, T.A. (
Weindruch, R. and Prolla, T.A. (
