


Abstract
This study examines national variations in social networks among older adults across 4 countries in diverse regions of the world: Japan, Lebanon, Mexico, and the United States. The aim is to provide insights into universal as well as unique attributes of social networks in later life.
The analyses examine convoy characteristics among adults aged 50+ in metropolitan areas of Japan (N = 557), Lebanon (N = 284), Mexico (N = 556), and the United States (N = 583). Data were collected using the hierarchical mapping technique on representative samples in each locale. Multilevel models were conducted by nation to examine whether convoy characteristics vary by age and closeness.
Network size and geographic proximity were dimensions of social networks sensitive to national context. By contrast, how age and feelings of closeness varied with contact frequency and the presence of children in networks revealed universal patterns. Furthermore, feelings of closeness varied by age with regard to size and contact frequency in Lebanon, proximity in Japan, and composition in Mexico.
Identifying universal and unique characteristics of social networks in later life provide a preliminary empirical basis upon which to advance a global perspective on convoys of social relations and how they inform policies that can facilitate health and well-being among middle-aged and older people around the world.
Social relationships are a fundamental human experience. They facilitate integration and emotional intimacy, constituting an essential element of well-being across the life course (Antonucci, Ajrouch, & Birditt, 2014; Kawachi & Berkman, 2001; Uchino, 2004). Social networks, in particular, constitute a key foundation from which relationships begin, grow, and develop (Kahn & Antonucci, 1980). It is becoming increasingly clear that context has a notable influence on the form and expression of social networks (Berkman, Glass, Brissette, & Seeman, 2000; McPherson, Smith-Lovin, & Cook, 2001). Though social networks are a universal human experience, national context (e.g., geography, demography, policies, and programs) may condition the structure of social networks (Antonucci, Ajrouch, & Abdulrahim, 2015; Antonucci et al., 2001). Moreover, relationships arising through these networks may vary by age and feelings of closeness (Antonucci & Akiyama, 1987; Carstensen, 1995). In sum, social networks serve as a foundation of human interaction universally, yet their formation and characteristics may vary within national contexts.
The science of social relations has advanced in recent decades to include improvements with regard to theoretical and methodological approaches (Antonucci et al., 2014; Reis, Collins, & Berscheid, 2000). Indeed, such developments have evolved to facilitate systematic investigation within and across nations. This study seeks to better understand national variations in social networks among older adults in four countries that represent diverse regions of the world: Japan, Lebanon, Mexico, and the United States. Because each country embodies a distinct context in terms of population aging, study findings will provide important insights into universal aspects, as well as unique attributes, of social networks in later life. A consideration of social networks in four different countries during the latter part of the life course provides a unique opportunity to examine the applicability of the convoy model within different contexts and advance a global perspective on social relations.
Convoys of Social Relations
The theoretical construct of social relations guides our investigation of how age and closeness shape network characteristics in various national contexts. In particular, we conceptualize social relations as a convoy to allow for the parsimonious representation of highly complex human interactions. According to the convoy model, individuals are surrounded by supportive others who move with them throughout the life course (Antonucci et al., 2014; Kahn & Antonucci, 1980). These relationships vary in their closeness, and are influenced by personal (e.g., age) and situational (e.g., national) characteristics, while having significant implications for health and well-being.
We capitalize on several theoretical assumptions in using the convoy model to frame the current study. First, social relations are conceptualized as multidimensional. In their most basic form, they include structure, type, and quality dimensions (Antonucci et al., 2014). In the current study, we focus on network structure, a necessary prerequisite for support exchanges. Social network structural characteristics are size (the number of individuals named that comprise one’s network), geographic proximity (the physical distance between the individual and network members), contact frequency (the regularity with which one has contact with their network), and composition (relationship type). Second, by discerning relationship type (i.e., child) of an identified network member, we have the ability to investigate specific patterns with a key family member. Third, convoys of social relations include three levels of closeness as indicated by inner, middle, and outer circles that surround the individual. The inner circle often includes immediate family members, whereas the middle and outer circles contain connections beyond immediate family. Middle and outer circle membership are hypothesized to represent critical links with additional individuals who may foster associations with the wider society and perhaps potential “replacements” when inner circle members are lost (e.g., due to death) (Antonucci & Akiyama, 1987). Finally, the convoy model itself posits the contextual nature of social relations with situational characteristics key to the formation and expression of social relations (Antonucci et al., 2015). Situational characteristics within a national context might include elements such as geography, demography, programs, and policies.
Using the convoy model, we identify national context as a key situational factor that may affect the ways in which age and closeness are associated with the structure of social networks. Fortunately, the notion of a convoy easily translates to divergent cultural and national contexts. People of all ages, from young to old, and in distinct settings quite readily identify close and important persons and differentiate them from persons who are less close and important (Antonucci et al., 2014; Antonucci, Fuhrer, & Dartigues, 1997; Phillipson, Bernard, Phillips, & Ogg 2001; Wagner, Schütze, & Lang, 1999). Because the convoy model does not impose role-based membership regarding social relations, it facilitates scientifically studying social networks and advances our understanding of the ways in which elements of social relations are universal as well as unique across diverse populations and contexts.
National Context, Age, and Social Networks
The social and demographic characteristics of each country represent key situational characteristics that may influence the structure of social networks (see Table 1). Within a global context, Japan, located in East Asia, is a relatively small country in geographic and population size (377,930 km2; population 127 million); though Lebanon, located in Western Asia, is even smaller (10,452 km2; population 4.9 million). Quite a bit larger in geographic size are Mexico (1,964,375 km2; population 124 million) and the United States (9,833,517 km2; population 323 million), both located in North America with Mexico only slightly smaller than Japan in population while the population of the United States is substantially larger than all three countries combined. Each country varies in terms of economic conditions. The United States reports the highest GDP per capita ($52,392), whereas Mexico ($10,293) is much lower. Japan has the second highest GDP per capita ($38,528), and Lebanon reports the lowest ($9,793). Countries that report higher GDP per capita and are geographically larger may be associated with social networks that have less contact frequency and lower proportions with close proximity given that industrialization often promotes geographic mobility.
Social and Demographic Background of Study Countries
| Japan | Lebanon | Mexico | United States | |
|---|---|---|---|---|
| Surface area (km2)a | 377,930 | 10,452 | 1,964,375 | 9,833,517 |
| Total population (thousands)a | 127,000 | 4,966 | 123,799 | 322,583 |
| GDP per capita ($US) (2013)a | 38,528 | 9,793 | 10,293 | 52,392 |
| Percent above 60 years (2014)a | ||||
| Men | 29.9 | 12.0 | 9.0 | 18.5 |
| Women | 35.5 | 12.5 | 10.6 | 21.8 |
| Life expectancy at birth (2010–2015)a | ||||
| Men | 80.0 | 77.9 | 74.9 | 76.4 |
| Women | 86.9 | 82.1 | 79.7 | 81.2 |
| Total fertility rateb | ||||
| Year-1960 | 2.0 | 5.7 | 6.8 | 3.7 |
| Year-2014 | 1.4 | 1.7 | 2.2 | 1.9 |
| Social security | Yesc | Partiald | Partiale | Yesf |
| Health care | Yesc | Partiald | Partiale | Yesf |
| Long-term care | Yesc | Nod | Noe | Nof |
aUnited Nations Statistics Division—Country Profile (http://data.un.org/CountryProfile). View full profile for detailed data.
bWorld Bank—Fertility Rate Overview per Country (http://data.worldbank.org).
cMuramatsu and Akiyama (2011).
dAbdulrahim et al. (2015).
eDíaz-Venegas, Sáenz, and Wong (2016).
fHartmann and English (2009).
The four nations studied have unique population aging trends; yet also share several similarities with regard to demographic transitions. Japan has been referred to as a “super-aging society,” boasting a proportion of people aged 65 years and older that is highest in the world (Muramatsu & Akiyama, 2011). Lebanon has the highest percentage of older adults in the Arab region (United Nations, 2010). Mexico currently has lower population aging, yet increased population aging is imminent, as projections suggest older adults will represent 16% of Mexico’s population by 2040 (Aguila, Diaz, Manqing, Kapteyn, & Pierson, 2014). Mexico is also unique because of a “highly compressed aging process” where premature aging (i.e., morbidity and poor functional health at earlier ages) is prevalent (Palloni, Pinto-Aguirre, & Peláez, 2002). In the United States, the older segment of the U.S. population increased at a faster rate (15.1%) than the total U.S. population (9.7%) between 2000 and 2010 (Werner, 2011). All countries under study are aging, though population aging is most pronounced in Japan. Moreover, life expectancies are relatively high in each country, and fertility rates overall rather low; however, Japan (1.4) and Lebanon (1.7) report fertility rates that are lower than Mexico (2.2) and the United States (1.9). Moreover, generational shifts in fertility are evident. In particular, fertility declines between 1960 and 2014 were quite striking in Mexico (−4.6) and Lebanon (−4.0) but less pronounced in the United States (−1.8) and Japan (−0.6).
Overall, increased population aging has important implications for social network characteristics. Greater proportions of older adults in a population with lower fertility rates may lead to smaller networks comprised of fewer children. On the other hand, these same demographic transition patterns may lead to no age differences in other network characteristics such as proximity and contact frequency because people are likely to find ways to maintain levels of proximity and contact frequency with which they are comfortable.
Finally, national policy, such as the availability of government-sponsored formal support, particularly income maintenance and long-term care, enables older people to be less dependent on informal support networks for daily necessities. Under such circumstances, the increasing needs for support in older-old age would not necessarily affect network size. People identified as close and important would not decrease given that the emotional basis of relationships are often enhanced between close others when instrumental needs are covered by formal sources (Ajrouch, Akiyama, & Antonucci, 2007). Yet, the availability of formal support may affect geographical proximity. For instance, availability of government support for older adults often yields financial independence, leading to a lower likelihood that older adults live with their children (Crimmins & Ingegneri, 1990). Hence, country-specific patterns concerning demographics and national policies are critical contextual factors to consider for understanding social networks in later life.
The convoy model assumes that network structure varies in predictable ways with age (Antonucci & Akiyama, 1987). For example, older adults likely experience more losses of network members than younger adults because more people in their network will die and not be replaced. They, therefore, are likely to report smaller networks. It follows then that children likely comprise a larger proportion of social networks with age. Because real or anticipated health challenges increase with age, older adults likely report greater geographical proximity and contact frequency with network members than younger adults. The manner in which age is associated with network characteristics within various national contexts has not yet been given systematic consideration in the literature. This may be due to the lack of data available across nations that would allow for a more in-depth examination of social network characteristics. A more thorough treatment of age differences in regionally representative samples in Japan, Lebanon, Mexico, and the United States will contribute to a deeper understanding of age and social networks in global perspective.
Feelings of Closeness
The country in which one resides naturally represents a key context for elucidating the characteristics of close relationships. Examining feelings of closeness provides a means by which to examine the complexity of interpersonal relationships (Antonucci & Akiyama, 1987). Cultural values in Asian, Arab, and Latino groups are often presented as more interdependent than the United States, though the similarities and differences between and among cultures are now recognized to be more complex (Kagitcibasi, 2005; Takahashi, Ohara, Antonucci, & Akiyama, 2002). An investigation of network characteristics (i.e., size, proximity, etc.) at each level of closeness offers key insights into the types of connections available or valued. In particular, the child relationship has been important for the care of older adults across time and place (Rossi & Rossi, 1990), though lower fertility rates and the development of formal support policies may lessen the presence and/or importance of children in the close social networks and care of older adults (Ryan, Smith, Antonucci, & Jackson, 2012).
Closeness patterns may differ because of national policies that make available widespread formal resources. Formal support such as income maintenance, health care, and long-term care provided by the state differ in each country, and as such, the role of social convoys and network closeness may vary by age in unique ways. In Japan, every person aged 65 and older is entitled to a variety of home, community-based, and institutional services, regardless of family availability and economic status (Muramatsu & Akiyama, 2011). Lebanon, on the other hand, offers few if any state supported services, requiring family to provide virtually all aspects of support for older adults (Abdulrahim, Ajrouch, & Antonucci, 2015). Recent policies in Mexico have increased access to health insurance among Mexican seniors (Díaz-Venegas, Sáenz, & Wong, 2016), though economic support and benefits are minimal. The United States provides baseline benefits to older adults with economic support distributed according to lifetime earnings. Health care is universal in old age, but long-term care options are available only through purchase in the United States (Hartmann & English, 2009). As such, older adults living in national contexts where formal support is provided by the state may report networks that are more variable in terms of age and closeness because the instrumental role of informal social networks may not be as central (see Ajrouch et al., 2007). Furthermore, though it appears adults under some circumstances in the United States choose to limit the number of close and important others as they age (Carstensen, 1995), it is not clear if this pattern holds in non-Western contexts (Fung, 2013).
Study Aims
In the present study, we identify age and closeness differences in the structure (size, contact frequency, geographic proximity) and composition (children) of social networks using regional samples of older men and women in Japan, Lebanon, Mexico, and the United States. We capitalize on identical measures collected during similar time periods. Given the tenets of the convoy model outlined above, the following hypotheses can be articulated:
H1. Older age will be associated with smaller, more frequent contact with network members who live closer and have a greater likelihood of being the respondent’s children.
H2. The closest relationships (i.e., those in the inner circle) will be the most numerous, with the most frequent contact, live closer, and have a greater likelihood of being the respondent’s children.
We also explore whether closeness patterns vary by age within each country to identify the extent to which feelings of closeness in the aging experience are similar across nations.
The null hypothesis would predict that older adults in four national contexts would exhibit similar convoy structures. Differences in situational or national characteristics, however, would suggest that national variations, for example, in geography, demography, policies, and programs, will yield important differences in the structure and composition of convoys of social relations.
Methods
Samples
Four regional data sets from Japan, Lebanon, Mexico, and the United States were used. All data sets included area-probability samples of metro-areas from a wide age range of participants and an oversampling of adults aged 60 years and older. For purposes of this study, only data from participants aged 50 and older were included. All data sets included identical questions regarding social networks.
Japan
Data are drawn from A Comparative Study of Social Relations: US and Japan (Akiyama, 2005). The regionally representative sample (N = 1,080) was collected from those aged 20 and older in the Greater Yokohama metropolitan area, with a 53% response rate. Participants completed a mixed method survey, self-administered and face-to-face interviews conducted in their homes in 2005. The sample for this study consisted of 577 adults, ranging in age from 50 to 92.
Lebanon
Data are drawn from the Family Ties and Aging Study (see Abdulrahim, Ajrouch, Jammal, & Antonucci, 2012). A random selection of households within the three administrative districts of Beirut in addition to the surrounding area was sampled. Data (N = 500) were collected from adults aged 18 years and older in 2009. The overall response rate was 64%. Participants completed face-to-face survey interviews conducted in their homes. The sample for this study consisted of 284 adults, ranging in age from 50 to 91.
Mexico
Data are drawn from the Study of Social Relations and Well-being in Mexico (see Fuller-Iglesias & Antonucci, 2016a). A representative sample of 1,206 adults (18–99 years of age) was selected from a mid-sized metropolitan area located an hour outside of Mexico City in 2009. The sample was stratified by age and gender in accordance with the most recent Mexican census data. Participants completed face-to-face survey interviews conducted in their homes. The survey response rate was 52.5 %. The sample for the present study was comprised of 556 adults aged 50 to 99.
United States
Data come from the second wave survey of the Social Relations Study (Antonucci, Birditt, & Webster, 2010). The first wave of this regionally representative sample (N = 1,703) was collected in 1992 from those aged 8–93 in the metropolitan Detroit area, with a 72% response rate. Wave 2, collected in 2005, consisted of 1,076 of the original respondents. Three hundred twenty had deceased and the remainder refused, were lost to follow-up, or were unable to participate resulting in a response rate of 78%. Participants completed telephone survey interviews in Wave 2. The sample for this study consisted of 543 adults in Wave 2, ranging in age from 50 to 100.
Measures
Convoy Characteristics
Network structure was obtained using the hierarchical mapping technique (Antonucci, 1986). Respondents were given a diagram with a set of three concentric circles and a smaller circle in the center with the word “you.” Respondents were then asked to think about “people to whom you feel so close that it is hard to imagine life without them.” These people were entered in the innermost circle of the network diagram. The same procedure was followed for the next circle, described as including “people to whom you may not feel quite that close but who are still very important to you,” and for the outer circle, described as including “people whom you have not already mentioned but who are close enough and important enough in your life that they should be placed in your personal network.”
Network size was a sum of the number of network members nominated by respondents across the three circles (inner, middle, and outer). Respondents could nominate up to 20 network members per circle. Network sizes ranged from 0 to 49 in Japan, 0 to 17 in Lebanon, 0 to 35 in Mexico, and 0 to 45 in the United States (range 0–45). Closeness was measured by the circle placement of each network member (inner = 3, middle = 2, and outer = 1).
Respondents were asked a series of questions concerning characteristics of the first 10 people (aged 18+) listed in their network. We focused on network members’ geographic proximity (live more than 1-hr drive from respondent = 0; within 1-hr drive = 1 for United States/Japan; live more than 30-min drive from respondent = 0; within 30-min drive = 1 for Lebanon/Mexico) and contact frequency (1 = irregularly to 5 = daily). Also collected were data indicating the relationship of the network member to the respondent; for this analysis, we focused on the child relationship (0 = not child, 1 = child).
Demographic Characteristics
Age was measured by subtracting date of birth from interview date and was used as a continuous variable. Age groups were created such that younger (50–69) and older (70+). Gender was coded as male (0) and female (1). Marital status was assessed as a dichotomous variable for married (1) and not married (0). Education was measured as the highest grade of school or year of college completed (0–17+). An overview of demographic characteristics by nation is presented in Table 2.
Demographic Characteristics of Samples
| Japan (N = 577) | Lebanon (N = 284) | Mexico (N = 556) | United States (N = 543) | |
|---|---|---|---|---|
| Age | ||||
| Range | 50–92 | 50–91 | 50–99 | 50–100 |
| Mean age (SD) | 64.4 (9.6) | 65.3 (10.0) | 67.3 (9.4) | 67.0 (11.8) |
| Younger (50–69) | ||||
| Mean age (N) | 59.4 (409) | 59.6 (190) | 61.3 (338) | 58.1 (306) |
| Older (70+) | ||||
| Mean age (N) | 76.8 (168) | 76.7 (94) | 76.5 (218) | 78.5 (237) |
| % Female | 51.5% (297) | 49.3% (140) | 50.7% (282) | 60.2% (327) |
| % Married | 79% (455) | 54.9% (156) | 60.7% (337) | 61.0% (331) |
| Years of education | ||||
| Range | 6–17 | 0–17 | 0–17 | 1–17 |
| Mean (SD) | 12.5 (2.7) | 7.2 (4.3) | 4.8 (4.8) | 13.3 (2.8) |
| Network size | ||||
| Range | 0–49 | 0–17 | 0–35 | 0–45 |
| Mean (SD) | 10.7 (7.7) | 5.8 (3.2) | 7.5 (5.1) | 11.3 (7.1) |
| Geographic proximity | ||||
| Range | 0–100 | 0–100 | 0–100 | 0–100 |
| Mean (SD) | 40.4 (33.3) | 62.5 (43.7) | 64.6 (40.4) | 70.6 (27.2) |
| Frequency of contact | ||||
| Range | 1–5 | 1.3–5 | 1–5 | 1.9–5 |
| Mean (SD) | 3.1 (0.8) | 4.3 (0.8) | 4.3 (0.7) | 3.9 (0.5) |
| No. of children | ||||
| Range | 0–6 | 0–10 | 0–10 | 0–9 |
| Mean (SD) | 1.9 (1.4) | 2.7 (2.1) | 3.7 (2.7) | 2.4 (1.8) |
Note: SD = standard deviation.
Data Analytic Strategy
Multilevel modeling was conducted separately within each nation using SAS Version 9.4 to examine respondent age and circle placement differences in social network characteristics of size, geographic proximity, contact frequency, and child relationship. Multilevel modeling allowed us to examine these characteristics at the network member level while accounting for the nonindependence of observations inherent in egocentric network data. Thus, the data were structured so that each row represented a network member. Network size and contact frequency were modeled as continuous outcomes using SAS Proc Mixed with maximum likelihood method and an unstructured covariance structure, whereas proximity and child relationship were modeled as binary outcomes using SAS Proc Glimmix with Laplace method and an unstructured covariance structure.
In these models, respondent age, gender, marital status, and education were included as level 2 (respondent) variables. Age and education were grand mean centered and gender and marital status were coded as dummy variables. Level 1 variables (network member) were the circle placement of each network member nominated and each social network characteristic. Circle placement was modeled as a continuous variable and group mean centered. To model network size, the only respondent level characteristic, a multilevel model was still conducted. However, in these models, the level 1 characteristic was size of each circle (inner, middle, outer) as opposed to a network member specific characteristic.
To examine age by circle placement interactions, we created a product term with the two centered variables. Significant interactions were determined by a significant p value as well as a significant improvement in model fit when compared with the main effect model. The difference between the −2 log likelihood of the main effect and interaction model was computed and identified on a chi-square distribution with 1 df (for the additional parameter in the interaction model). To explore the significant interactions, we utilized an online utility (http://www.quantpsy.org/) for probing significant interaction effects in multilevel modeling (Preacher, Curran, & Bauer, 2006). Age 70 was identified as the cutoff to distinguish the older age group from the younger based on the median sample age across all four countries, and to allow for consistency in presentation across the nations. Estimates from the significant interaction models were derived and entered into the utility and simple slopes for younger (50–69) and older (70+) age groups were derived. The simple slopes obtained from the online utility were then plotted with bar graphs given the cross-sectional nature of the data. Simple slopes that were significantly different from zero (p < .001) are identified in the figures with asterisks.
Results
Descriptives
Mean social networks characteristics are reported by nation in Table 2. On average, networks were largest in the United States (11.3) and Japan (10.7), followed by Mexico (7.5); Lebanon reported the smallest average network size (5.8). Approximately two thirds of networks in all countries lived within close geographic proximity, except Japan (40.4%). Mexico, Lebanon, and the United States all report, on average, weekly contact with network members. Japan, on the other hand, reported monthly average contact frequency. In all countries, respondents included more than one child on average in their networks: 2.4 in Japan, 2.7 in Lebanon, 3.7 in Mexico, and 1.9 in the United States.
Do Social Networks Vary by Age Within Each Nation?
Results are presented in Table 3.
Multilevel Models: Age and Closeness Predicting Network Size, Proximity, Contact Frequency, and Child Compositiona
| Japan | Lebanon | Mexico | United States | |
|---|---|---|---|---|
| b (SE) | b (SE) | b (SE) | b (SE) | |
| Network size | ||||
| Age | −0.02 (0.01) | 0.01 (0.01)* | −0.00 (0.01) | −0.05 (0.01)*** |
| Circle | −0.03 (0.07) | 1.93 (0.08)*** | 1.64 (0.07)*** | 0.75 (0.08)*** |
| −2 Log likelihood | 8,589.80 | 3,327.30 | 7,862.60 | 8,269.20 |
| Age × circle | 0.01 (0.01) | 0.02 (0.01)** | 0.01 (0.01) | 0.01 (0.01) |
| −2 Log likelihood | 8,588.70 | 3,318.00 | 7,859.30 | 8,265.90 |
| Δ −2 Log likelihood | 1.10 | 9.30*** | 3.30 | 3.30 |
| Proximity | ||||
| Age | 0.00 (0.01) | 0.00 (0.03) | −0.02 (0.01) | −0.01 (0.00)* |
| Circle | 3.17 (0.17)*** | −0.07 (0.20) | 0.85 (0.12)*** | 0.33 (0.06)*** |
| −2 Log Likelihood | 2,048.47 | 889.54 | 2,423.12 | 4,537.17 |
| Age × circle | −0.04 (0.01)** | −0.03 (0.02) | −0.00 (0.01) | −0.00 (0.00) |
| −2 Log likelihood | 2,041.32 | 887.70 | 2,423.10 | 4,536.87 |
| Δ −2 Log likelihood | 7.15** | 1.84 | 0.02 | 0.30 |
| Contact frequency | ||||
| Age | −0.00 (0.00) | −0.00 (0.00) | −0.00 (0.00) | −0.00 (0.00) |
| Circle | 0.94 (0.03)*** | 0.23 (0.05)*** | 0.66 (0.04)*** | 0.57 (0.02)*** |
| −2 Log likelihood | 12,475.00 | 3,860.40 | 9,432.00 | 10,338.20 |
| Age × circle | −0.00 (0.00) | −0.02 (0.00)*** | 0.00 (0.00) | −0.00 (0.00) |
| −2 Log likelihood | 12,474.80 | 3,846.60 | 9,431.90 | 10,335.90 |
| Δ −2 Log likelihood | 0.20 | 13.80*** | 0.10 | 2.30 |
| Child composition | ||||
| Age | 0.04 (0.01)*** | 0.04 (0.01)*** | 0.06 (0.01)*** | 0.03 (0.00)*** |
| Circle | 2.15 (0.09)*** | 1.74 (0.16)*** | 2.30 (0.13)*** | 1.87 (0.08)*** |
| −2 Log likelihood | 3,626.91 | 1,599.06 | 3,374.14 | 4,187.47 |
| Age × circle | −0.02 (0.01) | −0.02 (0.02) | −0.07 (0.01)*** | −0.01 (0.01) |
| −2 Log likelihood | 3,623.40 | 1,597.03 | 3,347.29 | 4,185.21 |
| Δ −2 Log likelihood | 3.51 | 2.03 | 26.85*** | 2.26 |
Note: SE = standard error.
aModels include controls for gender, marital status, and education.
*p < .05. **p < .01. ***p < .001.
Network Size
Social network size varied by age in two nations, but in opposite directions. In Lebanon, older age predicted larger network size. Our hypothesis was supported only in the United States where older age predicted smaller network size. No significant age differences in network size were evident in Japan or Mexico.
Geographic Proximity
Geographic proximity varied by age only in the United States. Within the United States, older age predicted less geographic proximity. No significant age differences in geographic proximity were evident in Japan, Lebanon, or Mexico. Thus, our hypothesis that age would be associated with greater proximity was not supported.
Contact Frequency
In contrast to our hypothesis that there would be more frequent contact among older people, no age differences in contact frequency were evident in any of the four nations.
Child(ren) in Network
Our hypothesis concerning child(ren) in network was supported in all four nations. Similar patterns emerged across nations in that older age was associated with having more children in their network.
Do Social Networks Vary by Closeness Within Each Nation?
Network Size
Our hypothesis that network size would vary by closeness was supported in three of the four nations. In Lebanon, Mexico, and the United States, convoy closeness was positively associated with network size such that the inner circle was the largest and outer convoy circle the smallest. In Japan, network size did not vary by circle closeness.
Geographic Proximity
Geographic proximity varied by closeness in Japan, Mexico, and the United States, but not in Lebanon, supporting our hypothesis in three of the four countries. In Japan, Mexico, and the United States, greater convoy closeness was associated with greater geographic proximity; the inner circle had the greatest proximity and the outer circle the least proximity. In Lebanon, geographic proximity did not significantly vary by circle closeness.
Contact Frequency
Contact frequency varied by convoy closeness within all four countries, supporting our hypothesis. Similar patterns emerged in that greater convoy closeness was associated with greater contact frequency in Japan, Lebanon, Mexico, and the United States. In each case, respondents reported greatest contact frequency with members of their inner circle.
Child(ren) in Network
Child(ren) in network varied by convoy closeness within all four countries. Similar patterns emerged in that convoy closeness was positively associated with having more children in their network. Children were more likely to be listed in the inner circle than the outer circle in all four countries, supporting our hypothesis.
Does Age Moderate Whether Social Networks Vary by Closeness Within Each Nation?
Network Size
Age moderated the association between feelings of closeness and network size in Lebanon. As demonstrated in Figure 1, the association between feelings of closeness and network size (i.e., slope) was significantly different between younger and older age groups. Each bar in the figure demonstrates the association of closeness and network size for each age group. Thus, Figure 1 indicates that though for both age groups the association between closeness and network size was significant, the slope was steeper for the older age group. Within the Lebanese sample, younger individuals were less likely, whereas older individuals were more likely, to have larger inner circles. There were no significant interactions of age and closeness predicting network size in Japan, Mexico, or the United States.
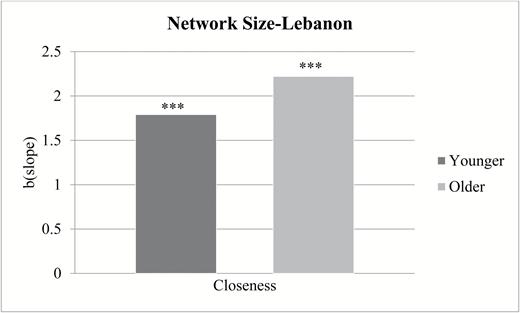
Association between closeness and network size by respondent age in Lebanon. ***p < .001.
Geographic Proximity
In Japan, age moderated the association between feelings of closeness and proximity. As displayed in Figure 2, the association between feelings of closeness and geographic proximity (i.e., slope) was significantly different between younger and older age groups. Once again, for both age groups the association between closeness and geographic proximity was significant, yet in this case the slope was steeper for the younger age group. Among younger Japanese, closeness was more strongly associated to proximity (i.e., geographically proximate inner circle); whereas, among older Japanese, closeness was less strongly associated to proximity. There were no significant interactions of age and closeness predicting geographic proximity in Lebanon, Mexico, or the United States.
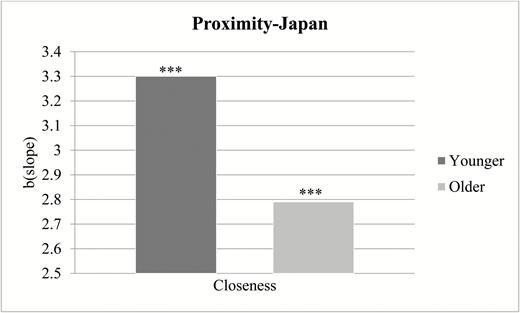
Association between closeness and proximity by respondent age in Japan. ***p < .001.
Contact Frequency
Age moderated the association between closeness and contact frequency in Lebanon. As demonstrated in Figure 3, closeness was positively associated with contact frequency (i.e., the inner circle was more likely to have greater frequency of contact) only among younger Lebanese. For older Lebanese, closeness was not associated with contact frequency. There were no significant interactions of age and closeness predicting network size in Japan, Mexico, or the United States.
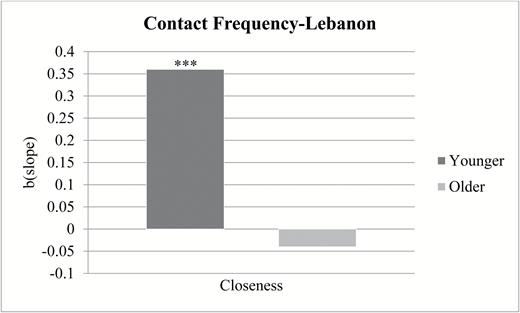
Association between closeness and contact frequency by respondent age in Lebanon. ***p < .001.
Child(ren) in Network
Age moderated the association between feelings of closeness and child(ren) in network in Mexico. As displayed in Figure 4, the association between feelings of closeness and child(ren) was significant for both age groups, but the slope was steeper for the younger age group. Among younger Mexicans, closeness was more strongly associated with child(ren) in network indicating that younger individuals are more likely to nominate children in their inner circle. Among older Mexicans, the likelihood of children being placed in the inner circle was weaker. There were no significant interactions of age and closeness predicting child(ren) in network in Japan, Lebanon, or the United States.
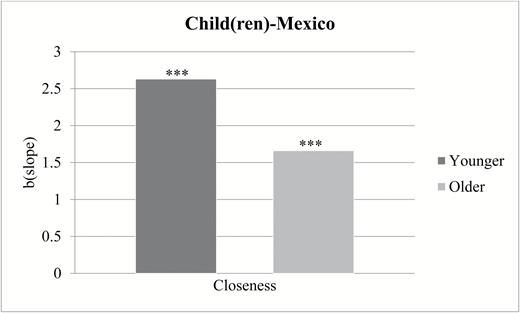
Association between closeness and nomination of child(ren) in network by respondent age in Mexico. ***p < .001.
Discussion
This study provides detailed analyses of social network characteristics in samples of adults 50 years of age and older in Japan, Lebanon, Mexico, and the United States. Findings indicate both universal and unique characteristics, highlighting context as a key situational aspect to better understand the structure of social relations. The convoy model posits that social network characteristics are influenced by age and vary in feelings of closeness (Antonucci et al., 2014; Kahn & Antonucci, 1980). The current findings upheld these tenets for the characteristics examined in some national contexts, but not in others. Moreover, findings demonstrated that particular characteristics of social networks are more strongly associated with age and closeness than others. We discuss these findings as a preliminary empirical basis for advancing a global perspective on social relations and their implications for theory and policy.
Network Size
Our expectation that older age would be associated with smaller social networks was confirmed only in the United States. This finding may be explained by the increasing likelihood of network members dying and not being replaced (Antonucci & Akiyama, 1987), yet this should not be unique to the United States. A socioemotional selectivity theoretical perspective would interpret this finding as evidence that older adults in the United States choose to limit the number of close and important others (Carstensen, 1995). Yet, the lack of an age effect in the other nations suggests theoretical implications for a global perspective on social relations. The idea that with age individuals purposively limit those to whom they are close is perhaps unique to the United States or Western industrialized context (Fung, 2013). This age effect, though well documented in the United States (Cornwell, Laumann, & Schumm, 2008; Lansford, Sherman, & Antonucci, 1998), does not arise in Japan or Mexico, suggesting continuity between midlife and later life with regard to the number of people identified as close and important. Indeed, the lack of age effects in Mexico is consistent with previous research that suggests that in midlife and beyond, socioeconomic status is a greater predictor of network size than age itself (Fuller-Iglesias & Antonucci, 2016a). In Lebanon, contrary to the pattern in the United States, increasing age is associated with larger social networks. Hence, links between age and network size are unique as they vary within national context.
The closest network circle was typically the largest in size, suggesting a pattern of identifying more close convoy partners than less close convoy partners. An exception was evident in Japan. The size of inner, middle, and outer circles did not vary, indicating that the closest circle is not larger, as was the case in the other nations. This finding may reflect specific social rules in Japan that direct how to treat others. In other words, a cultural norm where prescribed roles, that is, oldest son is designated/obligated to care for elders, dictate relationship closeness (Takahashi et al., 2002).
Finally, in Lebanon, feelings of closeness varied by age. Older individuals were more likely than younger individuals to have larger inner circles. This finding further challenges the theoretical premise that suggests older adults purposely choose to limit the number of close and important others (Fung, 2013). Indeed, because in Lebanon one depends on close connections with others, especially family, for well-being and access to resources due to a weak welfare state, the identification of close relationships may be a matter of life or death. This national pattern may be related to the lower general economic status in Lebanon because a similar pattern is found in the United States among the less affluent. Close relationships in such contexts may be driven more by instrumental goals as opposed to emotional goals (Ajrouch et al., 2007).
Geographic Proximity
Geographic proximity was differentially associated with age and closeness, also revealing unique patterns across contexts. In the United States only, older age predicted having a lower proportion of network members living nearby. This finding may indicate the economic context and size of the country, as well as the general mobility of the U.S. population. Those of working age often leave their geographic locales for career opportunities (Baughn, Neupert, & Sugheir, 2013; Flippen, 2013), whereas older people often move to more retirement-friendly geographical locations. For the other three nations, age was not associated with geographic proximity, indicating similarly proximal networks no matter the age.
In terms of closeness, the closest network members were the most proximal in all countries except Lebanon. This lack of association may reflect the tendency for Lebanese to remain in their geographic areas following the long Civil War (1975–1990), especially in neighborhoods of Beirut where self-sufficiency was key to survival (Nagel, 2002). The war legacy of segregated communities perhaps contributes to barriers in developing close relationships with people outside one’s community. It appears both the most and least intimate convoy members are likely to live close by in the Lebanon context. A possible related factor is that Lebanon is geographically the smallest country of the four, thus increasing the probability of everyone living within a close drive. A unique instance where closeness depended on age for geographic proximity emerged in Japan. Among younger Japanese, closeness was more strongly associated with geographic proximity (i.e., geographically proximate inner circle); whereas, among older Japanese, closeness was less strongly associated with proximity. This finding may reflect welfare state policies. In Japan, every person aged 65 and older is entitled to a variety of home, community-based, and institutional services, regardless of family availability and economic status (Muramatsu & Akiyama, 2011). This finding may reflect cohort differences in which younger Japanese are more mobile and use more technology to stay connected.
Contact Frequency
Contact frequency did not vary by age, suggesting universality that transcends both country and age. It may be that the spread of the Internet and enhanced communication technologies (e.g., cell phones, Skype) have led to a rise in networked individuals of all ages. Connections between individuals have shifted away from specific geographic locations to the individuals themselves regardless of where they physically connect (Wellman, 2001). This development may have a leveling effect, making age differences negligible. Future research should explore this issue further by specifically assessing the type of contact (i.e., face-to-face vs phone vs e-mail).
In all four countries, greater closeness (i.e., placement in the inner circle) was associated with more frequent contact, suggesting universal closeness patterns across nations. Yet, in the Lebanese context, the association between closeness and contact frequency was influenced by age. Among younger Lebanese, people reported greater frequency of contact with their inner circle network members; whereas, closeness was not associated with contact frequency for older Lebanese. The lack of variation in older age may signify Lebanese elders maintain contact with all network members in order to diversify potential sources of support, thus assuring that support is available when needed. The lack of universal social security for older adults makes this strategy a practical one for survival in late life (Abdulrahim et al., 2015).
Children
In all four countries, older age was associated with a higher proportion of children, signifying another universal trend. This pattern may reflect cohort effects as fertility rates have decreased globally (Lam, 2011), and therefore younger cohorts have fewer children than older cohorts. In addition, in all four nations, children were most likely to be nominated in the innermost circle. This finding may reflect that a universal characteristic of human bonding involves keeping children close (Rossi & Rossi, 1990), even in late life.
A unique finding emerged in Mexico; closeness depended on age for the network placement of children. Younger Mexicans were likely to nominate all of their children to their inner circle, whereas older Mexicans nominated children to inner, middle, and/or outer circles. This may indicate the generational shift wherein the oldest-old had more children on average (Díaz-Venegas et al., 2016), making it less likely that all children would be considered close. On the other hand, it may indicate a shift in perceptions once caregiving is needed. Prioritizing the needs of family (familism), including aging parents, is a strong cultural value with links to social convoys (Fuller-Iglesias & Antonucci, 2016b; Gomes, 2007). Children who take primary responsibility for parental care may be considered closer than those who do not.
Conclusion: Theory and Policy Implications
The overall assessment of convoys in these four nations suggests that size and geographic proximity are dimensions of social networks sensitive to national context situations. Yet, the ways in which age and feelings of closeness vary with contact frequency and the presence of children in networks reveal universal patterns. Findings support the tenets of the convoy model by illustrating how situation, that is, national context, shapes social network characteristics. That is, though the influence of age and closeness are similar for some convoy dimensions, the unique patterns that arise within nations yield insights into the ways in which situational characteristics are significantly important for understanding the structure of social relations.
The convoy model provides a guiding theoretical framework for the study of social relations, yet findings lead to the need for creating policies that fit a specific national context. Although it could be said that older people in all four countries identified people who were close and important to them, to some extent age and closeness varied across countries. These findings signify a need for flexibility with respect to how policy is developed and implemented given the unique situational contexts of nations.
Across nations, age differentially affected social networks, though one must consider that the differences in networks identified may in fact result from the presence, or lack of, policies already in place. One-size-fits-all is clearly not an appropriate approach given the unique patterns across nations, as well as their specific sociohistorical and economic situations. Yet, lessons can be learned and shared about those factors most critical to developing effective policy. In some ways, there are universal patterns to be recognized and built upon, such as children being identified as universally close and thus a frequent source of informal but critical support in old age. Moreover, attention should be given to the ways in which older adults maintain contact with network members, as ensuring the maintenance of frequent contact in later life offers opportunities for ensuring well-being. Policy makers should, for example, seek to maximize the strengths inherent to each context, facilitating what individuals and families attempt to achieve as a means to offset their vulnerabilities. At the same time, those charged with policy making would benefit from considering impending demographic changes such as reduced fertility rates in each country. Thus, future policies in Lebanon and Mexico, both of which lack comprehensive government support for those in later life, should recognize the needs of older people that will no longer be met by their children, and consider ways to encourage behaviors and create policies that will offset the drastic decline in fertility. Furthermore, the rapid rate of aging in the United States should inform policy formation addressing long-term care needs, particularly given that network size and geographic proximity seem to diminish with age in the United States. Not recognizing and planning for these changes risk creating a vulnerable class of elders.
Finally, it is important to acknowledge that the present paper examined age and closeness patterns among specific cohorts. As each country is experiencing unique cohort changes, the detected associations may be related to specific government policies. For example, caregiving expectations have changed radically in Japan where the wife of the oldest son was previously designated as the primary caregiver for her parents-in-law while current elders enjoy extensive state-sponsored care benefits such as in-home health aides and long-term care and expect much less of their daughters-in-law. Similar changes in structure and size of convoys might be evident in Mexico and Lebanon among future cohorts should universal health benefits become available in these countries, and additional benefits such as long-term care benefits become available in the United States.
Future studies would benefit from an examination of change over time to better document aging experiences related to social relations. Furthermore, directly and explicitly examining cultural factors associated with social relations and the implications for well-being and health would strengthen a global perspective. Caution should be exercised in interpreting findings across nations. Every effort was made to create questions of identical meaning, yet potential effects due to subtle language differences, as well as cultural perceptions of questions and response categories may have influenced responses. Although the basic tenets of the convoy model cannot be assessed fully with cross-sectional, age-truncated data, the present data do, nevertheless, provide some insights. In sum, identifying universal and unique characteristics of social networks in later life provides a preliminary empirical basis upon which to advance a global perspective on convoys of social relations and how they inform policies that can facilitate health and well-being among middle-aged and older people around the world.
Funding
This research was supported by grants from the Japan Society for the Promotion of Science, Doha International Family Institute, Lebanese National Council for Scientific Research, Institute of International Education’s Fulbright Program, and the National Institutes for Health (5 R01 AG045423 03).
Acknowledgments
We thank Angela Turkelson for her help in conducting analyses. The authors of this research are fully responsible for its content, which does not necessarily reflect views of the funding source.

