


Abstract
Purpose: This study determined whether the NYU Caregiver Intervention, adapted in Minnesota for adult child caregivers (NYUCI-AC), prevented or delayed residential care placement for persons with dementia. Design and Methods: A single-blinded randomized controlled trial design was used. One hundred and seven adult child caregivers of persons with dementia were randomly assigned to the NYUCI-AC treatment group who received individual and family counseling, support group referral, and ad hoc consultation or a contact control group. Participants were asked to complete structured assessments quarterly during Year 1 and every 6 months thereafter for a minimum of 2 years. Results: Two thirds (66%) of adult child caregivers in the control condition admitted their parent to a residential care setting compared with 37% in the treatment condition. Logistic regression and Cox proportional hazards models found that NYUCI-AC participants were significantly less likely (p < .05) to admit their parents to a residential care setting and delayed their parents’ time to admission significantly longer (228.36 days longer on average) than those in the control group. Implications: The multicomponent NYUCI-AC offered adult children the psychosocial support required to continue providing care to cognitively impaired parents at home.
The New York University (NYU) Caregiver Intervention (NYUCI) is designed to enhance social support to facilitate caregiver well-being. In a series of evaluations, Mittelman and colleagues found that NYUCI counseling and support enabled spouse caregivers to postpone nursing home admission for persons with Alzheimer’s disease (AD; Mittelman et al., 1993; Mittelman, Ferris, Shulman, Steinberg, & Levin, 1996; Mittelman, Haley, Clay, & Roth, 2006). The results of the NYUCI have amply demonstrated the potential benefits of a multifaceted approach in spousal care contexts. We conducted this single-blinded, randomized controlled evalua tion to determine whether the NYUCI could also prevent or delay residential care placement for persons with AD or a related dementia (ADRD) who were cared for by their adult children. This would broaden the NYUCI’s potential impact, especially in communities where spouses are less likely to be caregivers than adult children (as is the case in some of the sites participating in NYUCI demonstration projects across the United States; Rosalynn Carter Institute for Caregiving, 2012).
AD Caregiver Interventions
A number of studies have demonstrated the adverse effects of dementia care on family members, including impaired physical health and immune system response, financial strain, degradation in social well-being, and increased symptoms of depression and anxiety (Liu & Gallagher-Thompson, 2009). As evidence accumulated on the ramifications of dementia family care, a series of intervention strategies were developed and evaluated. The premise of these approaches was that certain aspects of dementia caregiving (e.g., implementing caregiver strategies to manage dementia-related symptoms; bolstering resources through enhanced social support; Zarit, 2009) are modifiable and can improve key outcomes such as emotional stress and depressive symptoms on the part of the caregiver. Meta-analyses and systematic reviews of ADRD caregiver interventions have found that multicomponent intervention protocols that include combinations of individual- and group-based counseling (e.g., the NYUCI; Resources for Enhancing Alzheimer’s Caregiver Health) are potentially more effective than those with single modalities, although most interventions have not targeted care recipient institutionalization (Brodaty, Green, & Koschera, 2003; Sörensen, Pinquart, Habil, & Duberstein, 2002; Zarit, 2009).
Adult Child Caregivers of Persons With ADRD
Daughters, wives, and husbands make up the three largest groups of family caregivers (Wolff & Kasper, 2006). Prior descriptive research has shown that there are differences between spouses and adult children in care provision and well-being. For example, spouses of persons with ADRD tend to provide more comprehensive and extensive care than adult children because they are more likely to live in the same household as the care recipient and be more emotionally invested and morally obligated to provide care for the impaired wife/husband (Aneshensel, Pearlin, Mullan, Zarit, & Whitlatch, 1995; Montgomery & Williams, 2001). However, longitudinal studies of dementia caregiving have concluded that adult children who are primary caregivers of their parents are more likely to be adversely affected by caregiving when multiple life-course responsibilities are superimposed on dementia care (Aneshensel et al., 1995; Li, Seltzer, & Greenberg, 1997).
A systematic review of 40 ADRD caregiver interventions found that most either included both spousal and adult child caregivers or focused solely on spousal caregivers (Cooke, McNally, Mulligan, Harrison, & Newman, 2001). Those that included both groups generally did not report results for spouses and adult children separately. One meta-analysis of interventions that compared adult children and spouses found that adult children were more likely than spouses to show slight improvements in burden, depression, well-being, and ability/knowledge in response to treatment (Sörensen et al., 2002). In contrast, Gitlin and colleagues (in a randomized controlled evaluation of a home-based educational and environmental modification intervention) reported that spousal caregivers reported decreases in feelings of upset for a 6-month period but adult children did not, which may be explained by the higher levels of upset and depression experienced by spouse caregivers at the time of enrollment (Gitlin, Corcoran, Winter, Boyce, & Hauck, 2001; Gitlin et al., 2003). A quasi-experimental/nonrandomized evaluation of a multicomponent intervention in southern Sweden that included 5 weekly counseling sessions and a 3-month “conversation group” (N = 308) for dementia caregivers of various kin relations found that adult children in the treatment group (n = 91) significantly delayed nursing home placement for 6 months compared with adult children in the control group (n = 101; Andrén & Elmståhl, 2008).
Residential Long-term Care and ADRD
Persons with ADRD utilize nursing homes much more frequently than those without ADRD; among every 1,000 Medicare beneficiaries with ADRD in 2008 there were 349 skilled nursing facility stays compared with 39 stays for every 1,000 Medicare beneficiaries without ADRD (Alzheimer’s Association, 2012). Delaying or preventing nursing home admission can potentially reduce emotional costs to family members as well as financial costs to Medicare and Medicaid (both of which reimburse such care for individuals with ADRD). Concerns regarding prevention or delay of nursing home admission extend to other residential care settings. Due to the high out-of-pocket costs of assisted living services (estimated at $41,724 per year; Alzheimer’s Association, 2012), residents often spend down their assets and ultimately require Medicaid assistance (Mollica, 2009). The number of residents in assisted living facilities covered by Medicaid has also increased more than 100% since 2002 (Mollica, 2009). Thus, delaying admission to assisted living settings and nursing homes may postpone when the care of persons with dementia becomes a public responsibility by reducing the costs of care borne by Medicaid.
Research Focus
The original NYUCI targeted spouse/partner caregivers of people with dementia. Although the experiences of adult child caregivers are different in many ways from those of spouses (as mentioned earlier), we believed that the NYUCI’s individualized and multifaceted approach to enhancing social support would offer similar benefits to adult child caregivers and the parents for whom they provide care. Should this be demonstrated, the NYUCI could be offered as an evidence-based intervention not only to spousal caregivers but also to adult child caregivers as well (Rosalynn Carter Institute for Caregiving, 2012). Therefore, this study tested the hypothesis that a comprehensive, multicomponent protocol based on the NYUCI and adapted for adult child caregivers (NYUCI-AC) would prevent or delay residential care placement (i.e., 24-hr residential care such as nursing homes or assisted living) for parents with ADRD compared with parents of adult children not receiving the NYUCI-AC.
Methods
Procedure
This prospective, single-blind, randomized controlled study included 107 adult children of persons with a physician diagnosis of ADRD in the seven-county Minneapolis/St. Paul urban and suburban area as well as outlying regions (IRB# 0508S72389). To be eligible, adult child caregivers had to self-identify as a primary caregiver and visit the care recipient at least once a week. The person with ADRD had to be living at home in the community at the time of the baseline interview. Eligible adult child caregivers could not have received professional counseling for problems arising from being a caregiver in the year prior to enrollment. A list of random group assignment (using http://randomizer.org) was generated at the start of the study. Following screening for eligibility and signing an informed consent to participate, the participating adult child caregiver was assigned to the NYUCI-AC treatment condition (n = 54) or the contact control group (n = 53) based solely on their a priori randomization assignment number. This prevented counselors’ assignment of participants based on need or other considerations. Participants in the control group were provided with a biannual project newsletter and quarterly “check-in” calls by the counselors. If an immediate or a critical need was raised, counselors could provide ad hoc consultation to caregivers in the control group.
Participant recruitment was initiated in January 2006 and adult child caregivers were enrolled from January 2006 to August 2009. As this study was not affiliated with a memory clinic, study recruitment was primarily community based. Participants were initially identified and enrolled from a variety of sources including flyers posted on the Minnesota–North Dakota Alzheimer’s Association’s Regional Office web page and newsletters, ads in local community newspapers, outreach efforts and mailed flyers to local community-based organizations, and community presentations throughout the Minneapolis/St. Paul region. These approaches had moderate success in identifying eligible adult child caregivers from 2006 to 2008. Beginning in May 2008, we held a biannual community education conference held at the University of Minnesota for families and professionals; conference attendance increased from 80 at the first conference to more than 250 participants in June 2009. The community education conference yielded the most success in identifying adult child caregivers and allowed the research team to exceed the initial recruitment target of 100 adult child caregivers.
The study protocol included baseline and follow-up assessments administered by a rater blinded to assignment. The goal of the protocol was to complete follow-up assessments on a quarterly basis during the first 12 months of participation and every 6 months thereafter for a minimum of 2 years. Follow-up assessments were administered in person, or if that was not possible, via a telephone interview or mail. Participation in the evaluation continued until the study ended, the caregiver died, the caregiver refused to participate, or 2 years after the death of the parent with dementia. The maximum time of participation was 3.79 years after enrollment (participants who completed mail surveys sometimes returned them later than the scheduled follow-up interval, accounting for the 3.79 year maximum time to follow-up).
Sample
Figure 1 presents the enrollment process for adult child caregivers in the NYUCI-AC. Almost all participants (94%) were female, Caucasian, and had at least a high school education (Table 1). Adult child caregivers were approximately 51 years old on average. Parents with ADRD were close to 5 on the Global Deterioration Scale at baseline, which is considered moderately severe cognitive decline (Reisberg, Ferris, de Leon, & Crook, 1982). All caregivers were employed at baseline and reported moderate to high levels of stress and depressive symptoms (Table 1). On average, adult child caregivers utilized one community-based/psychosocial service at enrollment (M = 0.96; SD = 1.19). Close to half of all caregivers did not utilize any service at baseline (N = 51; 47.7%). Twenty-six participants reported the use of one service (24.3%), the most common of which was a home attendant (n = 7), a support group (n = 6), or a housekeeper (n = 4).
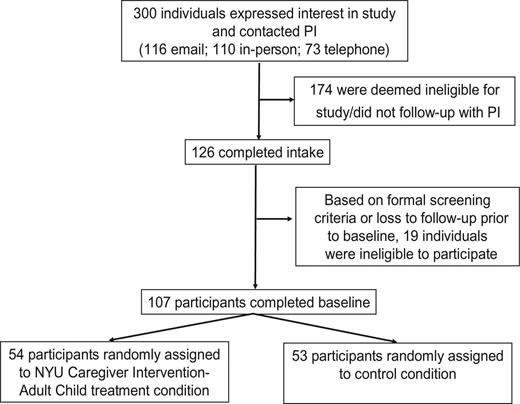
Participant recruitment process, New York University (NYU) Caregiver Intervention-Adult Child (NYUCI-AC).
Baseline Descriptive Information and Bivariate Comparisons, New York University (NYU) Caregiver Intervention-Adult Child (NYUCI-AC) Treatment and Control Groups (N = 107)
| Variables | Total (N = 107) | Control (n = 53) | Treatment (n = 54) |
|---|---|---|---|
| Context of care | |||
| Caregiver age (in years) | M = 50.46 SD = 8.24 | M = 49.68 SD = 9.36 | M = 51.23 SD = 6.95 |
| Caregiver is female* (%) | 94.3 | 100 | 88.7 |
| Caregiver is Caucasian (%) | 94.4 | 94.3 | 94.4 |
| Caregiver household annual incomea | M = 6.95 SD = 1.33 | M = 6.90 SD = 1.30 | M = 7.00 SD = 1.36 |
| Caregiver completed high school or more (%) | 100 | 100 | 100 |
| Caregiver is employed (%) | 100 | 100 | 100 |
| Caregiver is married (%) | 71.0 | 69.8 | 72.2 |
| Caregiver number of children | M = 1.68 SD = 1.57 | M = 1.90 SD = 1.77 | M = 1.46 SD = 1.33 |
| Care recipient number of children | M = 3.57 SD = 1.93 | M = 3.54 SD = 1.92 | M = 3.59 SD = 1.97 |
| Care recipient lives alone (%) | 17.0 | 13.5 | 20.4 |
| Care recipient is on Medicaid (%) | 25.5 | 26.9 | 24.1 |
| Dementia severity | |||
| Global Deterioration Scale score | M = 4.89 SD = 0.90 | M = 4.97 SD = 0.87 | M = 4.80 SD = 0.92 |
| Revised Memory Problem Checklist—Frequency subscale | M = 38.64 SD = 12.00 | M = 38.38 SD = 12.01 | M = 38.89 SD = 12.09 |
| Caregiver stress | |||
| Perceived Stress Scale | M = 14.82 SD = 6.73 | M = 14.57 SD = 6.68 | M = 15.07 SD = 6.84 |
| Role overload | M = 7.39 SD = 2.06 | M = 7.52 SD = 2.04 | M = 7.26 SD = 2.09 |
| Role captivity | M = 7.60 SD = 2.39 | M = 7.35 SD = 2.50 | M = 7.85 SD = 2.28 |
| Revised Memory Problem Checklist—Reaction subscale | M = 26.17 SD = 14.17 | M = 25.07 SD = 14.00 | M = 27.25 SD = 14.38 |
| Caregiver symptoms of depression | |||
| Mood Assessment Scale | M = 4.48 SD = 4.53 | M = 4.17 SD = 4.19 | M = 4.79 SD = 4.86 |
| Caregiver health | |||
| Caregiver subjective health* | M = 1.90 SD = 0.59 | M = 2.02 SD = 0.64 | M = 1.78 SD = 0.50 |
| Support resources | |||
| Stokes Social Network: number of close friends* | M = 3.96 SD = 3.17 | M = 4.65 SD = 3.59 | M = 3.28 SD = 2.54 |
| Stokes Social Network: number of close relatives | M = 4.11 SD = 3.29 | M = 4.25 SD = 3.11 | M = 3.98 SD = 3.48 |
| Overall satisfaction with social network**,b | M = 2.54 SD = 1.47 | M = 2.12 SD = 1.27 | M = 2.94 SD = 1.55 |
| Satisfaction with emotional supportb | M = 2.39 SD = 1.44 | M = 2.14 SD = 1.39 | M = 2.63 SD = 2.39 |
| Satisfaction with assistanceb | M = 3.40 SD = 1.60 | M = 3.22 SD = 1.50 | M = 3.57 SD = 1.69 |
| Number of community-based and psychosocial services used | M = 0.96 SD = 1.19 | M = 1.09 SD = 1.26 | M = 0.83 SD = 1.11 |
Notes. M = mean; SD = standard deviation.
a1 = none, 2 = under $5,000, 3 = $5,000–$9,999, 4 = $10,000–$14,999, 5 = $15,000–$24,999, 6 = $25,000–$49,999, 7 = $50,000–$74,999, and 8 = $75,000 or more.
b1 = very satisfied, 2 = moderately satisfied, 3 = slightly satisfied, 4 = slightly dissatisfied, 5 = moderately dissatisfied, and 6 = very dissatisfied.
*p < .05. **p < .01. ***p < .001.
Intervention
As in the original NYUCI protocol, the NYUCI-AC consisted of three components: individual and family counseling, support group participation, and ad hoc counseling. During the initial 4-month intervention period, adult child caregivers were asked to participate in six individual and family sessions with a trained study counselor. The original NYUCI began with one individual session followed by four family sessions and then a final individual session. Due to resistance of adult children to include other family members in counseling sessions, the protocol for the number and order of individual and family sessions was modified to include two sessions with the adult child caregiver only followed by three with the adult child caregiver and one or more family members and concluding with another session with the caregiver alone. Following these initial changes to the study/intervention protocol, no major changes to the intervention structure (due to environmental factors or internal decisions) occurred during the remainder of the project. As in the original NYUCI, the clinical content of the counseling sessions was individualized to meet the needs of each caregiver by providing education and psychosocial support. The caregivers were encouraged to avail themselves of social support from family and friends in counseling sessions. In addition, support was enhanced through improving interactions among family members and enhancing the understanding of each other’s needs.
After the first follow-up assessment, caregivers were referred to support groups provided by the local Area Agencies on Aging, the Minnesota–North Dakota Alzheimer’s Association regional office, or to an adult child–specific support group moderated by the NYUCI-AC counselors. Ad hoc counseling was available in person, over the phone, or via e-mail to provide ongoing guidance and support and to address crises, concerns, or information needs. The two NYUCI-AC counselors were master’s-level psychotherapists.
Measures
The assessment battery was derived from the original evaluation of the NYUCI and included the same domains. For the analyses reported here, we included domains from the battery that have shown relevance in predicting nursing home admission or residential care placement for persons with dementia (Gaugler, Yu, Krichbaum, & Wyman, 2009).
Institutionalization and Death Dates.—
Whether and when residential care placement or care recipient death occurred was reported by adult child caregivers during each follow-up assessment. Prior large-scale ADRD caregiver intervention studies found that efforts to establish data quality and corroborate caregiver reports with other reporting methods (i.e., claims data) indicate that such methods are reliable (Miller, Newcomer, & Fox, 1999).
Context of Care.—
Each assessment battery collected detailed background and sociodemographic information about the caregiver and care recipient (Table 1).
Dementia Severity.—
The global severity of dementia of the person with ADRD was determined by the Global Deterioration Scale (GDS; Reisberg et al., 1982), a semistructured rating of global functional status. The frequency of patient behavior problems was measured at intake and at follow-up assessments with the Revised Memory and Behavior Problems Checklist (R-MBPC; α = 0.80; Teri et al., 1992), which consists of a list of 24 common problems manifested by persons with dementia.
Caregiver Stress.—
Four indices of subjective stress were utilized. A 4-item scale assessed the involuntary aspects of the caregiving role (i.e., role captivity, α = 0.81). A 3-item scale measured caregivers’ feelings of emotional and physical fatigue (i.e., role overload; α = 0.79; Pearlin et al., 1990). The Perceived Stress Scale (α = 0.89; Cohen, Kamarck, & Mermelstein, 1983), a 14-item structured Likert scale designed to be sensitive to chronic stress, was also used. Adult child caregivers’ stress appraisals of behavior problems were measured with the reaction subscale of the R-MPBC (α = 0.87).
Caregiver Symptoms of Depression.—
The 30-item Geriatric Depression Scale, also known as the Mood Assessment Scale (α = 0.97; Yesavage et al., 1983), was used to assess the presence of depressive symptoms among adult child caregivers.
Caregiver Health.—
A single-item subjective rating of caregiver’s physical health was used (1 = excellent, 2 = good, 3 = fair, and 4 = poor).
Support Resources.—
The Stokes Social Network List (α = 0.92; Stokes, 1983) measured the size and composition (i.e., number of close friends/relatives) of the adult child caregiver’s social network. Three separate items were also included to determine how satisfied the adult child caregiver was with her/his overall social network, the emotional support provided by her/his social network, and the assistance offered by her/his social network (1 = very satisfied to 6 = very dissatisfied). Service utilization was assessed by asking adult child caregivers to identify the number of community-based and psychosocial services they were currently using (e.g., adult day services, in-home health, personal care, support groups, and other psychosocial services).
Analysis
Bivariate comparisons (chi squares, paired t tests) were conducted to determine whether baseline covariates and residential care placement outcomes varied significantly (p < .05) across the treatment and control conditions (Table 1). Any covariates that significantly differed across the NYUCI-AC treatment or control conditions were included in all subsequent analytic models. To fully test the study hypothesis, several analytic strategies were employed. First, a logistic regression model was utilized that included any residential care placement as the outcome of interest; treatment group assignment was the independent variable. To further examine the effects of the NYUCI-AC on specific types of residential care placement, a multinomial logistic regression model was conducted with treatment assignment as the independent variable and the following outcomes as the categorical-dependent variable: nursing home admission, other residential care placement, or community residing at the time of the final assessment. Finally, a Cox proportional hazard survival analysis was conducted to determine whether participation in the NYUCI-AC was associated with delays in time to residential care placement. The Cox proportional hazard survival model permits an event history analysis in which the dependent variable is a combination of time and whether the event (time to residential care placement) occurs or not.
Participants whose relatives were not placed in a residential care setting during their participation in the study were considered “censored” observations in these analyses. These included adult child caregivers and their care recipients whose parents were still living at home during their final interview (n = 33), care recipients who died without placement (n = 19), and who were lost to follow-up (one participant in the control group refused to participate in the study 28 days following the baseline assessment and did not complete any follow-up assessment, as described later). By incorporating both a binary outcome analyses (e.g., whether placement occurred or not via logistic regression) and a time to residential placement outcome (via the Cox proportional hazards model that accounts for the varying participation times in the study panel), we were able to examine the effects of the NYUCI-AC treatment approach not only on placement occurrence but also on time to placement. Analyses were conducted with PASW Statistics 18.0.1 and thus included all 107 participants.
Results
Process Data
Process data suggested that adult children tended to take much longer to complete six individual or family counseling sessions compared with participants in the original NYUCI (M = 11.10 months; SD = 8.95). This was due in part to work or other competing demands as well as a desire to prolong the time between sessions until a change occurred in the cognitively impaired parent (e.g., increasingly severe dementia) that demanded a new plan or coping skills. A typical individual protocol session was 99.4min (SD = 27.2; range = 30–150min). Twenty-five participants (46.3%) did not utilize family sessions but instead chose to solely use individual sessions. The average duration of a family protocol session was 107.5min (SD = 32.1; range = 30–200min). The longer length (200min) for one family session was due to the participation of seven family members. The 54 adult child caregivers in the NYUCI-AC completed an average of 5.19 (SD = 1.54) individual or family counseling sessions (M = 3.96, SD = 1.86 individual sessions; M = 1.22, SD = 1.56 family sessions). There were an additional 145 ad hoc sessions completed (M = 2.65 ad hoc sessions, SD = 3.22; M = 59.21min each, SD = 36.25). Adult child caregivers in the NYUCI-AC completed a mean total of 7.83 (SD = 4.04) individual/family and ad hoc counseling sessions throughout their participation in the project. Nineteen participants (35.2%) utilized the counselor-provided support groups, an average of 7.44 times each (SD = 9.80). In addition to the in-person and telephone-based communication provided in the NYUCI-AC, there was extensive e-mail communication in which counseling took place. Of the 1,678 e-mails exchanged between study counselors and adult child caregivers (M = 31.07; SD = 24.17), approximately 25% involved counseling-related issues (the remainder dealt with administrative issues, such as scheduling and reminders).
A small number of adult child caregivers in the NYUCI-AC control group did seek out services on their own following the baseline interview and random assignment. One adult child caregiver in the control group reported the use of individual and family counseling at the 4-month follow-up interview. Eight adult child caregivers in the control group (15.1%) indicated that they were currently participating in a support group at the 4-month assessment. Seven of the 53 adult child caregivers in the control group utilized ad hoc counseling (M = 0.19 ad hoc sessions for the entire control group; SD = 0.53); these seven control caregivers utilized an average of 1.43 ad hoc sessions (SD = 0.54).
Bivariate Comparisons: Covariates and Residential Care Placement Outcomes
As shown in Table 1, the random assignment resulted in no statistically significant baseline differences between treatment and control groups for most variables. Four variables were found to significantly differ (p < .05): caregiver gender, subjective health, number of close friends, and overall satisfaction with social network. These variables were included as covariates in subsequent analytic models.
Average days of study participation prior to residential care placement, care recipient death, loss to follow-up, or study conclusion was 644.37 days (SD = 371.04; range = 28–1,384 days, from intake to final assessment). During the course of the study, 55 (51.4%) persons with ADRD entered a residential care setting (a setting that provided 24-hr care, including assisted living, a family care home/adult foster home, or a nursing home) and 38 care recipients (35.5%) died (Table 2). Of those that died, 19 (17.8%) did so prior to residential care placement. All but one participant completed at least one follow-up assessment and/or a dispositional status form indicating the living arrangement of the parent with ADRD. Twenty (37.0%) of those in the treatment condition admitted their parent into a residential care setting compared with 35 (66.0%) in the usual care control condition (df = 1, χ2 = 9.01, p < .01). Further examination by specific type of placement found that a significantly smaller proportion of care recipients in the treatment group were admitted to an assisted living or similar residential setting than in the control condition (n = 9, 16.7% vs. n = 21, 39.6%; df = 1, χ2 = 6.99, p < .01). Although fewer participants in the treatment condition placed parents in a nursing home than those in the control group, this difference did not achieve statistical significance (n = 11, 20.4% vs. n = 14, 26.4%; df = 1, χ2 = 0.55, p = .31).
Residential Care Placement Outcomes and Bivariate Comparisons, New York University (NYU) Caregiver Intervention-Adult Child (NYUCI-AC) Treatment and Control Groups (N = 107).
| Variables | Total (N = 107) | Control (n = 53) | Treatment (n = 54) |
|---|---|---|---|
| Care recipient died (%) | 35.5 | 30.2 | 40.7 |
| Care recipient entered residential carea | |||
| Any residential care setting** (%) | 51.4 | 66.0 | 37.0 |
| Residential care (assisted living/family care home)* (%) | 28.0 | 39.6 | 16.7 |
| Nursing home (%) | 23.4 | 26.4 | 20.4 |
Note. aPrior to unblinding, decisions were made to code three cases as residential care placement: (1) one participant, several months following her final interview, reported her parent was in assisted living; (2) one participant confirmed an impending nursing home admission prior to her final follow-up interview but did not complete the final interview; and (3) one participant reported using a nursing home for her parent between 6-month follow-up interviews but then arranged to have her parent return to the community.
*p < .05. **p < .01. ***p < .001.
Logistic Regression: Effects of the NYUCI-AC on Overall Residential Care Placement
Table 3 presents the results of the logistic regression model examining the effects of NYUCI-AC on the likelihood of overall residential care placement. Even after controlling for baseline variations across the treatment and control groups, adult child caregivers who received the NYUCI-AC were considerably less likely to admit their parents to a residential care setting than those in the control group (B = −1.16, SE = 0.46, Wald = 6.53, Exp (B) = 0.31, 95% CI = 0.13–0.76). Specifically, adult child caregivers receiving the intervention were 0.31 times less likely to admit a relative to a 24-hr residential care setting.
Logistic Regression Results: Effects of the New York University (NYU) Caregiver Intervention-Adult Child (NYUCI-AC) on Care Recipient Residential Care Placement
| Variables | B | SE | Wald | OR | 95% CI |
|---|---|---|---|---|---|
| Caregiver is female | −0.25 | 1.01 | 0.06 | 0.78 | 0.11–5.60 |
| Caregiver subjective health | 0.38 | 0.40 | 0.92 | 1.47 | 0.67–3.20 |
| Stokes Social Network: number of close friends | −0.10 | 0.07 | 1.79 | 0.91 | 0.78–1.05 |
| Overall satisfaction with social network | −0.27 | 0.17 | 2.41 | 0.77 | 0.55–1.07 |
| NYUCI-AC treatment | −1.16* | 0.46 | 6.53 | 0.31 | 0.13–0.76 |
Note. SE = standard error; OR = odds ratio; CI = confidence interval.
*p < .05. **p < .01. ***p < .001.
Multinomial Logistic Regression: Effects of the NYUCI-AC on Specific Types of Residential Care Placement
When we conducted a multinomial logistic regression model to predict specific kinds of residential care placement that included the baseline covariates, the model did not converge. It appeared that the inclusion of caregiver gender (with the small number of men) was the principal reason the full multinomial model did not converge. When we excluded caregiver gender from the multinomial logistic regression model, it did converge. Those in the control group were more than 4 times as likely to enter an assisted living or similar residential care setting than those in the NYUCI-AC treatment group (B = 1.48, SE = 0.49, Wald = 9.03, odds ratio = 4.41, 95% CI = 1.68–11.60). There was a trend toward the NYUCI-AC treatment leading to lower nursing home placement compared with the control group, but this difference did not achieve statistical significance (p = .08).
Cox Proportional Hazards Model: Effects of the NYUCI-AC on Time to Residential Care Placement
The results of the Cox proportional hazards model are displayed in Table 4; probability survival curves are presented in Figure 2. With the exception of caregiver gender and treatment assignment, the other covariates (subjective health, number of close friends, and overall satisfaction with social network) were included as time-varying covariates. Adult child caregivers in the NYUCI-AC treatment condition were significantly more likely to delay residential care placement of parents compared with usual care controls (B = −0.64, SE = 0.32, Wald = 3.99, relative risk = 0.53, 95% CI = 0.28–0.99; p < .05). To determine number of days delayed, we conducted a Kaplan–Meier survival analysis using residential care placement as the outcome; the mean time from baseline to residential care admission for parents of adult children in the NYUCI-AC treatment condition was 971.60 days (SE = 72.27) compared with 743.24 days for those in the control group (SE = 66.49) (log-rank p = .03; Breslow p = .07; Tarone–Ware p = .047).
Cox Proportional Hazards Model: Effects of the New York University (NYU) Caregiver Intervention-Adult Child (NYUCI-AC) on Time-to-Care Recipient Residential Care Placement
| Variables | B | SE | Wald | Relative risk | 95% CI |
|---|---|---|---|---|---|
| Time-invariant covariates | |||||
| Caregiver is female | −0.35 | 0.77 | 0.20 | 0.71 | 0.16–3.21 |
| Caregiver subjective health | −0.66 | 0.45 | 2.13 | 0.52 | 0.21–1.26 |
| Stokes Social Network: Number of close friends | 0.06 | 0.09 | 0.42 | 1.06 | 0.89–1.25 |
| Overall satisfaction with social network | 0.34 | 0.23 | 2.30 | 1.41 | 0.90–2.20 |
| Time-varying covariates | |||||
| Caregiver subjective health | 0.002* | 0.001 | 4.07 | 1.002 | 1.00–1.003 |
| Stokes Social Network: Number of close friends | 0.00 | 0.00 | 1.62 | 1.00 | 1.00–1.00 |
| Overall satisfaction with social network | −0.001 | 0.001 | 3.40 | 1.00 | 1.00–1.00 |
| NYUCI-AC Treatment | −0.64* | 0.32 | 3.99 | 0.53 | 0.28–0.99 |
Note. SE = standard error. CI = confidence interval.
*p < .05. **p < .01. ***p < .001.
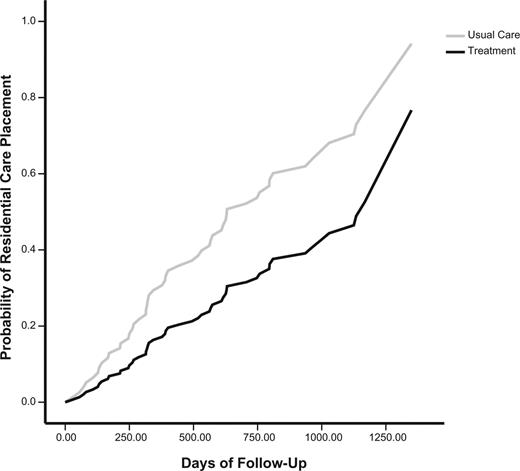
Cox proportional hazards survival curves: Probability of residential care placement (1 – survival probability) at the mean of covariates, New York University Caregiver Intervention-Adult Child (NYUCI-AC; N = 107).
Residential Care Placement and its Implications for Caregivers
The delay of institutionalization is potentially inappropriate if it is accompanied by increased stress or negative mental health on the part of family caregivers (Gaugler, Mittelman, Hepburn, & Newcomer, 2010; Gaugler, Roth, Haley, & Mittelman, 2008). To find out whether this was the case, we conducted a series of bivariate correlations between mean levels of key stressors and depression at 4 months, 1 year, and 2-year follow-up intervals and a Treatment × Placement interaction term (Table 5). This helped to determine whether those in the NYUCI-AC treatment condition who did not admit their care recipients to a residential care facility were more likely to report stress or depressive symptoms than those in the control group who did admit their care recipients. None of these empirical associations emerged as statistically significant or approached significance (p > .24). We repeated the bivariate correlations between stress, depression, and a Treatment × Days to Placement interaction term and also found that mean levels of caregiver stress and mental health at 4 months, 1 year, or 2 years were not significantly associated with treatment group assignment and delay of residential care placement (Table 5).
Time × Placement and Time × Days to Placement Correlational Analysis Results: Role Captivity, Role Overload, and Caregiver Depressive Symptoms
| Time, 2/4 months (n = 101) | Time, 4/1 year (n = 88) | Time, 6/2 years (n = 65) | |||||||
|---|---|---|---|---|---|---|---|---|---|
| Roleoverload (M = 7.28; SD = 2.18) | Rolecaptivity(M = 7.82;SD = 2.06) | MoodAssessmentScale(M = 5.74;SD = 4.76) | Roleoverload(M = 7.77;SD = 2.05) | Rolecaptivity(M = 7.77;SD = 2.46) | MoodAssessmentScale(M = 5.74;SD = 4.90) | Roleoverload(M = 7.75;SD = 2.41) | Rolecaptivity(M = 7.44;SD = 2.51) | MoodAssessmentScale(M = 5.57;SD = 5.48) | |
| Treatment × placement | 0.01 | −0.11 | −0.12 | −0.10 | −0.08 | −0.09 | −0.12 | −0.15 | 0.03 |
| Treatment × days to placement | −0.11 | −0.26† | 0.02 | −0.08 | −0.14 | −0.05 | −0.11 | −0.17 | 0.13 |
Note. M = mean; SD = standard deviation; CI = confidence interval.
*p < .05. **p < .01. ***p < .001. †p = .06.
Discussion
The delay in institutionalization among parents of adult child caregivers who received the NYUCI-AC (which was achieved without greater distress and negative mental health for caregivers) suggests the efficacy of this multicomponent model. One of the goals of the individual and family sessions, support groups, and ad hoc counseling was to provide emotional support to NYUCI-AC participants and help them to cope with the changes related to the influence of a parent’s ADRD on the adult child–parent relationship. The emotional support provided may have enabled adult child caregivers to understand that their parents’ behaviors were due to an underlying disease process and to not take these disturbances personally. The counseling sessions also offered caregivers the opportunity to explore emotionally challenging issues and to develop effective solutions to alleviate the stress they caused.
In an analysis published in 2006, in which time to placement was estimated for 9.5 years after enrollment, Mittelman and colleagues found that the unadjusted median time from baseline to nursing home placement of spouses suffering from AD was 1,766 days for those in the NYUCI treatment group compared with 1,181 days for those in the control condition (Mittelman et al., 2006). Although there are important variations in study designs, samples, and time frames between earlier NYUCI evaluations and the current adaptation, a comparison of findings suggests that the NYUCI model allows persons with ADRD to remain at home longer for both spousal and adult child caregivers. The original NYUCI and the NYUCI-AC also appear to result in greater delays in residential care admission for ADRD caregivers than other intervention protocols (Andrén & Elmståhl, 2008).
Although the focus on adult children and use of a single-blinded, randomized controlled design to evaluate the NYUCI-AC are among the strengths of this study, there are several notable limitations. The sample size is small; the participants are Caucasian, female, and well educated (particularly in comparison to several recent multicomponent evaluations Belle et al., 2006). Due to the many time pressures and role responsibilities of adult children in our sample, the completion of six consultation sessions often extended well beyond the original 4-month time frame; we also provided the NYUCI-AC to two adult child caregivers out of state, which necessitated telephone or videoconferencing counseling sessions. Additional telephone, in person, and e-mail ad hoc counseling sessions were also delivered to some caregivers, as many desired this ongoing support. This variation in protocol delivery requires a comprehensive process evaluation (forthcoming) to better ascertain how such diversity in session completion and protocol adherence influenced other key outcomes. Another potential limitation could have been the inability of caregivers’ to distinguish between different types of residential care placement. Participants did specify whether placement occurred in an assisted living or a nursing home, and the first author’s knowledge of residential care settings in the study region corroborated their reports. Although we did not measure quality of care or quality of life of care recipients who remained in the community compared with those who were admitted to residential care settings, our post hoc analysis suggests that the delay of placement in the group receiving the NYUCI-AC was not accompanied by greater caregiver distress than in the control group.
Almost twice as many participants in the control group placed their parent in a residential care setting as did those who received the NYUCI-AC; it appeared that the intervention was particularly effective in postponing placement in assisted living facilities. There was also a small, albeit statistically nonsignificant, difference in nursing home placements. We did not explicitly ascertain the cost of residential care versus home care for individual families. However, in the aggregate, available data suggest that postponing placement in assisted living facilities has implications for both the personal and the public costs of care. In addition to Medicaid playing an increasing role in payment for assisted living facilities, many families may spend down their parents’ personal assets thereby reducing possible inheritance benefits for themselves before their parents become eligible for Medicaid (Mollica, 2009).
We feel it is important to explain our decision to combine assisted living entry with nursing home admission as a global “residential care placement” outcome. Due to its emphasis on choice, control, and autonomy, assisted living was formerly positioned as either an appealing alternative to the more hospital style, institutional milieus of nursing homes or as a bridge between home health care and nursing homes (Kane, Chan, & Kane, 2007). Assisted living is often thought of as a care option that is located on a different point of the “long-term care continuum” than nursing homes. However, given various policy developments in Minnesota and elsewhere, it is no longer clear that assisted living is operating as an entirely discrete, earlier point on the long-term care continuum. Due to the moratoria that states have implemented on the building of new nursing home beds (see http://www.health.state.mn.us/divs/fpc/profinfo/lic/licnh.htm), assisted living facilities have adapted to meet the residential needs of clients suffering from moderate-to-severe cognitive impairment (via the provision of special memory care settings). This trend is expected to continue. Nevertheless, on average, residents of assisted living facilities are currently less severely impaired than those in nursing homes and some could live at home if their family caregivers had sufficient support.
Studies of the cost of assisted living also suggest a considerable expense to payers. The average cost for basic assisted living services nationally was $3,477 per month in 2011, which extrapolates to $41,274 per year (Alzheimer’s Association, 2012). For those settings that charged a variable rate for assisted living residents in memory care units, the average rate was $4,619 per month (or $55,428 per year). Nearly half (46%) of parents with ADRD in this sample who were admitted to assisted living were recorded as entering a memory care unit (this percentage is likely higher, as we did not record memory care unit use within assisted living in the initial months of data collection). It is important to note that assisted living is not entirely subsidized by private payers in Minnesota. In 2009, 615 of the 1,400 “housing with services” settings in Minnesota (of which 63% were considered assisted living) accepted residents via the Medicaid Home and Community Based Services waiver program (Mollica, 2009). Although the environment- and consumer-oriented policies of assisted living may be favorable and desired for many residents, it could be argued that delaying or preventing the use of assisted living as in this evaluation is a potentially positive fiscal outcome for families as well as federal and state governments.
The effect of delayed residential care placement on the caregiver must be considered in interpreting the results of our analyses. As we noted in our evaluation of the original NYUCI across the nursing home placement transition (Gaugler et al., 2008), institutionalization itself can reduce stress and depression for ADRD caregivers. Such findings emphasize the need to balance the policy/cost implications of keeping older adults with dementia at home for longer periods of time with the effects on quality of life of persons with ADRD and their family caregivers, the latter of whom may exhaust their emotional and instrumental resources to provide care at home. Prior evaluations of the NYUCI for spouse caregivers suggest, however, that the social support provided by this intervention leads to enhanced emotional resources of caregivers (Roth, Mittelman, Clay, Madan, & Haley, 2005) both before and after placement (Gaugler et al., 2008; Mittelman et al., 2004). Although the number of participants in this study is too small for a similar longitudinal, meditational analysis, the available data on mean levels of caregiver stress and depression over time suggest a similar mechanism for adult children.
From a clinical perspective, our experience in implementing and evaluating the NYUCI-AC raises several issues. As was stated earlier, in most cases it was simply not feasible to provide six individual and family counseling sessions within a 4-month time frame due to caregivers’ competing life responsibilities. Although enforcement of such a protocol may be possible among spouses and/or in a clinic-based setting that is oriented around regular medical encounters and a more authoritarian dynamic, the community-based sample of adult children included in the NYUCI-AC were highly consumer minded. For example, as opposed to regularly scheduling sessions, adult children would “save” individual or family sessions beyond the 4-month period saying that they would rather use them when needed (even though ad hoc counseling was also provided). In addition, some adult children in the NYUCI-AC were very resistant to including other family members in the sessions. Similar issues of treatment fidelity have been raised in assessing the effectiveness of community translations of ADRD caregiver interventions throughout the United States (Burgio et al., 2009; Rosalynn Carter Institute for Caregiving, 2012). Future research should focus on understanding how interventions that demonstrate efficacy can be adapted for effective translation into everyday practice as frontline, psychosocial treatment options for people with ADRD and their family caregivers.
Funding
This research was supported by grant R01 AG01022066. This project was also supported by grant number 1UL1RR033183 from the National Center for Research Resources (NCRR) and by grant number 8 UL1 TR000114-02 from the National Center for Advancing Translational Sciences (NCATS) of the National Institutes of Health (NIH) to the University of Minnesota Clinical and Translational Science Institute (CTSI).
Acknowledgments
The authors would like to thank William Haley, Steve Zarit, Kristie Kellis, Cynthia Epstein, Mary Boldischar, Vanessa Berglund, Katie Wocken, Sarah Wooley, Mary Dang, Ronit Notkin, Olanta Barton, and June Aaronson for their clinical and scientific expertise, data management, and data entry on this project. The authors would especially like to acknowledge the reviewers, whose feedback helped to enhance the contributions of this study.
References
Author notes
Decesion Editor: Rachel Pruchno, PhD

