


Abstract
To compare the prognostic value of negative non-invasive cardiac investigations (coronary computed tomographic angiography [CCTA], cardiovascular magnetic resonance [CMR], exercise electrocardiographic testing [EET], positron emission tomography [PET], stress-echocardiography [SE], and single-photon emission tomography [SPECT]) in patients with suspected or known coronary artery disease (CAD) and to explore the effect of adjustment for population event risk and presence of CAD.
MEDLINE/PubMed database, EMBASE and Cochrane Library were searched from January-1990 to April-2015 for studies reporting annual event rates (AER) of myocardial infarction (MI) and cardiac death. Pooled estimates of AERs were calculated using a DerSimonian and Laird random-effects model. Multivariable linear meta-regression analysis was performed to compare the AER after a negative test result between modalities and to adjust for population event risk and proportion of patients with CAD. In 165 studies (122,721 patients), pooled AERs after negative test results differed significantly between modalities ranging from 0.32% for CCTA to 1.66% for SE, P < 0.001. However, the AER after a negative test result was positively correlated (r = 0.726, P < 0.001) with population event risk. Adjusting for population event risk and proportion of patients with CAD resulted in more similar event rates after a negative test result.
This meta-analysis is the first study comparing the prognostic value of all available non-invasive cardiac investigations. Outcome differences between modalities after a negative test result are profoundly influenced by large variations in population event risk and a negative test result for all modalities conveys an excellent prognosis for patients with suspected or known CAD.
Introduction
Non-invasive cardiac investigations such as coronary computed tomographic angiography (CCTA), cardiovascular magnetic resonance imaging (CMR), exercise electrocardiographic testing (EET), positron emission tomography (PET), stress echocardiography (SE), and single-photon emission tomography (SPECT) are increasingly being applied for risk stratification of patients with suspected or known coronary artery disease (CAD). The prognostic value is one of the most clinically relevant features of cardiovascular investigations.1–9 Risk stratification is important to identify patients at low risk for future cardiovascular events as opposed to patients that may benefit from medical therapy or coronary revascularization.2,9 Therefore, a negative test result should reassure both patient and physician that further downstream testing can be safely withheld. Previous systematic reviews were mostly limited to 1 or 2 modalities, studied a highly selected population or compared dedicated study protocols (e.g. exercise SPECT and SE).3,4,6,8 To the best of our knowledge, a comprehensive analysis and comparison of all different non-invasive cardiac investigations based on the published data has not been performed in one study before. Additionally, the influence of the pre-test probability on differences of the prognostic value of a negative cardiac investigation test result between all non-invasive modalities has not been explored in a single study.
This meta-analysis was conducted to provide a higher level of evidence on the prognostic value of a negative non-invasive cardiac investigation test result for all commonly used modalities in patients with suspected or known CAD. The primary purpose of this study was to compare the prognostic value of negative non-invasive cardiac investigation test results while accounting for differences in population event risk and the proportion of patients with known CAD.
Methods
Data sources and searches
We searched the MEDLINE/PubMed, EMBASE, and Cochrane Library databases for English literature from January 1990 to April 2015 on the prognostic value of different non-invasive cardiac investigations in patients with suspected or known CAD. We used the following Medical Subject Headings (MESH) and search terms: ‘exercise test’, ‘bicycle ergometry test’, ‘electrocardiography’, ‘imaging, magnetic resonance’, ‘single photon emission computed tomography’, ‘positron emission tomography’, ‘stress echocardiography’, ‘computed tomography’, ‘x ray’, ‘prognosis’, and ‘coronary artery disease’. The exact search terms used for MEDLINE are available in Supplementary data online, Appendix A.
Additionally, we screened the bibliographies of all selected articles, relevant reviews, and meta-analyses for potential suitable references. Only peer reviewed and published studies were included (e.g. no abstracts). Authors were not contacted for additional information not given in the main manuscript, tables or appendices. The final study selection was undertaken in consensus by two reviewers.
Study selection
Studies assessing the prognostic value of CCTA, CMR perfusion (CMR-perf), CMR wall motion (CMR-wm), EET, PET, SE, or SPECT in patients with suspected or known CAD with a follow-up of at least 3 months were eligible for inclusion. We included studies reporting absolute numbers or an annual event rate (AER) of cardiac death and non-fatal myocardial infarction (MI) for patients with a negative test. The primary aim of this study was to compare the prognostic value after a negative test between all non-invasive cardiac investigations in patients with suspected or known CAD. Therefore, we excluded studies that only screened asymptomatic subjects or highly specific populations such as patients with a (non-)ST elevation MI, severe left ventricular dysfunction or immediately after revascularization.
Care was taken to identify and exclude duplicate patient populations. Articles published by the same research group were included only if it was unambiguous that different patient populations had been included, otherwise the study with the largest sample size was selected. If more than one diagnostic test had been evaluated within a single publication (e.g. EET and SPECT), each modality was considered separately when possible. Studies reporting multiparametric imaging protocols were included only if data on the individual imaging parameter or technique was derivable. The current meta-analysis was performed according to the MOOSE and PRISMA guidelines (checklists available see Supplementary data online, Appendixes B and C).10
Definitions and data extraction
The definition of a negative test result differed for each modality. For the purpose of the current study, we defined a negative test result as 1) <50% luminal narrowing on CCTA, 2) absence of reversible wall motion abnormalities on CMR-wm or SE, 3) absence of reversible perfusion defects on CMR-perf, PET, or SPECT, or 4) absence of ST-segment depression on EET. It was considered sufficient if a perfusion or wall motion study only presented data for patients without any abnormalities (i.e. ‘neither fixed nor reversible’ wall motion abnormalities or perfusion defects).
We extracted general information about the study such as first author, journal, and year of publication. Other variables of interest consisted of design (i.e. retrospective or prospective), patient and study characteristics (e.g. mean age, proportion of patients with CAD at baseline, and sample size), technical information on the specific non-invasive cardiac investigation (e.g. tracer, stressor), and follow-up duration. Subsequently, we extracted all derivable absolute numbers and AERs (with 95% confidence intervals [CI]) for cardiac death and MI after a negative test result. If available, total event rates of cardiac death and MI during follow-up, i.e. population event risk, were also recorded as indicators of baseline event risk in the entire study population regardless of the test result. Total event rates were derived only from studies reporting event rates for the total population and regardless of the test result. Two investigators derived the data and discrepancies were resolved in consensus by a third investigator.
Quality assessment
Study quality assessment was performed for each study using a 6-point scoring system adapted from the Newcastle-Ottawa Scale for the assessment of quality of observational studies.11 The following parameters were scored: (1) representative study population (i.e. no selection bias), (2) adequate description of patient characteristics (i.e. age, sex, and history of CAD, MI, or revascularization [1 point was added if all characteristics were appropriately described]) (3) outcome of interest not present at start of the study, (4) confirmation of outcome by corroboration by e.g. medical records, (5) follow-up duration of ≥1 year, (6) complete follow-up of ≥90% of the study population. Studies scoring 6 points on this adapted Newcastle-Ottawa Scale were considered as studies with high quality.
Data synthesis and analysis
A pooled estimate of the annual probability of future cardiac death or MI in patients with negative test results was calculated for each non-invasive modality. AERs were derived from individual studies or were calculated by dividing the total number of recorded events (cardiac death or MI) by the mean or median follow-up period, assuming a constant event rate during follow-up.12 In concordance with current guidelines, the number of cardiac deaths or MI was considered the most appropriate endpoint for prognostic risk assessment.9 To stabilize variance of the proportions from individual studies, Freeman-Tukey arcsine square root transformed proportions were pooled using a DerSimonian and Laird random-effects model.13 The weighted mean of the transformed proportions was back transformed for calculation of pooled AERs after negative test results. Additional subgroup analyses were performed to investigate the influence of study design (i.e. prospective and retrospective), stressor (i.e. pharmacological and exercise testing), and follow-up duration (stratified by the median follow-up) on the differences of the prognostic value after a negative test result between all non-invasive cardiac investigations.
Multivariable linear meta regression analysis was used for comparing modalities with respect to AER after a negative test result. Modalities were coded by dummy variables and the modality associated with the lowest unadjusted AER after a negative test result was nominated as the reference category. The regression coefficient with 95% confidence interval corresponding with a specific modality indicates the difference in pooled proportions compared to the reference category. To adjust for potential confounding by population event risk and proportion of patients with CAD at baseline, these variables were entered as covariates in the meta-regression model. Adjusted regression coefficients were used to estimate the annual risk of events after a negative test result for each modality at a constant population event risk and proportion of patients with pre-existing CAD. For this purpose, we estimated pooled AER for each modality using the pooled estimate of population event risk and/or proportion of patients with pre-existing CAD.
Heterogeneity of the study results was examined using tau squared statistics and the I2 index. The I2 estimates the percentage of total variation across studies and modalities that can be attributed to differences between studies rather than chance, an I2 of 0% indicates no heterogeneity.14 Differences in results between studies with small vs. large sample size were evaluated by the Egger test for funnel plot asymmetry. The intercept of the regression line provides a measure for asymmetry. Values <0.1 were considered as indicative of funnel plot asymmetry because of limited power of the test.
In all other analyses, P-values <0.05 were considered to indicate statistical significance. All analyses were performed using Statsdirect (v. 2.8.0, Cheshire, UK) and Stata (v. 11, College Station, Texas, USA).
Results
Literature search
The initial literature search yielded 5575 potentially relevant references, of which 1472 reviews and case reports were excluded. A more detailed review of the 4103 remaining articles led to the exclusion of another 3987 articles, resulting in 116 articles eligible for inclusion. Citation tracking identified an additional 49 articles. Ultimately, 165 studies met our inclusion criteria: 30 CCTA, 13 CMR-perf, 6 CMR-wm, 21 EET, 4 PET, 36 SE, and 55 SPECT studies (Figure 1).
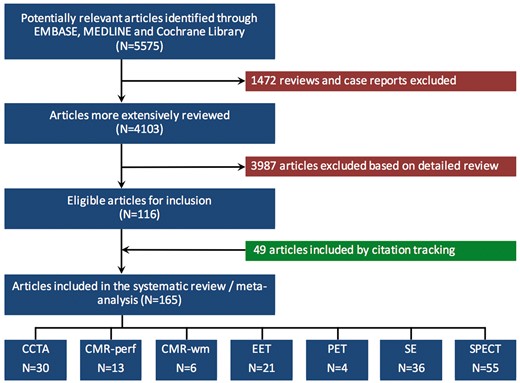
Flow chart of literature search and study selection.
Characteristics of included studies
A total of 122 721 patients were included in this meta-analysis. The mean follow-up time was 2.7 ± 1.7 years and the median follow-up 2.3 years with an interquartile range of 1.5–3.4. Seventy-four percent of studies had a mean follow-up time of <3 years. The mean age was 60 ± 5 years and 55% of the population was male. Overall, 19% of patients had known CAD at baseline and 15% had a history of MI. The prevalence of CAD at baseline differed considerably between modalities from 3% for CCTA to 51% for CMR-wm (Table 1). The overall study quality score was 5 (SD 1) points and 16% of the studies were scored as having a high quality (i.e. 6 points, see Supplementary data online, Appendix D). The characteristics, outcome data and references of all studies included are presented in the appendix (see Supplementary data online, Appendix E Tables A1a–A7a and references).
Characteristics of all included studies (n = 165)
| Median follow-up in years (IQR) | Male gender | Age in years (SD) | Known CAD/MI | Patients with a negative test (n) | Patients with a negative test (%) | Total patients (n) | |
|---|---|---|---|---|---|---|---|
| CCTA | 1.9 (1.2–3.3) | 57% | 51 (4) | 3%/1% | 13 888 | 77% | 18 020 |
| CMR-perf | 1.8 (1.2–2.5) | 59% | 60 (4) | 38%/22% | 3394 | 66% | 5112 |
| CMR-wm | 2.1 (2.0–3.3) | 66% | 63 (1) | 51%/27% | 4736 | 76% | 6199 |
| EET | 3.1 (1.8–4.1) | 64% | 56 (4) | 23%/17% | 12 021 | 75% | 16 040 |
| PET | 2.3 (2.2–2.6) | 36% | 62 (2) | 24%/9% | 1796 | 68% | 2627 |
| SE | 2.4 (1.2–3.7) | 54% | 61 (6) | 28%/23% | 14 506 | 72% | 20 086 |
| SPECT | 2.3 (1.9–3.6) | 51% | 62 (6) | 15%/14% | 42 521 | 78% | 54 637 |
CAD, coronary artery disease; CCTA, coronary computed tomographic angiography; CI, confidence interval; CMR-perf, cardiovascular magnetic resonance perfusion; CMR-wm, cardiovascular magnetic resonance wall motion; EET, exercise electrocardiographic testing; IQR, interquartile range; MI, myocardial infarction; PET, positron emission tomography; SD, standard deviation; SE, stress echocardiography; SPECT, single-photon emission tomography.
Comparison of annualized event rates after a negative test result between modalities
For all 7 modalities, a negative test result was associated with a low AER for future cardiac death and MI. A first comparison without adjustment for baseline risk and based on all 165 studies indicated that a negative CCTA test result was associated with the lowest pooled AER (i.e. 0.32% [95% CI 0.22–0.43]) and differed significantly from CMR-wm, EET, SE, and SPECT (Figure 2A). The prognostic value of CMR-perf and PET did not significantly differ from CCTA. The AERs after a negative test result for each individual study are presented in Forest plots (see Supplementary data online, Appendix F). Subgroup analyses showed that differences in the prognostic value after a negative test result between the non-invasive cardiac investigations were not influenced by the study design or follow-up duration (see Supplementary data online, Appendix G). For SE and SPECT studies, the pooled AERs after a negative test were lower for studies using exercise stress (1.23% [95% CI 0.68–1.94] and 1.04% [95% CI 0.67–1.49]) than for studies using pharmacological stress (1.94% [95% CI 1.22–2.82] and 1.88% [95% CI 1.01–3.01]), although this difference was not statistically significant (P = 0.387 and P = 0.132, respectively). Restriction of the analysis to 45 studies which included only patients with suspected CAD (thus without known CAD), resulted in lower AERs after a negative test and a substantial reduction of differences between modalities (Figure 2B).
![Pooled annualized event rates (AER) for cardiac death and myocardial infarction after a negative test result for all commonly used non-invasive cardiac investigations. Panel A presents the pooled AER for all studies in patients with suspected or known CAD and panel B shows the results for studies including patients suspected for CAD only. Panel C and panel D represent the fitted AERs per modality after a negative test result adjusted for ‘population event risk’ and ‘population event risk and prevalence of CAD’, respectively. The weighted mean of the transformed proportions was back transformed for calculation of the adjusted (fitted) AER after a negative test result. The adjusted AER after a negative test result was fitted for the annualized population event risk (i.e. 2.06% [95% CI 1.72–2.43], panel C and D) and proportion of patients with CAD (i.e. 25%, panel D) in this subset of 119 and 71 studies. For clarification and interpretation of panel D, the characteristics of the included SPECT studies were relatively close to the mean population event risk and proportion of patients with baseline presence of CAD, while CCTA studies differed substantially with a lower population event risk and near absence of CAD at baseline. Therefore, adjustment to the overall mean did not substantial shift the results for SPECT (panel A vs. panel D), but fitting the AER of the CCTA studies to the mean population even risk and baseline presence of CAD (thus towards a higher risk for CCTA) resulted in a much higher adjusted AER.](https://oup.silverchair-cdn.com/oup/backfile/Content_public/Journal/ehjcimaging/18/9/10.1093_ehjci_jex014/2/m_jex014f2.jpeg?Expires=1716347397&Signature=sQ4LCZNeH-0hn1GKvjInCSiO5-zeFEnBZmb6IerI5iItWwImXIG9I7AhtNYaMPJoJvbnaXh2NYh934HugaSGqq2Fjx7pprP7vQxFkoeHJydDjO0XJkxkjdEiybAhkVdR2htVVlFOy3E7JHv6lKLupjEWEhmiDaTBQz660oT3ZPP~L1FuO-NR0uMCyDR~EkpwZZF0-KVUO09ggy9jsrZkFQ5f8lvxgRzhTJNeU8u5jGvqAJT8UMd0ZWIdd9ZO3S0GnfK3pDOcVMtxASil0~9TKP6EcDStBXa2oz~dXzNSLq0RG4qK5fgdTkVjYZr6tuF5hbcheGIws8~EIhEG7faE3A__&Key-Pair-Id=APKAIE5G5CRDK6RD3PGA)
Pooled annualized event rates (AER) for cardiac death and myocardial infarction after a negative test result for all commonly used non-invasive cardiac investigations. Panel A presents the pooled AER for all studies in patients with suspected or known CAD and panel B shows the results for studies including patients suspected for CAD only. Panel C and panel D represent the fitted AERs per modality after a negative test result adjusted for ‘population event risk’ and ‘population event risk and prevalence of CAD’, respectively. The weighted mean of the transformed proportions was back transformed for calculation of the adjusted (fitted) AER after a negative test result. The adjusted AER after a negative test result was fitted for the annualized population event risk (i.e. 2.06% [95% CI 1.72–2.43], panel C and D) and proportion of patients with CAD (i.e. 25%, panel D) in this subset of 119 and 71 studies. For clarification and interpretation of panel D, the characteristics of the included SPECT studies were relatively close to the mean population event risk and proportion of patients with baseline presence of CAD, while CCTA studies differed substantially with a lower population event risk and near absence of CAD at baseline. Therefore, adjustment to the overall mean did not substantial shift the results for SPECT (panel A vs. panel D), but fitting the AER of the CCTA studies to the mean population even risk and baseline presence of CAD (thus towards a higher risk for CCTA) resulted in a much higher adjusted AER.
Influence of the population event risk on the prognosis after a negative test result
Data on the population event risk (as indicator of baseline risk in the entire study population regardless of the test result) could be derived from 119 studies, including 53 454 patients with a negative test result. This subset of 119 studies was representative for all 165 studies included as similar event rates after a negative test result were observed for all modalities (see Supplementary data online, Appendix H). In these 119 studies, the AER after a negative test result was positively correlated with the population event risk, with an overall r = 0.726 and P < 0.001 (Figure 3, Table 2). Furthermore, this figure illustrates that certain modalities were generally evaluated in study populations at higher event risk (e.g. for SE total AER 3.82% [95% CI 2.76–5.03]) than other modalities (e.g. for CCTA total AER 0.74% [95% CI 0.46–1.09], which is five times lower than for SE). Multivariable linear meta regression analysis with adjustment for annualized population event risk was performed. The results were used to estimate the annual risk of events after a negative test result for each modality at a population event risk of 2.06%, in the 119 studies. Differences between modalities in AER after a negative test result (Figure 2C) became substantially smaller when adjusting for the between modality differences in population event risk. The I2 index decreased from 64.7% to 32.0%. However, AER after negative EET, SE, and SPECT remained higher than the risk of adverse events after a normal CCTA. An analysis with adjustment for both population event risk (i.e. 2.06%) and proportion of patients with known CAD at baseline (i.e. 25%) could be performed in a subset of 71 studies that provided information on these two potential confounders. Heterogeneity between study results decreased further to an I2 of 0%. The discrepancies in pooled AERs at a population event risk of 2.06% and proportion with pre-existing CAD of 25% became even smaller resulting in a rather similar prognosis after a negative test result, although AER after a negative SE test was still slightly higher in comparison with a normal CCTA test result (P = 0.048, Figure 2D and see Supplementary data online, Appendix H).
The annualized event rates (AER) for cardiac death and myocardial infarction after a negative test result in relation to population event risk
| CCTA | CMR-perf | CMR-wm | EET | PET | SE | SPECT | |
|---|---|---|---|---|---|---|---|
| Studies (n) | 23 | 9 | 5 | 17 | 2 | 29 | 34 |
| Patients (n) | 15 937 | 4 423 | 5 985 | 10 579 | 1 556 | 18 569 | 25 574 |
| Negative test % | 74 | 64 | 76 | 65 | 46 | 70 | 53 |
| Follow up median in years (IQR) | 2.00 (1.30-3.30) | 2.50 (1.45-2.90) | 2.10 (1.55-4.95) | 2.60 (1.65-3.90) | 2.00 (1.70-2.30) | 2.30 (1.05-4.15) | 2.30 (1.60-3.60) |
| Weighted AER neg test | 0.33 (0.22-0.46) | 0.82 (0.46-1.27) | 0.97 (0.32-1.97) | 0.90 (0.44-1.52) | 0.76 (0.26-1.53) | 1.77 (1.26-2.37) | 1.40 (1.05-1.81) |
| Population event risk | 0.74 (0.46-1.09) | 1.94 (1.18-2.89) | 1.90 (1.07-2.95) | 1.32 (0.71-2.10) | 3.36 (2.52-4.31) | 3.82 (2.76-5.03) | 2.72 (2.11-3.42) |
CCTA, coronary computed tomographic angiography; CMR-perf, cardiovascular magnetic resonance perfusion; CMR-wm, cardiovascular magnetic resonance wall motion; EET, exercise electrocardiographic testing; IQR, interquartile range; PET, positron emission tomography; SE, stress echocardiography; SPECT, single-photon emission tomography.
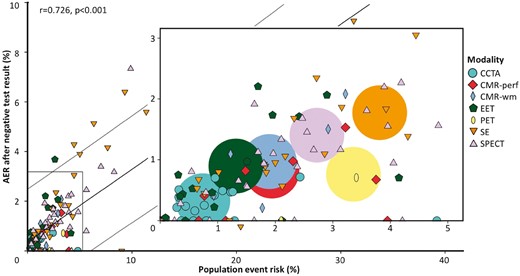
The annualized event rates (AER) for cardiac death and myocardial infarction after a negative test result in relation to population event risk. For each study (n = 119), the AER after a negative test result is presented in relation to the population event risk regardless of the test. The AER after a negative test result was positively correlated with the population event risk, with an overall r = 0.726 and P < 0.001. The box in the centre is a magnification of the smaller box in the lower left corner of the main figure (no data points exist behind the magnification). The larger circles in the magnified diagram represent the weighted AER for each modality.
Discussion
The current study is, to the best of our knowledge, the first meta-analysis comparing the prognostic value of a negative test result between all commonly used non-invasive cardiac investigations in patients with suspected or known CAD. Our results strengthen the general concept that a negative test result yields an excellent prognosis for all modalities. However, we also demonstrate that significant differences exist between modalities, with pooled AERs for cardiac death and MI ranging from 0.32% for CCTA to 1.66% for SE after a negative test result and that this variation was highly associated with the population event risk, which differed up to five-fold across modalities. Adjusting for the population event risk and the proportion of patients with pre-existing CAD resulted in absence of heterogeneity between study results and a more similar prognosis after a negative test result.
Over the last decades, non-invasive cardiac investigations have emerged as a robust element in the work-up of patients with suspected or known CAD.1–9 Although non-invasive investigations are initially used as a diagnostic tool, its prognostic value after a negative test result is important. A negative test result should reassure both patient and physician, obviating the need for further downstream testing or therapy. Referral of patients to the appropriate modality should be based on the pre-test probability.2,9 In addition, according to Bayes’ theorem, the pre-test probability should also be considered when evaluating the prognostic value of a negative test result between modalities.15 In the current study, we calculated the actual pre-test probability (population event risk) by pooling the number of events in the entire population (i.e. regardless of the test result) for each modality. This provided insight into the differences in baseline risk of populations referred to the studied modalities. Considerable variations in the pooled estimates of population event risk (ranging from 0.74% in CCTA studies to 3.82% in SE studies) and baseline prevalence of known CAD (ranging from 3% for CCTA to 51% for CMR-wm) were observed between modalities, indicating that some tests are applied in patients at lower risk and others in patients at higher risk. Furthermore, differences in population event risk substantially affected the comparison of the prognostic value of a negative test result. Thus, the general belief that CCTA has a superior negative predictive value is not supported by the results from our meta-analysis, since we uniquely show that the apparently superior negative predictive value of CCTA is merely a result of studies including low risk populations and disappears with adjustment.
Of the seven non-invasive cardiac investigations included in this study, the majority was based on the detection of myocardial ischaemia (i.e. perfusion defects, wall motion abnormalities, or electrocardiographic changes) while CCTA evaluated the coronary anatomy and severity of stenosis. CCTA is currently able to gauge the haemodynamic significance of CAD by using non-invasive fractional flow reserve or CT perfusion, but data on their prognostic value is still limited.16–19 According to the definition of the studies included in the current meta-analysis, a negative test result was defined as either <50% luminal narrowing on CCTA or the absence of ischaemia for all other cardiac investigations. Notably, a negative test result does not rule out the presence of other prognostic indicators such as non-obstructive CAD, coronary calcifications, myocardial fibrosis, or wall motion abnormalities at rest.3,20,21 Although CCTA is able to evaluate the presence of non-obstructive CAD, the appropriate treatment and associated prognostic implications of these findings are presently still unclear.3 The recent PROMISE trial showed that a strategy using anatomical testing (i.e. CCTA) or functional testing (i.e. EET, SPECT, or SE) in patients suspected for CAD resulted in similar outcomes.22 Although the outcome data per test result are still awaited, the primary findings of the PROMISE trial are corroborated by the results of our meta-analysis, as we demonstrated similar event rates between modalities for studies investigating patients suspected for CAD only.
In addition to the pre-test probability, the clinical question (e.g. detection of a significant stenosis or myocardial ischaemia) and the prognostic value, other test-specific advantages and disadvantages should also be weighted before ordering a diagnostic test. For instance, EET or SE may be valuable choices since they offer important prognostic information and have many benefits such as widespread availability, low costs, and easy applicability. However, the EET studies often report non-diagnostic tests due to a limited exercise capacity or baseline ECG changes, and SE is known to be highly dependent on operator skills and the constitution of a patient. Exposure to ionizing radiation should always be taken into account when choosing a modality such as CCTA, PET, or SPECT, although substantial advances have been made to reduce the amount of radiation by technical and protocol adjustments.23–25 CMR is a comprehensive imaging modality that offers diagnostic versatility, but drawbacks include the confined space within the bore of the magnet and the restricted applicability in patients with ferromagnetic implants. Selecting the appropriate cardiac investigation therefore depends greatly on the clinical setting, the patient’s ability to exercise, as well as local availability and expertise.
As with any meta-analysis, our results are subject to heterogeneity between study results and the presence of publication bias. In the current meta-analysis, the results of patients with suspected or known CAD were pooled. Presenting the data for all patients reflects the body of literature most accurately on this topic as the majority of studies investigating non-invasive cardiac investigations consists of a mixed study population and it also represents a typical outpatient clinic population. Possible heterogeneity in patient management during follow-up cannot be excluded, since information regarding possible differences in (medical) therapy was not available on a per-patient basis. A direct comparison between different modalities within the same study population could overcome some of these drawbacks. However, data on the comparison between modalities was sparse and included only 12 studies selected for the current meta-analysis. Furthermore, these 12 studies showed much variation with respect to patient outcome and therefore did not allow a reliable analysis. Another limitation of this meta-analysis is its relatively short follow-up period (with a median follow-up of 2.3 [1.5–3.4] years).
Conclusions
Over the last decades, non-invasive cardiac investigations have expanded rapidly and play an important role in the daily management of patients with suspected or known CAD. This meta-analysis gives an overview of the literature on the prognostic value of all non-invasive cardiac investigations. The current study provides a strong level of evidence that a negative non-invasive cardiac investigation test result conveys an excellent prognosis. Differences in outcome after a negative test result between modalities can mainly be explained by significant variations in pre-test probability and proportion of pre-existing CAD. Adjustment for population event risk and proportion of patients with pre-existing CAD resulted in absence of the heterogeneity between study results and an excellent prognosis after a negative test result for all modalities. Even though referral of patients to a specific modality depends on the pre-test probability and clinical scenario, a negative test result should provide reassurance and arguably challenges the need for further downstream testing.
Supplementary data
Supplementary data are available at European Heart Journal—Cardiovascular Imaging online.
Acknowledgments
CJ and MS had full access to all the data in the study and take responsibility for the integrity of the data and the accuracy of the data analysis, any discrepancies were resolved in consensus by a third investigator (SS). CJ, MS, and PN conducted the statistical analysis.
Conflict of interest: All authors have completed a ICMJE uniform disclosure form. Dr. Smulders reports a grant from the Netherlands Heart Foundation (2014T051). Dr. Wildberger reports institutional grants from Siemens, Philips, GE, Bracco, Bayer, AGFA, personal fees (speakers' bureau) from Siemens, Bayer, outside the submitted work. Dr. Bekkers, Dr. Bucerius, Dr. Wildberger and Dr. Schalla report funding from The Weijerhorst foundation. The other authors do not declare any relevant conflicts of interest.
Funding
This work was supported in part by the Netherlands Heart Foundation [grant 2014T051] to [MWS]. Dr. Smulders reports a grant from the Netherlands Heart Foundation (2014T051). Dr. Wildberger reports institutional grants from Siemens, Philips, GE, Bracco, Bayer, AGFA, personal fees (speakers' bureau) from Siemens, Bayer, outside the submitted work. Dr. Bekkers, Dr. Bucerius, Dr. Wildberger and Dr. Schalla report funding from The Weijerhorst foundation. The other authors do not declare any relevant conflicts of interest.
References
Author notes
These authors contributed equally to this work.
