


Abstract
Impairment of cardiac sympathetic innervation is a potent prognostic marker in heart failure, while left ventricular mechanical dyssynchrony (LVMD) has recently been noted as a novel prognosis determinant in heart failure patients with reduced LV ejection fraction (HFrEF). This study was designed to determine the correlation between cardiac sympathetic innervation quantified by metaiodobenzylguanidine (MIBG) activity and LVMD measured by electrocardiogram-gated myocardial perfusion imaging and to evaluate their incremental prognostic values in HFrEF patients.
A total of 570 consecutive HFrEF patients were followed up for 19.6 months with a primary endpoint of lethal cardiac events (CE) such as sudden cardiac death, death due to pump failure and appropriate ICD shock against life-threatening ventricular tachyarrhythmias. Cardiac sympathetic function and innervation were quantified as heart-to-mediastinum ratio (HMR) and washout kinetics of cardiac MIBG activity. LVMD was assessed by a standard deviation (SD) of systolic phase angle in gated myocardial perfusion imaging. Patients with CE (n = 166, 29%) had a significantly lower HMR and a significantly greater phase SD than did non-CE patients: 1.46 ± 0.28 vs. 1.63 ± 0.29, P < 0.0001 and 39.1 ± 11.6 vs. 33.1 ± 10.1, P < 0.0001, respectively. Compared to the single use of optimal cut-offs of late HMR (1.54) and phase SD (38), their combination more precisely discriminated high-risk or low-risk patients from others with log rank values from 7.78 to 65.2 (P = 0.0053 to P ≤ 0.0001). Among significant univariate variables, multivariate Cox proportional hazards model identified NYHA functional class, estimated glomerular filtration rate (eGFR), HMR 1.54 and phase SD 60 as significant determinants of CE with hazard ratios of 3.108 (95% CI, 2.472–3.910; P < 0.0001), 0.988 (95% CI, 0.981–0.996; P = 0.0021), 0.257 (95% CI, 0.128–0.498; P < 0.0001) and 1.019 (95% CI, 1.019–1.037; P = 0.0228), respectively. By combining the four independent determinants, the prognostic powers synergistically (P < 0.0001) increased maximally to 263.8.
Left ventricular mechanical dyssynchrony and impairment of cardiac sympathetic innervation are synergistically related to lethal cardiac events, contributing to better stratification of lethal cardiac event-risks and probably to optimization of therapeutic strategy in patients with HFrEF.
Introduction
Despite advances in evidence-based drug and/or non-pharmacological treatment, the morbidity and mortality of congestive heart failure are still high. Left ventricular mechanical dyssynchrony (LVMD) has emerged not only as a guide to cardiac resynchronization therapy (CRT) but also as a novel prognosis determinant in heart failure patients with reduced left ventricular ejection fraction (LVEF). Although CRT has been established as a non-pharmacological treatment in patients with advanced-stage heart failure that is refractory to conventional medical therapy,1,2 about one-third of the patients who receive CRT do not respond to the treatment.3–5 Rather than electrical dyssynchrony, increased mechanical LVMD is likely to be associated with lethal cardiac events and may be a better biomarker for CRT response.5 Among several challenges for the evaluation of LVMD, a multicentre study failed to show the efficacy of echocardiographic LVMD assessment.6 Phase analysis, which has been used traditionally to quantify global and regional temporal alterations of left ventricular systolic function, has recently been applied to gated single-photon emission computed tomography (SPECT) myocardial perfusion imaging for quantitative assessment of global LVMD.7–10 Recent studies have demonstrated that LVMD assessed by gated SPECT imaging can be a biomarker not only for the indication of CRT but also for lethal cardiac event risks in patients with systolic heart failure.11–14 On the other hand, cardiac sympathetic function and innervation can be evaluated using 123I-labeled metaiodobenzynlguanidine (MIBG) imaging as an increased norepinephrine spillover (MIBG washout rate) and decreased norepinephrine content (MIBG activity) in failing human hearts. Recent multicentre investigations15–17 definitively supported the earlier findings of the feasibility and prognostic values of cardiac 123I-MIBG imaging for non-invasive quantitative assessment of cardiac sympathetic innervation in cardiology practice. The prognostic values of combined assessment of impairment of cardiac sympathetic innervation and LV dyssynchrony assessed by gated SPECT phase analysis, however, have not yet been established. The data reported previously are still preliminary because of small population studies, short-term studies and a lack of over-all evaluations such as the assessment of incremental prognostic values including standard prognostic markers in heart failure. From these findings, we hypothesized that cardiac mechanical dyssynchrony and cardioneuronal impairment are independently and synergistically related to unfavourable cardiac outcomes and can improve risk-stratification and risk-based selection of a therapeutic strategy for patients with heart failure. In this study, we investigated the interplay of LVMD assessed by gated SPECT imaging and impairment of cardiac sympathetic innervation assessed by cardiac 123I-MIBG activity to clarify incremental prognostic implications in patients with chronic systolic heart failure when these prognostic biomarker are independently identified.
Methods
Study patients
A total of 570 consecutive patients with LVEF < 50% who were admitted with congestive heart failure symptoms were enrolled in this study. The patients included 415 (73%) males with a mean age of 67.0 ± 12.6 years and a mean LVEF of 35.9 ± 10.7%. The diagnosis of heart failure at admission was established by clinical symptoms and signs according to the Framingham criteria including typical symptoms (palpitation, dyspnoea or orthopnoea), neck vein distension, peripheral oedema, lung rale, S3 or S4 gallop and tachycardia together with findings of chest X-ray and two-dimensional echocardiographic examinations such as cardiomegaly or left ventricular enlargement, bilateral lung congestion, pleural effusion, and left ventricular systolic dysfunction. Heart failure aetiologies such as ischaemic and non-ischaemic were established using a 12-lead electrocardiogram, echocardiography, and nuclear and/or angiographic examinations by excluding non-cardiac diseases showing similar symptoms and/or signs. Before enrolment to this study, 58 patients had undergone an implantable cardioverter defibrillator (ICD) treatment and 44 patients had undergone cardiac resynchronization therapy (CRT). Patients with overt malignancy, severe haemorrhagic diseases or neurological disorders such as Parkinson disease and Levy body dementia and patients undergoing treatment with tri-cyclic anti-depressants, reserpine, guanethidine, phenylpropanolamine and amphetamine, all of which inhibit cardiac 123I-MIBG uptake, were excluded from this study. This study included 105 patients (18.4%) with end-stage renal failure undergoing haemodialysis. Blood examinations of haemoglobin (Hb), sodium, creatinine and brain natriuretic peptide (BNP) levels were done before discharge. Kidney function was evaluated as estimated glomerular filtration rate (eGFR) using the following formulas: eGFR = 194 × Cre − 1.094 × Age − 0.287 for males and eGFR = 0.739 × male eGFR for females. Plasma BNP level was measured in the initial 175 patients (30.7%) and NT-pro BNP level was measured in the remaining 395 patients (69.3%). For statistical analysis of BNP and NT-pro BNP data, BNP and NT-pro BNP were classified into four stages based on the ESC guidelines for diagnosis and treatment of acute heart failure and chronic heart failure18: 0–40 pg/mL and 0–125 pg/mL for stage 1; 41–100 pg/mL and 126–400 pg/mL for stage 2; 101–200 pg/mL and 401–900 pg/mL for stage 3; and 201- pg/mL and 901- pg/mL for stage 4, respectively.
Two-dimensional echocardiographic examination
Standard two-dimensional and pulsed Doppler echocardiographic study was performed by experienced echo-cardiographers who were blinded to clinical and scintigraphic data. Based on the American Society of Echocardiography recommendations, the following echocardiographic functional parameters were measured from apical four-, three-, and two-chamber views in a left lateral decubitus position using commercially available ultrasound machines equipped with a 2.5-MHz variable frequency transducer: left atrium diameter (LAD; mm), diastolic left ventricular diameter (LVDd; mm), diastolic ventricular septal wall thickness(IVSTd; mm), diastolic ventricular posterior wall thickness(PTWd; mm) in M-mode measurement, left ventricular ejection fraction (LVEF, %), left ventricular diastolic volume (EDV; mL), left ventricular systolic volume (ESV; mL) in 2D-measurement, E wave velocity (m/sec), left ventricular deceleration time (Dct; msec) and septal E/e’. LV volumes and LVEF were measured using the biplane modified Simpson’s method. Echocardiographic data obtained in a stable condition before discharge were used for statistical analysis in this study.
Cardiac 123I-MIBG imaging
Following stabilization of the patient’s condition, cardiac imaging with 123I-MIBG of 111 MBq was performed using a gamma camera equipped with a low-energy, general-purpose collimator in a fasting and resting condition 15–30 min (early image) and 4 h (late image) after an intravenous tracer injection as described previously.16 Cardiac 123I-MIBG activity was measured as heart-to-mediastinum ratio (HMR) by a region of interest being manually set on the upper mediastinum and the whole cardiac region on a planar anterior image by an experienced nuclear medicine technician without knowledge any clinical data.123I-MIBG washout kinetics from the heart was calculated as washout rate (WR) from the early and late cardiac 123I-MIBG activities without a decay correction.
Assessment of cardiac mechanical dyssynchrony
Resting myocardial perfusion SPECT imaging with 99mTc-tetrofosmin of 300 MBq was performed by an electrocardiography-gated approach with a frame rate of 16 using a single-head camera equipped with a high-resolution, parallel-hole collimator. Using the commercially available gated SPECT software ‘Heart Function View (HFV version 1.1)’,8 LVMD was evaluated as a standard deviation (SD) of the regional onset-of-mechanical contraction phase angles (phase SD; unit, degrees) on a phase histogram created by Fourier phase analysis applied to regional time-activity curves obtained 3-dimensionally over the left ventricle (Figure1).8–10 This technique uses Fourier phase analysis to mathematically fit myocardial count changes depending on alterations of regional wall thickness over a cardiac cycle, which is basically identical to regional time-activity curves, for the calculation of regional phase angles of the curves on all SPECT slices over the left ventricle. Thus, a phase distribution map was expressed as a phase histogram and the degree of 3-dimensional LVMD was quantitatively evaluated as a phase SD on the phase map (Figure1).
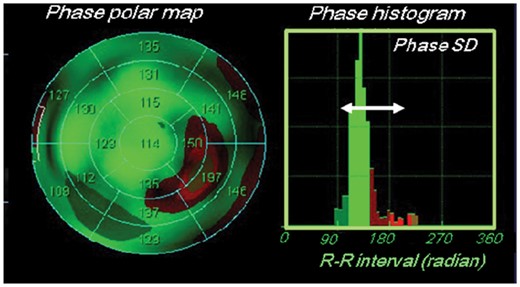
Polar map of phase angles (left) and phase standard deviation (SD) on a histogram (right) derived from gated myocardial perfusion SPECT study.
Follow-up protocol
Following the enrolment in this study, patients were prospectively and regularly followed up by cardiologists with a primary endpoint of lethal cardiac events such as sudden cardiac death, death due to pump failure and appropriate ICD shock against life-threatening ventricular tachyarrhythmias, all of which had been defined prior to the start of this study, for at least 1 year when a patient survived. Patients’ outcomes were clarified by reviewing medical records. Sudden cardiac death was defined as witnessed cardiac arrest and death within 1 h after onset of acute symptoms or unexpected death in patients known to have been well within the previous 24 h. This study was based on the principles outlined in the Declaration of Helsinki, and informed consent for enrolment in our database and usage for clinical study was obtained according to the guidelines of the ethics committee of our hospital.
Statistical analysis
Each statistical value is shown as mean ± 1 standard deviation (SD). Mean values were compared between the two groups using the unpaired t-test, and categorical variables were compared using the chi-square test. Following univariate analysis, multivariate analysis with a Cox proportional hazard model was performed using the statistically appropriate number of significant variables identified by univariate analysis, which depended on the number of cardiac events. Receiver operating characteristic (ROC) analysis was performed to determine the optimal cutoff value of an independent significant parameter such as phase SD derived from gated SPECT and HMR of cardiac MIBG activity. Significant (P < 0.05) determinants identified by univariate analysis were included in the multivariate models, and hazard ratios and 95% confidence intervals were estimated with the use of stratified Cox proportional hazards models. The Kaplan–Meier method was used to create time-dependent, cumulative event-free curves, which were compared using the log-rank test. For identification of incremental prognostic values of significant determinants, global chi-square values were calculated by combining several independent determinants determined by multivariable Cox analysis, based on increases in the overall likelihood ratio. A computer software program, SAS for Windows, version 9.4 (SAS Institute, Cary, North Carolina, USA), was used for these analyses. A P-value less than 0.05 was considered significant.
Results
Primary endpoints were documented in 166 (29%) of the patients as follows: 143 patients died of pump failure, there were 12 sudden cardiac deaths and 11 patients experienced appropriate ICD shocks against lethal ventricular arrhythmias. Figure2 shows two typical cases with and without a cardiac event.
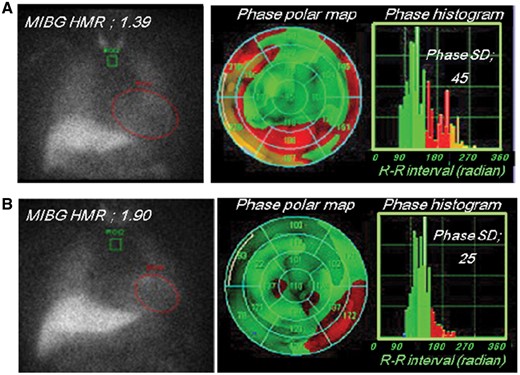
Case demonstration. A 48-year-old man with NYHA class 2 heart failure, a very low heart-to-mediastinum ratio (HMR) (1.39) and a wide phase SD (45) died suddenly during the follow-up period. A 78-year-old man with NYHA class 1 heart failure, a mildly reduced HMR (1.90) and a relatively small phase SD (25) had no lethal cardiac event during the follow-up period.
The cardiac event group were older and had greater NYHA class, lower eGFR and significantly higher BNP/NT-pro BNP concentration than the non-cardiac event group (Table1). Patients with cardiac events were more frequently treated with amiodarone, ICD than those without (Table2). Despite the similar LVEFs, patients in the cardiac event group had a larger left atrium, shorter deceleration time, greater E/e’, significantly reduced cardiac MIBG activity (HMR) and greater phase SD than did patients in the non-cardiac event group: early HMR, 1.63 ± 0.30 vs. 1.75 ± 0.26, P < 0.0001; late HMR, 1.46 ± 0.28 vs. 1.63 ± 0.29, P < 0.0001; and 39.1 ± 11.6 vs. 33.1 ± 10.1, P < 0.0001; respectively (Table3).
Comparison of clinical data between groups with and without cardiac events
| Cardiac event group (n = 166) | Non-cardiac event group (n = 404) | P-value | |
|---|---|---|---|
| Age (years old) | 71.4±11.2 | 65.3±12.8 | P < 0.0001 |
| Gender (male/female) | 126/40 | 289/115 | P = 0.0004 |
| Systolic blood pressure (mmHg) | 111±20 | 120±18 | P < 0.0001 |
| NYHA (I/II/III/IV) | 28/60/67/11 | 339/48/11/6 | P < 0.0001 |
| Past history | |||
| Hypertension | 83 (50.0%) | 210 (51.9%) | ns |
| Diabetes mellitus | 55 (33.1%) | 154 (38.1%) | ns |
| Dyslipidaemia | 54 (32.5%) | 164 (40.5%) | ns |
| Atrial fibrillation | 57 (34.3%) | 134 (33.2%) | ns |
| Ventricular tachycardia/ventricular fibrillation | 42 (25.3%) | 71 (17.5%) | ns |
| Haemodialysis | 39 (23.4%) | 66 (16.3%) | ns |
| Aetiology, Ischaemic | 78 (43.9%) | 182 (45.0%) | ns |
| Device implantation | |||
| ICD implantation | 25 (15.1%) | 33 (8.1%) | P = 0.0167 |
| CRT implantation | 16 (9.6%) | 28 (6.9%) | ns |
| Laboratory data | |||
| Haemoglobin (g/dL) | 11.3±2.2 | 12.3±2.2 | P <0.0001 |
| Creatinine (mg/dL) | 3.2±3.2 | 2.6±2.1 | P = 0.0001 |
| eGFR (mL/min/1.73m2) | 35.5±27.3 | 48.5±28.4 | P < 0.0001 |
| Sodium (mmol/L) | 139.7±4.1 | 139.7±3.6 | P = 0.0310 |
| NT-pro BNP (pg/mL) (n = 395) | 13612±21651 | 65713±20060 | P = 0.0013 |
| BNP (pg/mL) (n = 175) | 1324±1650 | 492±604 | P < 0.0001 |
| Stagings of BNP and NT-pro BNP (1/2/3/4) (n = 570) | 7/5/9/145 | 23/43/67/271 | P < 0.0001 |
Values are shown as mean ± standard deviation. ICD, implantable cardioverter-defibrillator; CRT, cardiac Resynchronization Therapy; eGFR, Estimated glomerular filtration rate; NYHA, New York Heart Association Classification; BNP, Brain natriuretic peptide; NT-pro BNP, N-terminal pro-brain natriuretic peptide; ns, no significance.
Comparison of medications between groups with and without cardiac events
| Cardiac event group (n = 166) | Non-cardiac event group (n=404) | P-value | |
|---|---|---|---|
| ACE-Is/ARBs | 102 (61.4%) | 234 (60.1%) | ns |
| Beta-adrenoceptor blocking agents | 155 (93.3%) | 366 (90.5%) | ns |
| Loop diuretics | 126 (75.9%) | 317 (78.4%) | ns |
| Aldosterone receptor antagonists | 46 (27.7%) | 123 (30.4%) | ns |
| Anti-vasopressin agents | 30 (18.1%) | 52 (12.9%) | ns |
| Calcium channel blockers | 34 (20.5%) | 112 (27.7%) | ns |
| Nitrates | 27 (16.3%) | 43 (10.6%) | ns |
| Amiodarone | 41 (24.6%) | 61 (15.1%) | P = 0.0028 |
| Nicorangil | 42 (25.3%) | 135 (33.4%) | ns |
| Anti-platelet agents/Anti-coagulation agents | 120(72.7%) | 290 (71.9%) | ns |
| Statins | 42(25.3%) | 164 (40.6%) | P = 0.0004 |
ACE-Is, angiotensin-converting enzyme inhibitors; ARBs, angiotensin receptor blockers; ns, no significance.
Comparison of echocardiographic, cardiac sympathetic function, and dyssynchrony parameters between groups with and without cardiac events
| Cardiac event group (n = 166) | Non-cardiac event group (n = 404) | P-value | |
|---|---|---|---|
| LVDd (mm) | 55.3±11.2 | 55.2±9.1 | ns |
| LVDs (mm) | 46.0±12.4 | 44.9±10.1 | ns |
| LAD (mm) | 43.3±7.6 | 41.7±7.3 | P = 0.0239 |
| IVSTd (mm) | 10.3±2.8 | 10.1±2.7 | ns |
| PTWd (mm) | 10.5±2.8 | 10.3±2.1 | ns |
| Modified Simpson method | |||
| LVEF (%) | 34.6±12.3 | 36.4±10.1 | ns |
| EDV(mL) | 156.8±71.1 | 154.0±58.9 | ns |
| ESV(mL) | 107.3±66.3 | 98.8±52.2 | ns |
| E wave velocity (m/sec) | 0.85±0.29 | 0.83±0.29 | ns |
| Dct (msec) | 175.0±78,1 | 192.2±75.9 | P = 0.0197 |
| E/septal e’ | 20.3±8.2 | 17.9±6.9 | P = 0.0007 |
| E/septal e’ (<15/15∼) | 50/116 | 180/224 | P = 0.0264 |
| Cardiac MIBG washout rate (%) | 28.5±9.7 | 27.1±10.1 | ns |
| Early HMR of MIBG activity | 1.63±0.30 | 1.75±0.26 | P < 0.0001 |
| Late HMR of MIBG activity | 1.46±0.28 | 1.63±0.29 | P < 0.0001 |
| Phase SD measured by gated SPECT | 39.1±11.6 | 33.1±10.1 | P < 0.0001 |
Values are shown as mean ± standard deviation (SD). LAD, left atrial diameter; LV, left ventricular; LVEF, left ventricular ejection fraction; LVDd, end-systolic left ventricular diameter; IVSTd, end-diastolic interventricular septal wall thickness; PWTd, end-diastolic posterior wall thickness; EDV, left ventricular end-diastolic volume; ESV, left ventricular end-systolic volume; Dct, left ventricular deceleration time; HMR, heart-to-mediastinum ratio; ns, no significance.
Optimal cutoffs of late HMR and phase SD were determined by ROC analysis to be 1.54 and 38 degrees, respectively, for identifying high-risk patients. Patients with late HMR less than 1.54 or phase SD greater than 38 had significantly lower event-free rates than did other patients (Figure 3A and B). Likewise, when late HMR of 1.60 and phase SD of 60, both of which had been shown to be cutoffs in another study,14 were applied to this study population, patients with lower late HMR or greater phase SD had significantly lower event-free rates than did other patients (Figure 3C and D). When classified into four subgroups using both late HMR and phase SD, patients with lower HMR and greater phase SD had the lowest event-free rate and, in contrast, patients with higher HMR and smaller phase SD had the highest event-free rate among the subgroups, independently of the definition of cutoff values (Figure4). Among significant univariate variables (Table4), the multivariate Cox proportional hazards model identified systolic blood pressure, NYHA functional class, eGFR, amiodarone use, late HMR of MIBG activity and phase SD as significant determinants of cardiac events with hazard ratios of 0.985 (CI, 0.975–0.995; P = 0.0037), 2.268 (CI, 1.847–2.784; P < 0.0001), 0.988 (CI, 0.980–0.995; P = 0.0021), 1.958 (CI, 1.287–2.955; P = 0.0018), 0.396 (CI, 0.215–0.712; P = 0.0020) and 1.015 (CI, 1.009–1.041; P = 0.0330), respectively. When combined with the four significant determinants (NYHA class, eGFR, late HMR, and phase SD) identified by Cox analysis, each prognostic power assessed by the global χ2 value synergistically (P < 0.0001) increased maximally up to 263.8 (Figure5).
Results of univariate and multivariate analyses
| Univariate analysis | |||||||
|---|---|---|---|---|---|---|---|
| 95% CI | |||||||
| χ2 | Hazard ratio | Lower | Upper | P-value | |||
| Age | 9.52 | 1.022 | 1.008 | ∼ | 1.038 | 0.0020 | |
| Gender | 4.51 | 0.636 | 0.402 | ∼ | 0.967 | 0.0377 | |
| Systolic blood pressure | 23.1 | 0.978 | 0.969 | ∼ | 0.987 | <0.0001 | |
| NYHA functional class | 149.8 | 3.733 | 3.076 | ∼ | 4.520 | < 0.0001 | |
| Haemoglobin | 18.9 | 0.859 | 0.803 | ∼ | 0.920 | < 0.0001 | |
| eGFR | 30.1 | 0.984 | 0.978 | ∼ | 0.989 | < 0.0001 | |
| BNP+NT-pro BNP stage | 13.5 | 1.519 | 1.201 | ∼ | 1.989 | 0.0002 | |
| Amiodarone | 30.2 | 2.746 | 1.932 | ∼ | 3.891 | < 0.0001 | |
| Statins | 8.3 | 0.606 | 0.421 | ∼ | 0.855 | 0.0040 | |
| Septal E/e’ | 18.4 | 1.050 | 1.027 | ∼ | 1.073 | < 0.0001 | |
| Late HMR | 46.5 | 0.106 | 0.054 | ∼ | 0.206 | < 0.0001 | |
| Phase SD | 30.1 | 1.048 | 1.029 | ∼ | 1.062 | < 0.0001 | |
Multivariate Cox-hazard model analysis | |||||||
95% CI | |||||||
| χ2 | Hazard ratio | Lower | Upper | P-value | |||
| Age | 0.01 | 1.013 | 0.984 | ∼ | 1.018 | 0.1153 | |
| Gender | 4.14 | 0.659 | 0.442 | ∼ | 1.043 | 0.0701 | |
| Systolic blood pressure | 8.42 | 0.985 | 0.975 | ∼ | 0.995 | 0.0037 | |
| NYHA functional class | 58.8 | 2.268 | 1.847 | ∼ | 2.784 | < 0.0001 | |
| Haemoglobin | 4.20 | 0.884 | 0.843 | ∼ | 1.011 | 0.0516 | |
| eGFR | 10.6 | 0.988 | 0.980 | ∼ | 0.995 | 0.0021 | |
| BNP+NT-pro BNP stage | 2.54 | 1.222 | 0.966 | ∼ | 1.567 | 0.1104 | |
| Amiodarone | 17.5 | 1.958 | 1.287 | ∼ | 2.955 | 0.0018 | |
| Statins | 0.28 | 0.896 | 0.598 | ∼ | 1.327 | 0.5907 | |
| Septal E/e’ | 1.78 | 1.016 | 0.997 | ∼ | 1.043 | 0.1814 | |
| Late HMR | 15.1 | 0.396 | 0.215 | ∼ | 0.712 | 0.0020 | |
| Phase SD | 4.54 | 1.015 | 1.009 | ∼ | 1.041 | 0.0330 | |
CI, confidence interval; HMR, heart-to-mediastinum ratio; NYHA, New York Heart Association.
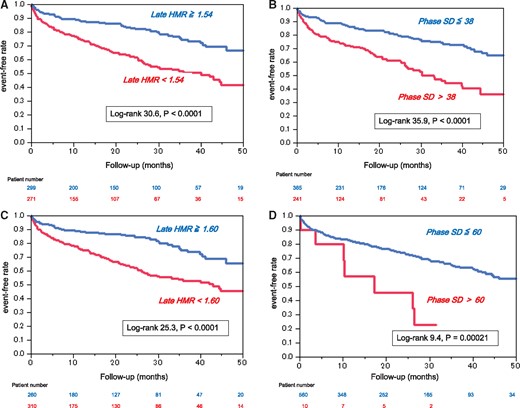
Kaplan–Meier estimates of cardiac event-free survival stratified by late heart-to- mediastinum ratio (HMR)<1.54 (A) and phase SD > 38 (B), both of which were optimal cut-offs identified in this study, and late HMR < 1.60 (C) and phase SD > 60(D).
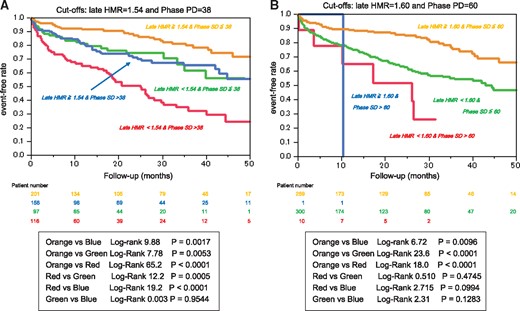
Kaplan–Meier estimates of cardiac event-free survival stratified by the combination of late heart-to-mediastinum ratio (HMR)<1.54 and phase SD > 38 (A) or late HMR < 1.60 and phase SD > 60 (A).
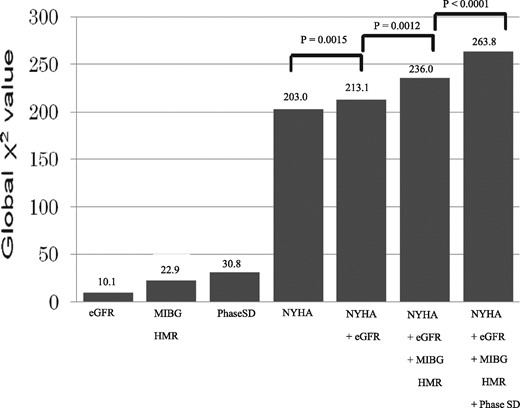
Synergistic increases in prognostic powers assessed by global chi-square values using four determinants of cardiac events: NYHA functional class, estimated glomerular filtration rate (eGFR), late heart-to-mediastinum ratio (HMR) (1.54), and phase SD (38).
Discussion
The results of the present study clearly showed that a global left ventricular systolic dyssynchrony identified by increased phase SD is not only a significant independent determinant of lethal cardiac events but also has incremental prognostic values in combination with impairment of cardiac sympathetic innervation and clinical information such as NYHA functional class and kidney function in heart failure patients.
Despite the definitive prognostic values of CRT in HFrEF patients with a wide QRS complex, nearly one third of HFrEF patients do not respond to CRT,3–5 strongly suggesting the limitation of current CRT criteria using NYHA class III/IV, depressed LVEF and prolonged QRS duration (electrical dyssynchrony).5 When compared to electrical dyssynchrony, global LVMD has several advantages. LVMD assessed by gated SPECT imaging with 99mTc-tetrofosmin reflects three-dimensional inhomogeneity in myocardial perfusion abnormality, cardiomyocyte injury and metabolic impairment (depletion of high-energy phosphate) of the myocardium, all of which result in heterogeneous electrophysiological instability, arrhythmogenecity and a loss of contractile force. Together with earlier findings,11–14,19 the presented study demonstrated that LVMD is superior to conventional prognostic markers such as LVEF, BNP, and a wide QRS complex in heart failure20,21 and is a powerful biomarker of temporal heterogeneity of contractile derangement responsible for lethal cardiac events. On the other hand, impairment of cardiac sympathetic innervation has been shown to be related to lethal outcomes in patients with heart failure undergoing pharmacological and ICD treatments independently of electrophysiological indices, LVEF, BNP, and myocardial perfusion defect.22–29 Similarly, the therapeutic response to CRT is likely to depend on cardiac sympathetic innervation assessed by cardiac MIBG activity.30–33 Thus, combined assessment of LVMD and cardiac sympathetic innervation possibly improves identification of high-risk patients with heart failure who can most benefit from device therapy in a more appropriate risk-based and cost-effective manner.
As shown by a recent multiple cohort investigation,16 assessment of cardiac sympathetic innervation using cardiac MIBG activity can precisely identify patients at low risk and at high risk for cardiac mortality over a period of 5 years or more, particularly when used in combination with standard clinical biomarkers such as age and NYHA functional class. The present study showed independent and incremental prognostic values of LVMD (increased phase SD > 38) and impairment of cardiac sympathetic function (reduced HMR of MIBG activity <1.54) in HFrEF patients. The ADMIRE-HF sub-study using the propensity- matching14 showed that phase SD > 60 and MIBG HMR <1.60 were significant and incremental determinants of sudden cardiac death in 170 patients with LVEF of 35% or less. The optimal cut-off values of HMR and LVMD determined by using ROC analysis in this study were smaller than those in the ADMIRE-HF sub-study. This is probably because there are differences in clinical backgrounds, patient number and method to determine cut-off values. Also when the ADMIRE-HF cut-off values were applied to our patients, high-risk patients were clearly differentiated from the others. Besides the relatively short-term follow-up interval,14,15 the number of high-risk patients identified by the ADMIRE-HF cut-off values were apparently smaller than that identified by our cut-off values (11 vs. 116, in Figure5). From these findings, ROC-identified cut-off values of phase SD and HMR in this study are likely to more reasonably risk-stratify patients and to identify HFrEF patients at an increased risk for lethal cardiac events.
Phase SD derived from histogram analysis of multiple-gated myocardial perfusion data was used as a marker of LVMD in this study. This is because this parameter is quantified three-dimensionally using count-based data of mechanical contraction in the whole left ventricle and is less affected by artefactual technical errors.8,14 A high-ordered phase analysis of time-activity curves at each pixel has a high reproducibility and reliable quantitativity and can be standardized using an appropriate database for the assessment of global LVMD.8 Gated myocardial perfusion SPECT imaging can be easily performed for the measurement of LVMD in conjunction with assessment of myocardial ischaemia and viability cardiac function without any additional cost or imaging time. On the other hand, a prolonged QRS complex is an electrical, but not mechanical, dyssynchrony index that is non-specific for heart failure pathophysiology and not necessarily related to impairment of cardiac function and heart failure outcomes, and the mechanisms have not been fully determined probably due to etiological diversity.34
Our previous studies16,35,36 showed prognostic values of HF risk models using several significant determinants, including cardiac MIBG data. The recent ESC heart failure guidelines published in 2016 recommend the Seattle Heart Failure Model37 in combination with BNP for the risk assessment of patients with HFrEF. In addition, Kuramoto et al.38 showed the efficacy of cardiac MIBG imaging to improve the prognostic power of the Seattle heart failure model in patients with chronic heart failure. Although this study was not designed to evaluate the Seattle heart failure model together with LVMD and cardiac sympathetic innervation, the presented results clarified the synergistic improvement in prognostic values of NYHA functional class, eGFR, LVMD, and MIBG activity (HMR). These findings strongly suggest further advance in a multiple-risk model using significant biomarkers mentioned above for more appropriate selection of therapeutic strategy in patients with HFrEF.
Limitations and future perspectives
Since this study was a retrospective, observational study, a prospective multicentre study is needed particularly for the establishment of a risk-based therapeutic strategy using assessment of LVMD, cardiac sympathetic innervation and clinical variables presented here. As shown previously,26,28 myocardial viability or perfusion abnormality are also important for predicting lethal cardiac event risk and benefits from ICD therapy. The extent and location of myocardial scar and LV lead position are determinants of the effectiveness of CRT together with LVMD.3–5 Therefore, three-dimensional SPECT assessment of myocardial scar and viability possibly optimizes pacing lead placement and maximizes therapeutic response to CRT. It remains to be determined whether the combined assessment of LVMD and cardiac sympathetic innervation can predict a mode of death such as sudden cardiac death, death due to pump failure or both. Finally, because of limited medical resources and growing medical costs associated with out-patient care, recurrent hospitalization and widespread use of device therapy, there is a need to establish more cost-effective management of heart failure and more appropriate selection of device candidates using the methods presented here.
Conclusions
Left ventricular mechanical dyssynchrony and impairment of cardiac sympathetic innervation are independently and synergistically related to lethal cardiac events. Their combined assessment can not only improve risk-stratification and prediction of lethal cardiac outcomes but also may contribute to maximizing clinical benefits of drug and device treatment in heart failure patients with reduced left ventricular ejection fraction.
Acknowledgements
The authors sincerely thank the staff of the Nuclear Medicine Laboratory, Obihiro-Kosei General Hospital, Obihiro, Hokkaido, Japan, for cooperation with clinical services and their technical assistance.
Conflict of interest: None declared.
